Evaluating the free market by comparing it to the alternatives (We don't need more regulations, We don't need more price controls, No Socialism in the courtroom, Hey, White House, leave us all alone)
Thursday, August 12, 2021
How to Understand the New IPCC Report: Part 2, Extreme Events
Contrary to what you've been reading, the massive new IPCC report offers grounds for optimism on climate science and policy
"This is a long post on what the new IPCC Working Group 1
report says about the detection and attribution of trends in the
frequency and intensity of climate and weather extremes. I first explain
this terminology of the IPCC and then I systematically go through what
the report says phenomenon by phenomenon. This is a topic I’ve published
widely on for over 25 years (see this short book for a recent summary).
For
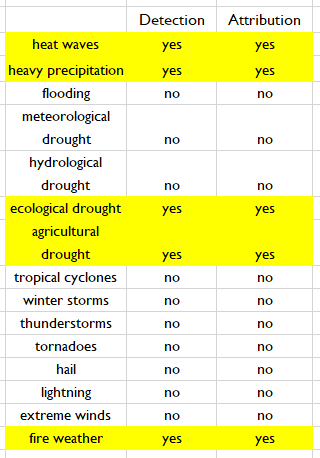
those readers just wanting the conclusions, let’s start there (ignoring
here levels of certainty and confidence and focusing at the global
scale).
These
conclusions are substantially similar to those of the previous IPCC WG1
report of 2013, which is not surprising, as a few more years of data on
trends observed over many decades or longer wouldn’t be expected to change detection.
These conclusions of the IPCC, and presented in the language of the IPCC below, indicate that it is simply incorrect
to claim that on climate time scales the frequency or intensity of
extreme weather and climate events has increased for: flooding, drought
(meteorological or hydrological), tropical cyclones, winter storms,
thunderstorms, tornadoes, hail, lightning or extreme winds (so, storms
of any type).
Surprised?
Let’s get to the details.
Detection and Attribution
Understanding
the IPCC’s latest conclusions on extreme weather and climate requires a
brief introduction to some technical terminology. The IPCC has long
used a two-part framework to (a) identify changes in climate, called detection, and (b) to explain why identified changes may have occurred, called attribution.
Detection
of change is defined as the process of demonstrating that climate or a
system affected by climate has changed in some defined statistical
sense, without providing a reason for that change. An identified change
is detected in observations if its likelihood of occurrence by chance
due to internal variability alone is determined to be small, for
example, <10%.
Attribution
is defined as the process of evaluating the relative contributions of
multiple causal factors to a change or event with an assessment of
confidence.
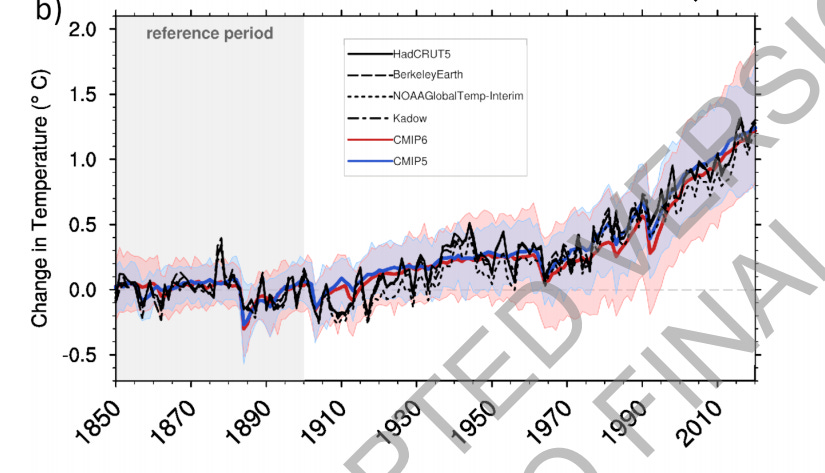
Let’s look at an example showing how the
IPCC employs this framework, with a focus on global average surface
temperatures. The figure below (3.4b) shows change global average
surface temperature for several methods from 1850 to 2020.
You
don’t have to be a statistician to see that temperature since 1900 has
increased as compared to an earlier reference period of 1850 to 1900.
This indicates a change in climate for this metric. In the vernacular of
the IPCC, detection has been achieved.
Once a change in
climate has been detected, the next step is to explore why. It is
important to understand that just because a weather or climate variable
exhibits change over climate time scales (typically 30 years or longer) does not tell us why that change has occurred.
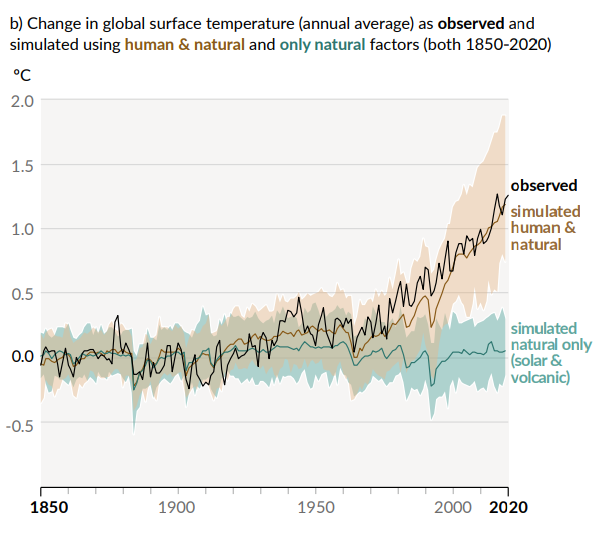
The
IPCC uses computer models to explain observed changes in global
temperature. The figure below (SPM.1b) shows global average surface
temperatures from computer models that are run with and without human
contributions to climate. The black line shows the historical
observations, as above.
You
can see that the computer models run with human factors much better
matches historical observations. This is one (of several) bases for the
IPCC’s conclusion that the detected change in temperatures can be attributed to human factors.
OK,
thanks for sticking with the introductory lesson. We can now get to the
main action, and follow along with the IPCC’s use of its detection and
attribution framework to summarize what the report says about weather
and climate extremes.
The IPCC on Detection and Attribution of Weather and Climate Extremes
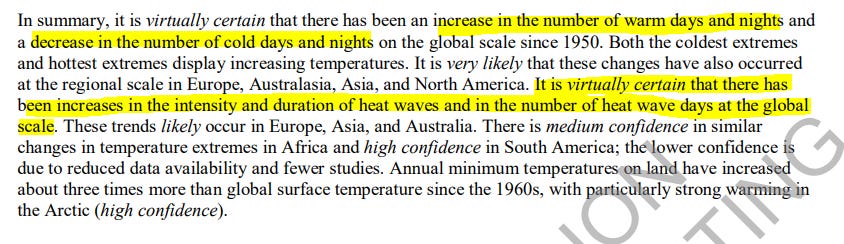
Heat
Waves: “It is virtually certain that there has been increases in the
intensity and duration of heat waves and in the number of heat wave days
at the global scale”
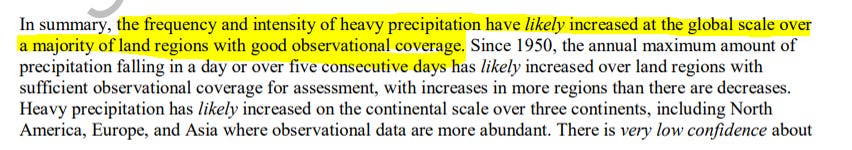
Heavy
precipitation: “the frequency and intensity of heavy precipitation have
likely increased at the global scale over a majority of land regions
with good observational coverage”
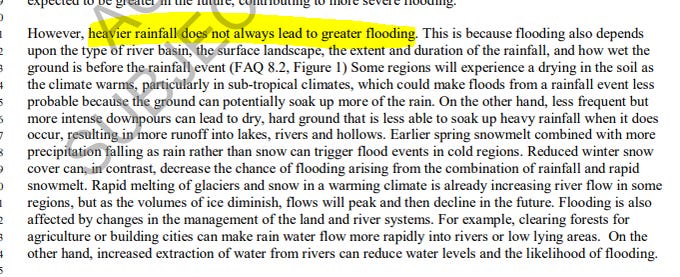
The
IPCC (in its accompanying FAQ) recognizes that “heavier rainfall does
not always lead to greater flooding.” This is something that we first
argued more than two decades ago (here and here),
and it is great to see it explicitly acknowledged in the IPCC report.
To make claims about trends in flooding, one should look at trends in
flooding and not precipitation. The conflation of the two is a common
error.
Flooding
(detection): “Confidence about peak flow trends over past decades on
the global scale is low, but there are regions experiencing increases,
including parts of Asia, southern South America, the northeast USA,
northwestern Europe, and the Amazon, and regions experiencing decreases,
including parts of the Mediterranean, Australia, Africa, and the
southwestern USA.”
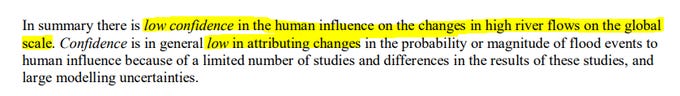
Flooding (attribution): “there is low confidence in the human influence on the changes in high river flows on the global scale”
Drought.
The IPCC has distinguished four types of drought: hydrological,
meteorological, ecological and agricultural. That means that simply
saying “drought” in the context of the IPCC report is incomplete, and
potentially confusing. Here is what the report says about each:
Hydrological
drought: “There is still limited evidence and thus low confidence in
assessing these trends at the scale of single regions, with few
exceptions”
Meteorological drought: “The regional
evidence on attribution for single AR6 regions generally shows low
confidence for a human contribution to observed trends in meteorological
droughts at regional scale, with few exceptions”
Ecological
and agricultural drought: “There is medium confidence that human
influence has contributed to changes in agricultural and ecological
droughts and has led to an increase in the overall affected land area”
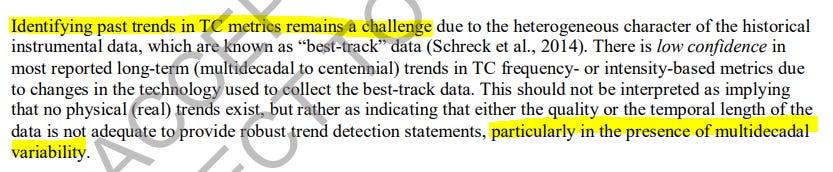
Tropical
cyclones: “There is low confidence in most reported long-term
(multidecadal to centennial) trends in TC frequency- or intensity-based
metrics”
I do know a few things about this topic, haven published widely on tropical cyclones. The denigration of the TC “best track” dataset is bizarre. The dataset is the highest quality available on tropical cyclones around the world and widely used in research.
It’d be a shame if the IPCC process were to have been used to promote
certain work by denigrating the widely recognized best available data.
There are othercuriosities in this section as well.
But
even so, the lack of overall trends in tropical cyclone frequency and
intensity over climate time scales (and not just since 1980!) is pretty
difficult to deny once you look at the data. While our work on US or global landfalls, showing no long-term increasing trends, did not make it into the report, the more comprehensive assessments of the World Meteorological Organization does have this information.
Winter
storms: “There is low confidence in observed recent changes in the
total number of extratropical cyclones over both hemispheres. There is
also low confidence in past-century trends in the number and intensity
of the strongest extratropical cyclones over the Northern Hemisphere…”
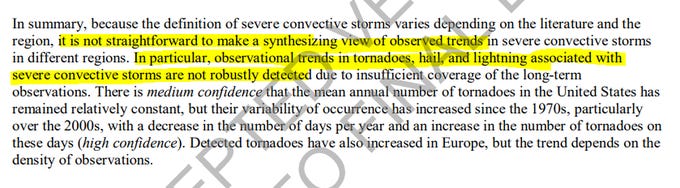
Thunderstorms,
tornadoes, hail, lightning: “observational trends in tornadoes, hail,
and lightning associated with severe convective storms are not robustly
detected due to insufficient coverage of the long-term observations”
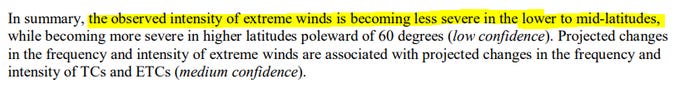
Extreme
winds (between 60S and 60N): “the observed intensity of extreme winds
is becoming less severe in the lower to mid-latitudes, while becoming
more severe in higher latitudes poleward of 60 degrees (low confidence)”
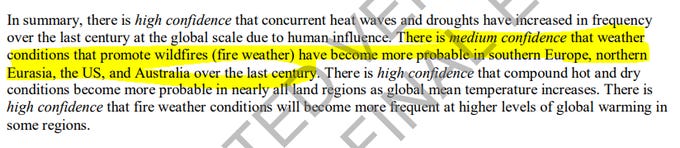
Fire
weather: “There is medium confidence that weather conditions that
promote wildfires (fire weather) have become more probable in southern
Europe, northern Eurasia, the US, and Australia over the last century”
That
is it for Part 2. The next installment will take a close look at
so-called “event attribution” — a methodology developed to support
climate lawsuits as it became apparent that the IPCC’s conventional
approach to detection and attribution was failing to find changes in
many types of extreme events. Stay tuned!"
No comments:
Post a Comment
Note: Only a member of this blog may post a comment.

No comments:
Post a Comment
Note: Only a member of this blog may post a comment.