Friday, September 30, 2022

Mandated Diversity Statement Drives Jonathan Haidt To Quit Academic Society

Prominent social psychologist and NYU professor calls the requirement “explicitly ideological.”

By J.D. Tuccille of Reason.

"It was probably inevitable that Jonathan Haidt, an academic long concerned about the politicization of academia, would eventually be caught up in the displacement of intellectual inquiry by ideological rigidity.

Last week the New York University (NYU) psychology professor announced that he would resign at the end of the year from the Society for Personality and Social Psychology, his primary professional association, because of a newly adopted requirement that everybody presenting research at the group's conferences explain how their submission advances "equity, inclusion, and anti-racism goals." It was the sort of litmus test against which he has warned, and which he sees as corroding institutions of higher learning.

"Telos means 'the end, goal, or purpose for which an act is done, or at which a profession or institution aims,'" he wrote in a Sept. 20 piece published on the website of Heterodox Academy, an organization he cofounded that promotes viewpoint diversity on college campuses, and republished by the Chronicle of Higher Education. "The telos of a knife is to cut, the telos of medicine is to heal, and the telos of a university is truth."

"The Society for Personality and Social Psychology (SPSP)—recently asked me to violate my quasi-fiduciary duty to the truth," he added. "I was going to attend the annual conference in Atlanta next February to present some research with colleagues on a new and improved version of the Moral Foundations Questionnaire. I was surprised to learn about a new rule: In order to present research at the conference, all social psychologists are now required to submit a statement explaining 'whether and how this submission advances the equity, inclusion, and anti-racism goals of SPSP.'"

Such diversity, equity, and inclusion (DEI) statements have proliferated at universities and in academic societies, he notes, even though "most academic work has nothing to do with diversity, so these mandatory statements force many academics to betray their quasi-fiduciary duty to the truth by spinning, twisting, or otherwise inventing some tenuous connection to diversity."

But the SPSP requirement went a step further, dropping "diversity" in favor of "anti-racism," a term frequently associated with Boston University's Ibram X. Kendi, author of How to Be an Antiracist and other works. Among the book's passages is a widely shared one highlighted by Haidt:

"The only remedy to racist discrimination is antiracist discrimination. The only remedy to past discrimination is present discrimination. The only remedy to present discrimination is future discrimination."

That's an "explicitly ideological" interpretation of social interactions, Haidt objects, along with prescribed remedies to which he has moral and professional objections. He believes individual members of SPSP should be free to adopt the sentiment themselves, but adherence shouldn't be compelled.

"So I'm going to resign from SPSP at the end of this year, when my membership dues run out, if the policy on mandatory statements stays in place for future conventions," he concludes.

Mandatory DEI statements became a concern well before Haidt's run-in with the SPSP and the substitution of "anti-racism" for diversity." Just weeks ago, Reason's Emma Camp noted that "in many American universities, prospective professors are now expected to include lengthy diversity, equity, and inclusion (DEI) statements in their job applications."

A recent American Association of University Professors survey found that DEI criteria are included in consideration for tenure at 21.5 percent of colleges and universities, and at 45.6 percent of large institutions of higher education.

"In many cases, these policies threaten to restrict employment or advancement opportunities for faculty who dissent from the prevailing consensus on DEI-related issues of public and academic interest," warns the Foundation for Individual Rights and Expression (FIRE). "These policies may even negatively impact faculty who broadly agree with their institution's DEI values but disagree on some of the specifics, or who simply cherish the right to speak without compulsion."

FIRE acknowledges that private institutions have the right to adopt any ideological requirements they wish (public institutions are bound by the First Amendment). But it says DEI mandates threaten the commitments to free speech and academic freedom that most universities espouse.

"Academics seeking employment or promotion will almost inescapably feel pressured to say things that accommodate the perceived ideological preferences of an institution demanding a diversity statement, notwithstanding the actual beliefs or commitments of those forced to speak," agrees the Academic Freedom Alliance in a statement released last month.

Haidt, years ago, sounded the alarm that colleges and universities were compromising their intellectual mission with growing commitment to a particular set of political beliefs.

"I believe the conflict reached its boiling point in the fall of 2015 when student protesters at 80 universities demanded that their universities make much greater and more explicit commitments to social justice, often including mandatory courses and training for everyone in social justice perspectives and content," he wrote in 2016. "Now that many university presidents have agreed to implement many of the demands, I believe that the conflict between truth and social justice is likely to become unmanageable."

The conflict certainly became unmanageable for Haidt himself, who chose what he sees as the pursuit of truth over required affirmation that his work serves a political purpose. He's still uncertain how his dispute with the SPSP will shake out, or the ultimate fate of academia writ large.

"I have gotten about a dozen supportive emails from other social psychologists, and no real criticism beyond a few psychologists on Twitter who, perhaps shaped by Twitter, go to great lengths to assume the worst about me and my motives for writing the essay," Haidt told me by email. "I have the sense that there is a large generational split. Psychologists and academics who are older than me (I'm 58) seem uniformly supportive: they are all on the left, and the left used to be creeped out by loyalty oaths, whether administered by the McCarthyite right or the Soviet left. But young people on the left seem to be very comfortable requiring such pledges."

Where SPSP stands on the matter can only be inferred from Its actions. Officials in the professional society acknowledged my query but hadn't responded by deadline. As of now, everybody presenting research at the society's upcoming conference will have to pledge that their work advances political goals."
Allowing foreign airlines to fly U.S. domestic routes might lower fares

See Open the Skies! by Alex Tabarrok.

"Here’s a list of the world’s top ten airlines:

    Qatar Airways
    Singapore Airlines
    Emirates
    ANA (All Nippon Airways)
    Qantas Airways
    Japan Airlines
    Turkish Airlines
    Air France
    Korean Air
    Swiss International Air Lines 

The airlines in this list have at least two things in common: None of world’s best airlines are US owned and none of them are allowed to operate domestically in the United States. The two common elements are related because so-called “cabotage laws” prohibit foreign airlines from serving domestic travelers.

Imagine what international travel would be like if you could only fly on a US owned airline? Ok it’s not that hard to imagine. Restricting international flights to domestic airlines would make international travel much more expensive and more inconvenient. The US State Department rightly lauds the Open Skies Agreements that have brought competition to international flights:

Since 1992 the United States has pursued an “Open Skies” policy designed to eliminate government intervention in airline decision-making about routes, capacity, and pricing in international markets…Open Skies agreements expand cooperative marketing opportunities between airlines, liberalize charter regulations, improve flexibility for airline operations, and commit both governments to high standards of safety and security.  They are pro-consumer, pro-competition, and pro-growth, and facilitate countless new cultural links worldwide.

True! But US domestic flights fly on Closed Skies. Europe has opened up competition to all European airlines. Indeed, Europe is also substantially open to US carriers, but the US is closed to foreign carriers for domestic flights. Cabotage laws are, in effect, a Jones Act for the airlines.

In a good review, Scott Lincicome summarizes:

Europe’s deregulatory experiences—and our own—show that nixing cabotage restrictions would not only put additional downward pressure on fares but also likely improve route coverage and maybe even customer service."

Thursday, September 29, 2022

Looks Like Some Pretty Good Capitalists Run The Congress

 This is actually a post from 2009. But I thought it worth sharing again.

Go to Policy, portfolios and the investor lawmaker: As stock ownership rises in Congress, experts warn of potential ethics concerns from the Washington Post this past week.

Most members of the House of Representatives own stock. The article says "The investments increasingly put lawmakers in the position of voting or advocating on matters that could affect their personal wealth, whether the lawmakers realize it or not."

Politicians who rarely agree on anything might be found to be voting for the same bill if it matters to their pocket book. They are supposed to report what they own but the drag their feet and the records are not very well computerized, so they are harder to analyze. And they are good at this investing stuff. From 1985-2001, the legislators beat the market by .55 basis points a month. In a year that means 6.6 percentage points above the market.

In that time, the market (DJIA) gained just a bit under 1% a month (from 12-31-85 to 12-31-2001). It went from 1,546 to 10,021. So, if you had $1,546 in the market it became worth $10,021. But, if you were a member of Congress, it rose about 1.5% a month and you would have ended up with $26,970. Each dollar in the market grew into $6.48 while for the lawmakers it grew into $17.44.

"The researchers, whose findings were presented at a congressional hearing in July, said the statistics suggest that those unusual returns must be based on lawmakers' access to "government and important social contacts.""

But legislators acting on their self interest is not new. Charles Beard wrote about this in his book An Economic Interpretation of the Constitution of the United States. He argued that self-interest was a big force in how the framers wrote the constitution.

In the 1950s, Forrest McDonald We the People : The Economic Origins of the Constitution, in attempt to refute Beard. But more recently, economic historian Robert A. McGuire wrote a book called To Form a More Perfect Union: A New Economic Interpretation of the United States Constitution. He used modern statistical analysis to show that the Beard thesis may be legitimate.

My students might recall something like this that I talk about on the first day of the semester. Congressmen in the early 1790s voted on the "Funding and Assumption Act" based on how much money they would receive if that bill passed. The bill paid back all of the debts from the Revolutionary War at full value (they were not getting paid back before the Constitution was passed because under the Articles of Confederation all states had to agree to a tax increase-this did not happen much so taxes were never raised to pay back the money the government borrowed to finance the war). But under the Constitution if both the House and the Senate passed a tax increase and the president signed it, it became law.

The debts were securities or bonds. Some congressman owned them. I found how much about half the congressmen owned in these bonds from McDonald's book. The ones who voted yes on the bill had an average of about $6,000 while the ones who voted no had about $700. So it is possible that money influenced the vote. 

Here is a passage from John Spencer Bassett's book about the "Funding and Assumption Act" The Federalist System, 1789-1801:

"All the speculating class, in Congress and out of it, were zealously in favor of the scheme; and while it was till being debated they were trying to by all the means known to their class to buy up, even in the remote parts of the country, the old bonds at the depreciated values."
Here are they guys who voted yes and their dollar value of their bond holdings:

AMES 35
BASSETT 0
BURKE 5252
BUTLER 0
CLYMER 14000
DALTON 12
DCARROLL 227
ELLSWORTH 5985
FITZSIMMONS 2668
GALE 4252
GERRY 50000
GROUT 0
IZARD 20865
JOHNSON 0
KING 10000
LANGDON 27921
MORRIS 11000
PARTRIDGE 2195
PATERSON 0
READ 341
SEDGWICK 1680
SHERMAN 7729
STRONG 10903
STURGES 189
SUMTER 0
WADSWORTH 1625
WHITE 1619
WLSMITH 11910

Now the no votes

BALDWIN 2500
COLES 0
FEW 640
GILMAN 1025
GRIFFIN 0
HARTLEY 0
LIVERMORE 0
MADISON 0
MATHEWS 0
MJSTONE 3814
MOORE 0
MUHLENBERG 0
SCOTT 127
WILLIAMSON 2600

Why Entrepreneurs Are Moving to Florida and Texas

By Chris Edwards of Cato.

"About 3% of families move to different states each year in search of nicer climates, lower living costs, and other advantages. The rise of remote working is giving people more flexibility on where to locate. At the same time, more than 3 million people reach the age of 65 each year, and many are looking for attractive places to retire.

How can states attract interstate movers? IRS data suggest that tax burdens are one driver of migration. Of the 25 lowest‐​tax states, 20 enjoyed net in‐​migration from other states in 2020.

Top earners may be particularly responsive to interstate tax differences. Elon Musk apparently saved half a billion dollars when he moved from California, with its 13.3% top income tax rate, to Texas, with its zero rate. Numerous leaders in finance, such as Carl Icahn, have escaped from New York City and its 14.8% top income tax rate and settled in Florida, with its zero rate.

The IRS data confirm the news stories about top earners moving to low‐​tax states. For households with incomes above $200,000, California is losing two households for each one it gains, and New York is losing three households for each one it gains.

On the flip side, Florida is gaining more than two top‐​earning households for each it loses. Eight of the nine states that do not have income taxes enjoy net in‐​migration of top earners.

Why should state policymakers care if top earners move out?

First, states lose a lot of income when top earners leave. The IRS data show that households earning more than $200,000 were 7% of interstate movers in 2020 but accounted for 41% of all movers’ income.

Top earners also generate a lot of state tax revenue. In California, the top 1% of earners pay almost half of all state income taxes. California tries to raise revenue with high taxes on top earners, but when they move out of the state, it loses all the income, sales, and property taxes they would have paid.

Further, entrepreneurs often bring their businesses and related jobs with them when they move. In Florida, West Palm Beach has a booming finance industry fueled by transplanted New York‐​area entrepreneurs. Meanwhile, Musk is expanding Tesla and SpaceX in his new home of Texas.

The wealthy often make large contributions to charities in their own states, and those funds leave with the donor. Musk has moved his charitable foundation with him to Texas, which may tilt the foundation’s giving to projects in that state.

Finally, many top earners are angel and venture investors in startup companies. These investors provide guidance and oversight to entrepreneurs, and so they usually invest close to home. If a state loses top earners, it may also lose funding for startups.

Policymakers are waking up to the new realities of interstate tax competition. By my count, more than 20 states have cut their income tax rates in just the past two years. The natural environment gives states such as Florida an edge in attracting residents, but northern states such as New Hampshire and South Dakota have also generated consistent in‐​migration with their low‐​tax policies.

Some analysts worry about a “race to the bottom” as states compete to cut taxes. But states such as Florida have maintained their low taxes by operating their governments efficiently. New York and Florida have about the same population, but the latter provides its state and local services with 26% fewer government employees than the former.

People are going to keep on moving. State policymakers should embrace the challenge by running lean governments, restraining tax burdens, and cutting income tax rates."

Government program allows hospitals to make huge profits on drugs

See "Great" Moments in Aribitrage by David Henderson.

"Ringed by public housing projects, Richmond Community consists of little more than a strapped emergency room and a psychiatric ward. It does not have kidney or lung specialists, or a maternity ward. Its magnetic resonance imaging machine frequently breaks, and was out of service for seven weeks this summer, said two medical workers at the hospital, who requested anonymity because they still work there. Standard tools like an otoscope, a device used to inspect the ear canal, are often hard to come by.

Yet the hollowed-out hospital — owned by Bon Secours Mercy Health, one of the largest nonprofit health care chains in the country — has the highest profit margins of any hospital in Virginia, generating as much as $100 million a year, according to the hospital’s financial data.

This is from Katie Thomas and Jessica Silver-Greenberg, “How a Hospital Chain Used a Poor Neighborhood to Turn Huge Profits,” New York Times, September 24, 2022.

What’s the key to Bon Secours’ success? The U.S. government’s 340B program. It’s been well known for some time what a scam this program is. The two reporters explain:

When Bon Secours bought Richmond Community, the hospital served predominantly poor patients who were either uninsured or covered through Medicaid, which reimburses hospitals at lower rates than private insurance does. But Bon Secours turned the hospital’s poverty into an asset.

The organization seized on a federal program created in the 1990s to give a financial boost to nonprofit hospitals and clinics that serve low-income communities. The program, called 340B after the section of the federal law that authorized it, allows hospitals to buy drugs from manufacturers at a discount — roughly half the average sales price. The hospitals are then allowed to charge patients’ insurers a much higher price for the same drugs.

The theory behind the law was that nonprofit hospitals would invest the savings in their communities. But the 340B program came with few rules. Hospitals did not have to disclose how much money they made from sales of the discounted drugs. And they were not required to use the revenues to help the underserved patients who qualified them for the program in the first place.

That’s arbitrage, but not in a good way, backed by the federal government.

The authors note:

Thanks to 340B, Richmond Community Hospital can buy a vial of Keytruda, a cancer drug, at the discounted price of $3,444, according to an estimate by Sara Tabatabai, a former researcher at Memorial Sloan Kettering Cancer Center.

But the hospital charges the private insurer Blue Cross Blue Shield more than seven times that price — $25,425, according to a price list that hospitals are required to publish. That is nearly $22,000 profit on a single vial. Adults need two vials per treatment course."

Wednesday, September 28, 2022

Get the Facts Straight on Yeshiva Education

Hasidic Jewish students should be compared with other English-language learners, and graduates earn substantial incomes

Letter to WSJ.

"The perspective of yeshiva parents like Sheva Tauby (“The Campaign Against Our Yeshivas,” Houses of Worship, Sept. 16) was sorely lacking in the New York Times cover story to which she replies. The Times highlighted about a dozen Hasidic primary schools that fared much worse than public schools on state exams. But the relevant comparison is to other students who come from homes where English isn’t the primary language.

Once we compare apples to apples, the yeshiva results no longer appear exceptional. On the 2019 state English Language Arts exam, there were 155 New York City public schools in which fewer than 1% of English Language Learning (ELL) students performed at grade level. In more than 95% of New York City public schools, at least two-thirds of ELL students failed to perform at grade level.

More important: Are yeshiva graduates prepared to earn a living? The Times cited high poverty rates in Hasidic communities, but the rates are distorted by larger family sizes and a younger median age. Household income provides a more accurate picture of the ability of Hasidic Jews to find decent jobs, and on that measure they outperform the general public. More specific data is needed, but a 2021 study found a median Haredi household income of $102,000.

As Ms. Tauby notes, the yeshiva system produces communities with a high degree of social capital and low rates of crime and other social ills. The Times should investigate how it manages to do that. The public-school system might learn something.

Jason Bedrick

Research fellow, Heritage Foundation

Phoenix"


The Migrant Influx Could Help With the Labor Shortage

The surge at the border isn’t going away. Making more work visas available would solve two problems

By Jason L. Riley. Excerpts:

"the Biden administration doesn’t have a problem with moving illegal immigrants around the country after they arrive here. It just has a problem with Republican governors doing it.

When the administration transports migrants from Texas to New York, as it has been doing on the down-low for more than a year, it’s called “resettlement.” When Texas Gov. Greg Abbott does the same thing in a much more transparent fashion, it’s labeled “human trafficking.” The proper name for all this is political theater"

"Immigrants are being sent to liberal strongholds such as Chicago, Washington and Martha’s Vineyard, a celebrity vacation destination in Massachusetts. States and cities that for years have described themselves as “sanctuaries” for undocumented migrants—including violent criminals—and have ostentatiously refused to cooperate with federal immigration-enforcement officials, are now getting a tiny taste of what it’s like these days to be a southern-border state. Local healthcare and education resources are being overburdened, social safety nets are being strained, and lawmakers in Washington are pointing fingers at one another."

"There’s a better way. New York Mayor Eric Adams told reporters last week that he’s asking the White House to expedite immigrant work visas."

"In Canada and Australia (countries with immigration systems that Donald Trump and his supporters have cited favorably) the national government allows regional and local authorities to act more independently on migrant issues. “Under the Canadian Constitution, for example, immigration is a concurrent power jointly exercised by both the federal and provincial governments,” writes George Mason University law professor Ilya Somin in his 2020 book, “Free to Move: Foot Voting, Migration, and Political Freedom.” “Australia also has a program of state-based visas for workers.”

Even here in the U.S., there have been times when the federal government has tinkered with immigration policy to address regional labor shortages. At the urging of the California and Texas congressional delegations during World War II, the U.S. created the Bracero Program to allow hundreds of thousands of Mexican farm workers to enter the country legally as seasonal laborers. A 1980 Congressional research report concluded that, “without question,” the program was “instrumental in ending the illegal alien problem of the mid-1940s and 1950s.”"

"Tight U.S. labor markets, stemming in part from overly generous pandemic relief efforts that made not working more attractive, have only added to the problem. The upshot is that illegal border crossings continue at a record pace, while Democratic leaders pretend there is no serious immigration problem to address and that anyone who says otherwise is xenophobic."

Tuesday, September 27, 2022

What the Child Poverty Rate Is Missing

The Census Bureau’s tallies still don’t include $1.9 trillion in government transfer payments

By Phil Gramm and John Early. Excerpts:

"The official census numbers are out, and in 2021 the poverty rate among children under 18 was 15.3%. It fell a mere 0.7 percentage point from 16% in 2020 and was still 0.9 point higher than the pre-pandemic low of 14.4% in 2019, even though government spent an extra $2.6 trillion on transfer payments in 2020-21."

"the income numbers used to calculate the official poverty rates don’t count refundable tax credits as income to the recipients. No matter how much money the government pours into any of these tax credits, it will never raise the official income measure given the way the census defines income."

"The Census Bureau fails to count two-thirds of all government transfer payments to households in the income numbers it uses to calculate not only poverty levels but also income inequality and income growth. In addition to not counting refundable tax credits, which are paid by checks from the U.S. Treasury, the official Census Bureau measure doesn’t count food stamps, Medicaid, the Children’s Health Insurance Program, rent subsidies, energy subsidies and health-insurance subsidies under the Affordable Care Act. In total, benefits provided in more than 100 other federal, state and local transfer payments aren’t counted by the Census Bureau as income to the recipients."

"If the Census Bureau had included the missing $1.9 trillion in transfer payments, child poverty would have been only 3.2% in 2017, compared with the official rate of 17.5%."

"This experimental measure [supplemental poverty measure] shows that poverty for children fell by 4.5 percentage points, from 9.7% in 2020 to 5.2% in 2021. This supplemental rate does count refundable tax credits and some other transfer payments not counted by the official measure, but it still fails to count about half of all transfer payments and significantly overstates the amount of child poverty in America."

"the official measure of poverty, which will be the focal point of debate in future years, won’t record any reduction in the child poverty level from the refundable child tax credit."

"Last year, the official census numbers for 2020 failed the laugh test. They showed that household income was down by 2.9% and the poverty rate was up by 1 percentage point in a year when federal transfer payments expanded by 36%. For the first time ever, the Census Bureau included the supplemental estimate in the same release as the official number, showing that income had actually risen by 4% and the poverty rate had fallen from 11.8% to 9.1%. Had it counted all the transfer payments, the poverty rate would have been about 2%."

"In the past 50 years the real value of taxpayer funding for transfer payments to the poorest 20% of American households has risen from an average of $9,677 to $45,389."

"The financial burden of federal transfers rose to more than $4.5 trillion annually in 2021."

"reduced the percentage of work-age adults in the bottom quintile who actually work from 68% in 1967 to 36% in 2017."

The West Mimics Mao, Takes a Green Leap Forward

The green scramble to transform energy is reminiscent of China’s forced industrialization

By Helen Raleigh. She is the author of “Confucius Never Said” and “Backlash: How China’s Aggression Has Backfired.” Excerpts:

"Steel production was a priority of the Great Leap Forward. Mao wanted China to surpass the U.K. in steel output within 15 years. Across the country, including in the village where my father lived, people tried to contribute to this goal by building small backyard furnaces. Each village had a production quota to meet, so everyone—including children and the elderly—pitched in. Using everything they could find to keep the furnaces burning, villagers melted down farming tools and cooking pots. These efforts yielded only pig iron, which had to be decarbonized to make steel. That was a process a backyard furnace couldn’t handle. The effort and resources were wasted.

The steel campaign diverted manpower from farming, even as the government ordered farmers to meet unrealistic quotas. Local party officials initially compelled farmers to experiment with ineffective and sometimes harmful techniques, such as deep plowing and sowing seeds much closer than usual. When these radical methods failed to increase yield and depleted the soil, local leaders had no choice but to lie to their political superiors about how much had been produced (a practice referred to as “launching a Sputnik”). Based on these false production figures, the state demanded villages sell more grain than they could spare. In a vicious circle, the more the local officials lied about their output, the higher the central government set the quotas. Farmers were forced to hand over every bit of grain they had, including the following year’s seeds, to meet the quotas. Resistance was violently suppressed.

The combination of lies, failed experiments, absence of labor and violent requisition practices led to famine. From 1959 through 1961, an estimated 30 million to 40 million Chinese people died from hunger. The Chinese government continues to refer to the famine as a natural disaster, pretending forces beyond their control were to blame for this man-made calamity.

Like Mao, today’s advocates for the green-energy revolution have become impatient with the slow progress made by renewable energy. Fossil fuels and nuclear power provide 80% of the energy the world needs. Despite years of subsidies, renewable energy is still unstable and unreliable, since the sun doesn’t shine at night and the wind doesn’t blow all the time. Almost all renewable-energy power plants require either nuclear or fossil fuels as backups.

Rather than gradually phasing out fossil fuels while investing in renewable energy research and development, Western green-energy revolutionaries have launched their own version of the Great Leap Forward in Europe and the U.S. Today’s greens operate in a democratic system unlike Mao, but they have resorted to government coercion to replace fossil fuels (and nuclear power) with renewables on an aggressive deadline. The European Union is set to cut greenhouse-gas emissions by at least 55% by 2030, and the Biden administration promises to “achieve a 50-52 percent reduction from 2005 levels in economy-wide net greenhouse gas pollution in 2030.”"

Monday, September 26, 2022

Friendly Fire From Biden in the War on Cancer

The Inflation Reduction Act will put a halt to decades of private-sector progress in research and development.

Letter to WSJ.

"Your editorial “Biden’s Cancer Contradiction” (Sept. 15) on Amgen’s new lung-cancer drug, Lumakras, is on target. The Biden administration seeks to boost cancer research and development with its right hand (the cancer “moonshot”), while cutting R&D via the Inflation Reduction Act with its left hand—pun intended.

In a recent study, my co-authors and I found that cancer patients would miss out on 9.5 times as much cancer research due to the Inflation Reduction Act’s price controls as they gain from the cancer-moonshot initiative. Consider the scale: The moonshot comes with a proposed $1.9 billion annual increase in public R&D funding for cancer, about 3% of total cancer R&D. Meanwhile, private cancer research is booming. An astonishing 49% of the total Food and Drug Administration drug pipeline is for cancer, including 27% of new drugs. About two-thirds of drug R&D spending is on these FDA trials, and our analysis found that the price controls will cut it by about $18 billion a year, dwarfing the moonshot.

Our analysis isn’t extreme. We simply took as given the conservative Congressional Budget Office estimates about how much revenue will be cut as a result of price controls, and looked to the consensus scientific literature to determine the implied cut in R&D.

Despite mountains of evidence, some politicians argue that the new price controls won’t cut into medical R&D. For some reason, they think future profits don’t drive investment today. A congressional field trip to a biotech venture-capital firm may be in order. Or simply look at how little private research occurred on Covid natural immunity compared with vaccines, because natural immunity can’t be sold but vaccines can. More science depends on more profits.

Speaking of moonshots, NASA just failed to launch one. It is now inferior to private-sector space aviation. Likewise, the private sector is the heart of medical innovation. Its efforts are more important than those of the National Institutes of Health bureaucracy, which specializes in safe, politically correct research. The Inflation Reduction Act will put a halt to decades of private-sector progress in the war on cancer.

Prof. Tomas J. Philipson

University of Chicago

Covid-19 Unemployment Fraud May Have Topped $45 Billion, Watchdog Estimates

People used Social Security numbers from dead, imprisoned to get money from program meant to help those laid off during pandemic

By David Harrison and Joseph Pisani of The WSJ

"Criminals potentially stole an estimated $45.6 billion by making fraudulent unemployment insurance claims meant for people laid off during the Covid-19 pandemic, a government watchdog said.

The new tally is nearly three times last summer’s estimate of over $16 billion in fraudulent payments.

More than half of the potential fraud identified between March 2020 and April 2022 stemmed from individuals filing for benefits in multiple states. Fraudsters also used the Social Security numbers of people who were dead or in prison, as well as suspicious email addresses, the Labor Department’s inspector general’s office said in a report released Thursday. 

More than 1,000 people have been charged with crimes involving unemployment insurance fraud since March 2020, the report said. 

The inspector general’s office said it didn’t have access to the most current federal prisoner data for its report and focused on other high-risk areas of fraud. 

The pandemic unemployment insurance program, started in March 2020, gave those who lost their jobs an extra $600 a week in federal aid at first, which was later reduced to $300 a week. The supplemental benefit expired last year.

More than $872 billion in pandemic aid has been paid out since March 2020, according to the inspector general’s office.

The hundreds of billions in pandemic funds attracted people seeking to exploit the unemployment program, “resulting in historic levels of fraud and other improper payments,” said Larry Turner, inspector general for the Labor Department, in a statement Thursday.

A spokesman for the Labor Department, when asked for a comment, referred to a letter the agency drafted in response to the investigation. The letter said the agency agreed with the inspector general’s assessment regarding an increase in fraud across the U.S. during the pandemic. The department is also committed to finding new tools and strategies to combat fraud, the letter said.

The report only covered a few specific areas of fraud. The overall amount of fraudulent payments made during the pandemic is likely much higher, said Matt Weidinger, a senior fellow at the right-leaning American Enterprise Institute think tank.

“While these [numbers] are shocking and huge, they fall far short of what we expect these numbers to be,” he said.

Overall, about 19% of unemployment insurance money was misspent during the pandemic, up from around 9% before the pandemic, according to a Government Accountability Office report released in June. Some of that overspending was likely due to people who mistakenly were sent benefits after they had returned to work rather than outright fraud, the report said.

Speaking before Congress in March, Mr. Turner said such a large improper payments rate represents about $163 billion in overpayments “with a significant portion attributable to fraud.”

States across the U.S. began to grapple with unemployment fraud shortly after the pandemic hit in early 2020. Surging unemployment claims—which hit record highs at the onset of Covid-19—was one reason states were more vulnerable to fraud.

Many states also entered the pandemic with antiquated technology that left them underprepared to detect and weed out fraudulent claimants. 

Criminals often use stolen Social Security numbers, birth dates and other personal information to apply for benefits. Fraud led many states to temporarily freeze unemployment payments, at times affecting hundreds of thousands of claims, including legitimate ones for laid-off workers.

Lawmakers on both sides of the aisle said the report should prompt state and federal officials to better prevent fraud in the future.

“I’ve long said we need a national set of technology and security standards for state systems to better prevent this kind of fraud and we’re going to keep working to get our reforms passed,” said Sen. Ron Wyden (D., Ore.), who chairs the Senate Finance Committee.

“The government has an obligation to taxpayers to recover as much of this stolen money as possible,” said Sen. Susan Collins (R., Maine).

In August, Ms. Collins joined with several other Republican senators to introduce legislation to claw back fraudulent payments.

The report on fraud comes as the White House is seeking $22.4 billion in new aid for Covid-19 from Congress. Federal officials have said the funding is critical to help develop and purchase more durable vaccines that prevent transmission and breakthrough infections. Republicans have so far opposed any new spending."

Sunday, September 25, 2022

California’s Tesla Battery Fire

A reminder that solar and wind power aren’t cost or risk free

WSJ editorial

"As if California doesn’t have enough wildfire hazards, its drive to banish fossil fuels from the electric grid is creating another. On Tuesday a Tesla battery at a utility storage site in Monterey County caught fire, triggering the shutdown of the state’s scenic coastal highway and shelter-in-place warnings for local residents.

California utilities have been installing large-scale batteries to back up renewables and provide power when the sun goes down. But now we’re learning that batteries have their own reliability problems. It’s not clear how utility PG&E’s enormous 182.5 megawatt Tesla battery caught fire Tuesday, but the site had to be disconnected from the grid.

The PG&E facility is located adjacent to another 400 megawatt battery storage site, which has experienced two overheating incidents in the past year that forced part of the system to shut down. Lithium-ion battery fires are notoriously hard to extinguish because they burn at extremely high temperatures and produce dangerous fumes.

Hence Tuesday’s warning by Monterey County officials asking residents to “Please shut your windows and turn off your ventilation systems.” Fire drills may need to be modified for battery blazes that are becoming increasingly common and destructive.

Recall how a cargo ship transporting electric vehicles to the U.S. in February caught fire on the open seas. The 22-person crew had to be rescued, and hundreds of millions of dollars of merchandise was lost. A fire last July at a Tesla battery storage site in Australia required three days and a hazmat firefighting team to put out.

Australians were lucky that the fire didn’t occur during their summer when it might have been even harder to control. Californians can likewise be grateful that Tuesday’s battery fire didn’t occur during the state’s heat wave two weeks ago when the state power supply was tight. PG&E filed for bankruptcy in 2019 amid tens of billions of dollars in liabilities for wildfires linked to its equipment, and now it has a new risk to worry about.

The larger point is that there is no free lunch in producing energy. All sources have costs and carry risks. The difference is that while climate lobbyists and the media fret about oil spills, gas leaks and nuclear meltdowns, they ignore the very real costs and risks of renewables."

The Fed’s March Upward

The FOMC raises its terminal target rate forecast again—to 4.6%

WSJ editorial

"The Federal Reserve’s release of its latest economic thinking on Wednesday continued what you might call its gradual climb to meet inflation reality. It has taken far too long, but the central bankers are getting closer to the degree of monetary tightening required to get inflation down.

The Federal Open Market Committee raised its target fed-funds rate another 75 basis points to between 3% and 3.25%. That’s the third 75-point hike in a row. More significant is the forward guidance in its median economic projections that rates could rise another 125 basis points this year and higher than that in 2023. This suggests a so-called terminal rate during this tightening cycle that is higher than 4.5% and could be 5% next year.

While the pace of rate increases has been fast in recent months, the story of the last year is how long it took the Fed to act. The median Fed projection for its target rate for 2022 has climbed from 0.9% last December to 1.9% in March, 3.4% in June and now 4.4%. That march upward reflects the Fed’s historic misjudgment in how high inflation would increase and how persistent it would turn out to be.

One cost of delay will be slower economic growth as the Fed must tighten more than it otherwise would have. The median forecast of board members and bank presidents for economic growth this year is now a mere 0.2%, down from 1.7% in June, 2.8% in March—and 4% last December if you can believe they believed that only nine months ago. The GDP growth forecast for next year is a still meager 1.2%. In short, we’re in for stagflation.

Even this might be optimistic if you consider Milton Friedman’s admonition that monetary policy operates with long and variable lags. This means today’s tightening might not have its greatest impact until the end of 2023 or into 2024. Equity markets voted with the pessimists Wednesday as they sold off late, and bond yields retreated from intraday highs.

Rumors of looming recession are everywhere, but the Fed still has inflation falling rapidly in 2023 and unemployment rising only modestly to a high of 4.4% from 3.7% today. That’s about as soft a landing as anyone could expect. It assumes there are no financial surprises along the way, which there always are as rising rates trip up the over-leveraged.

Chairman Jerome Powell would no doubt count this Fed forecast as a victory if he can pull it off. Given the deep inflationary hole we’re in, and the lack of any pro-growth policies from the Biden Administration or Congress, it’s probably the best we can hope for."

Saturday, September 24, 2022

The More Important US-China Economic Race

By Derek Scissors of AEI.

"A great deal of attention is paid to whether China will catch the US in gross domestic product (GDP). Many observers recently discovered long-term Chinese economic problems and realized China may never catch up. This understates the American advantage. GDP is an activity indicator, while the value of that activity can be captured by national wealth. And the US continues to pull away from China in wealth.

GDP is overused. GDP per capita is a strange, often inaccurate proxy for individual income, which can be measured directly. The global application of purchasing power parity to countries’ GDP, in particular China’s, is fraudulent. GDP itself represents production fairly well but can be inflated by waste, especially in a non-market economy able to subsidize “strategic” industries despite long-term and large-scale overcapacity.

Wasted production doesn’t show up in wealth. Further, wealth can’t be durably inflated. Credit Suisse has for some years compiled net household wealth numbers for many countries. Net household wealth is not the same as net national wealth but the two are strongly correlated for the US and it makes obvious sense for the correlation to hold in most economies.

Credit Suisse this week published end-2021 data. It puts net Chinese household wealth at $85.1 trillion. The American figure is $145.8 trillion. In 2011, the figures were $30.9 trillion and $65.8 trillion, respectively. The US household wealth lead over China has expanded by $25 trillion over the past decade. Ten trillion here, ten trillion there, and pretty soon you’re talking real money.

Qualifiers:

  • China’s wealth as a percentage of America’s has risen. But countries don’t draw on wealth ratios, they draw on the actual money represented in the wealth gap.
  • Despite the pandemic, Credit Suisse has a surprisingly optimistic view of 2020-2021. Chinese wealth rose $15 trillion over those two years, American wealth $31 trillion. Still, the US gain is almost the same as that provided by the Federal Reserve for household net worth.
  • Credit Suisse has understandable difficulties with China, and errs on the optimistic side. The first estimate of 2011 household wealth was $20.2 trillion, apparently a 50 percent mistake. Later years were also revised higher and that could happen to 2021.

The next step is to attempt to translate household into national wealth. The Fed does this for the US, generating a net national wealth figure of $136.2 trillion. It’s considerably harder with China because state-owned enterprises and other government assets are more prominent and by their nature are hard to value. It’s highly likely that the absolute US wealth advantage shrinks when moving beyond households.

But the trend remains in America’s favor, because of debt. The Fed corrects for debt in the US numbers while Credit Suisse does so for Chinese households. What remains is Chinese public sector assets, which are unlikely to grow rapidly in value, as that’s not their purpose. What has grown rapidly, recently, are Chinese public sector obligations. 

The Bank of International Settlements measures outstanding credit, in aggregate and by sector. The aggregates are partly incorporated into net household wealth but reinforce the pro-US trend. In 2011, outstanding credit to non-financial sectors in China stood at 178 percent of GDP. In 2021, the figure was 287 percent. The US equivalents are 253 percent and 281 percent. The US was more leveraged prior to 2011; China has charged “ahead” since.

In particular, Chinese government debt climbed by 39 percentage points of GDP from 2011-2021 while American government debt climbed 27 percentage points. Outstanding credit to the corporate sector rose 36 points in China versus 15 in the US. With these debt results, it is highly unlikely ex-household net wealth alters a widening American lead.

Debt also plays a causal role. The sustainability of wealth creation in both countries is threatened by the debt burden, but the threat is presently greater for China because the debt spike has been sharper. Future leadership in GDP is unclear, at least until the Chinese population starts dramatically shrinking. Durable American leadership in national wealth is assured, and has grown."

A Prosperity Contest: The United States vs. Europe

By Dan Mitchell

"Many people are stunned by the data I shared early last year showing that ordinary people in the United States tend to be much richer than their peers in advanced European nations.

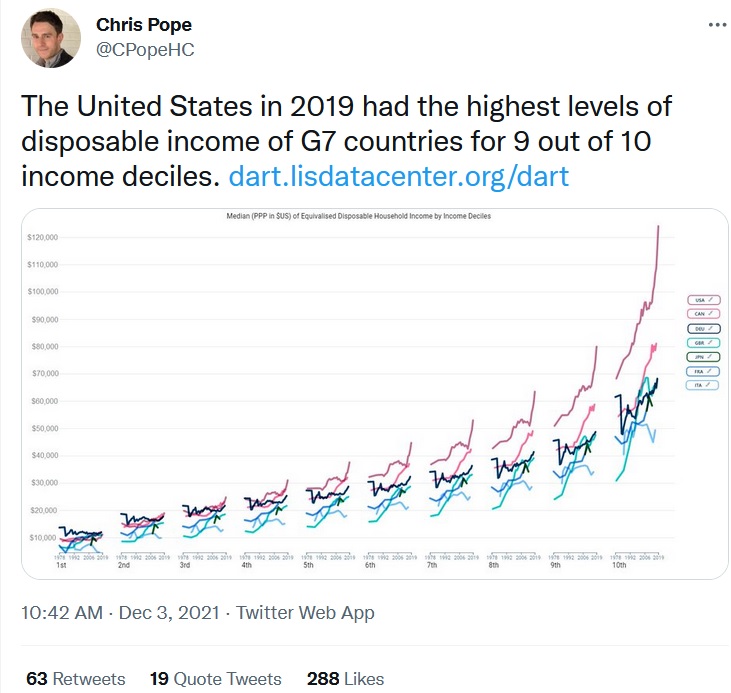
Here’s some more evidence, courtesy of the Manhattan Institute’s Chris Pope.

As you can see, the poorest people in America are about equal to the poorest people in Germany, France, Canada, and the United Kingdom, but Americans are ahead of their peers when looking at the top 90 percent of the population.

For the top 70 percent, Americans are comfortably ahead.

But not everybody agrees.

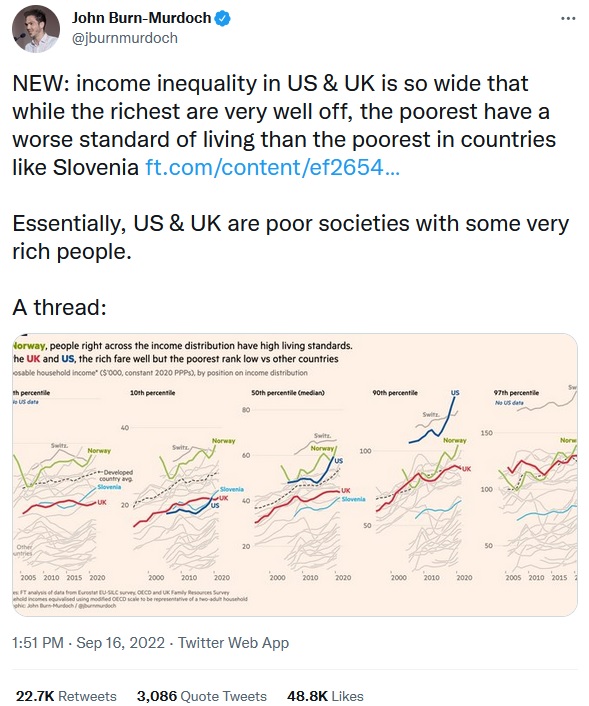
Here’s a tweet from John Burn-Murdoch of the U.K.-based Financial Times. He has a very negative portrayal of the United States (and the United Kingdom).

The tweet from Burn-Murdoch includes a link to an article he wrote.

Here are some excerpts.

…one good way to evaluate which countries are better places to live than others is to ask: is life good for everyone there, or is it only good for rich people? …If you’re a proud Brit or American, you may want to look away now. …Norway is a good place to live, whether you are rich or poor. …The rich in the US are exceptionally rich — the top 10 per cent have the highest top-decile disposable incomes in the world, 50 per cent above their British counterparts. But the bottom decile struggle by with a standard of living that is worse than the poorest in 14 European countries including Slovenia. …transpose Norway’s inequality gradient on to the US, and the poorest decile of Americans would be a further 40 per cent better off while the top decile would remain richer than the top of almost every other country on the planet. …Until those gradients are made less steep, the UK and US will remain poor societies with pockets of rich people.

The United States is a poor society with some very rich people?!?


Is that possibly true?

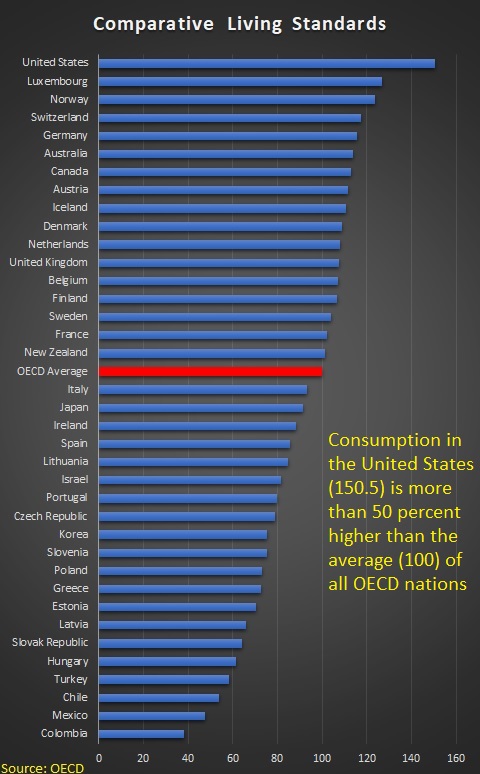
As you might expect, that is utter hogwash. Here’s a chart, based on data from the Paris-based (and left-leaning) Organization for Economic Cooperation and Development.

It shows “actual individual consumption” in the OECD’s member nations, and people in the United States are far better off than people in any other nations.

Indeed, they have 50 percent more consumption than the average person in other OECD countries.

All you need to know is that Burn-Murdoch took some data about America’s poorest people and wants to mislead readers into thinking it also applies to the general population.

And he doesn’t even show his calculations. For what it’s worth, his numbers are not very consistent with some other data sources that are publicly accessible.

Professor Noah Smith also debunks the FT‘s report.

…when we look at how Americans in the middle of the distribution are doing, we see that America is not a “poor society” at all — in fact, it’s one of the richest on Earth. …the median American has a higher income than the median resident of almost any other country… Some people argue that because European countries buy health care for their citizens via the government — which is not counted in disposable income — that it’s not fair to use disposable income as the comparison measure here. But this isn’t right. The U.S. has a relatively low percentage of out-of-pocket health spending — our employers and our government pick up most of the tab. In fact, when we look at “adjusted disposable income”, which includes the value of government services like health care, we find out that the U.S. comes out even more ahead relative to other countries. …someone at around the 18th percentile of income in America in 2019 — a working-class person on the edge of being considered poor — lived in a household making $21,400 a year. That’s about the same as the median income of households in Japan, and about 84% of the median income of households in the UK. In other words, a working-class American on the edge of poverty makes as much as a middle-class person in some rich countries.

I’ll close by noting something else that was misleading in the FT report. Burn-Murdoch compares Norway to the U.S. and U.K., but that nation’s oil wealth makes it very unrepresentative.

Since the report concludes by endorsing more redistribution, it would be more honest and appropriate to compare American living standards to the performance of Europe’s other welfare states.

But Burn-Murdoch did not do that because his already flimsy case would look even weaker.

Also, note that he did not highlight Switzerland. After all, it is richer than Norway, even though it does not enjoy abundant natural resources.

I suspect that’s because Switzerland is a libertarian-oriented nation with a comparatively small welfare state. In other words, it’s a role model for good policy, whereas the reporter seems interested in promoting dirigisme.

P.S. Speaking of libertarians, the Burn-Murcoch story in the Financial Times begins with this passage.

Where would you rather live? A society where the rich are extraordinarily rich and the poor are very poor, or one where the rich are merely very well off but even those on the lowest incomes also enjoy a decent standard of living? For all but the most ardent free-market libertarians, the answer would be the latter.

At the risk of stating the obvious, libertarians want a society with the smallest-possible government. Limiting coercion (the non-aggression principle) is the main motive.

Libertarians will view the resulting distribution of income as just, but they also will point out that freer societies do a much better job of generating broadly shared prosperity than government-dominated societies.

The bottom line is that Burn-Murdoch is either extraordinarily ignorant about libertarianism or he suffers from Nancy MacLean levels of bad faith and dishonesty."

Friday, September 23, 2022

PragerU’s Video “Who Cares about Illegal Immigration?” Has Numerous Problems

By Alex Nowrasteh of Cato.

"PragerU recently released a video by podcaster and influencer Will Witt titled “Who Cares about Illegal Immigration?” PragerU has released immigration videos before that also have serious factual errors that support dubious conclusions, one of which I’ve critiqued. Their newest video is no exception. Below I will block quote a few of Witt’s statements and respond.

Did you know that we are, in effect, adding a new city the size of Philadelphia to our country every year? That’s how many illegal immigrants came into the United States in 2021 and will in 2022.

Border Patrol and the Office of Field Operations have made about 2 million apprehensions of illegal border crossers in 2021 and will do so again in 2022, but apprehensions are not the same as 2 million individuals. In 2021, the government recorded a recidivism rate of 27 percent – meaning that 27 percent of those apprehended were previously returned or removed by the U.S. government and then tried to cross again.

As a Department of Homeland Security report recently stated, “A conceptual limitation of apprehension rate data is that they include information about border apprehensions but exclude information about turn backs (subjects who, after making an unlawful entry into the United States, return to the country from which they entered, not resulting in an apprehension or got away) … In this sense, measures of the apprehension rate understate USBP’s overall enforcement success rate.”

Furthermore, the number of individuals apprehended is not the same as the number of people who gained entry to the United States. Witt should have been clearer on this point.

It’s estimated that Americans spend $200 billion a year to house, feed, school, and care for illegal immigrants.

The $200 billion number comes from flawed research by the Federation for American Immigration Reform (FAIR). I criticized FAIR’s report here. FAIR arrives at their conclusion by counting welfare and education consumed by the U.S.-born children of American citizens who are not illegal immigrants, exaggerating the number of illegal immigrants, oddly counting the cost of immigration enforcement as incurred by the illegal immigrants themselves, exaggerating illegal immigrant welfare use even though they are excluded from virtually all welfare programs, undercounting taxes paid by illegal immigrants, ignoring tax revenue paid by others as a result of illegal immigrant workers being here, and ignoring the extra economic activity generated by illegal immigrants. There is an important discussion to have about the fiscal impact of illegal immigrants, which is likely positive or neutral, but using widely discredited numbers worsens the quality of that debate. We should build a higher wall around the welfare state instead of around the country.

Doesn’t it seem likely that these illegal immigrants would work for almost any wage to make money? Wouldn’t that drive down wages for low‐​skilled American citizens—of every race and ethnicity—with whom they would be competing for jobs? What happens to those citizens, including legal immigrants, if they get priced out of the job market altogether? Is anybody thinking about them?

Immigrants have a small impact on the labor market with a net‐​effect of slightly raising the wages of native‐​born Americans. Most of the wage research on how immigrants affect the wages of natives focused on the relative impact of immigrants on the wages of Americans by education. That research does not show absolute declines in wages with rare exceptions.

Why don’t more workers reduce wages? Immigrants are workers but they are also entrepreneurs who employ workers or at least themselves, the capital markets adjust to new workers by increasing investment in machines and tools that increase worker productivity and wages, immigrants are often complementary to native workers, and they increase demand for goods and services that also boosts labor demand.

Violent crime is increasing across the country at an alarming rate. Under these circumstances, does it make sense to allow two million people a year into the country about whom we know nothing? We don’t know if they have a criminal record, if they’re carrying a disease, or anything else about them.

Crime is increasing, but immigrants are far less likely to commit violent and property crimes than native‐​born Americans. Texas is the only state that tracks criminal convictions and arrests by immigration status. In 2019 in Texas, illegal immigrants were 37.1 percent less likely to be convicted of a crime than native‐​born Americans and legal immigrants were about 57.2 percent less likely to be convicted of a crime than native‐​born Americans. Estimated nationwide incarceration rates for illegal immigrants are similar. Across Texas counties, there is no relationship between all criminal convictions and the illegal immigrant population. The recent increase in homicide arrests in Houston shows that the entire increase is of natives, and illegal immigrants aren’t somehow escaping after committing their crimes. The border is chaotic but crime is not especially heavy there and border walls don’t help. Illegal immigrants likely even litter less. Border security is not an anti‐​crime strategy.

We know the drug cartels control the border on the Mexican side. We know that you can’t cross into America without paying them a sizable bribe. We know that this bribe money adds up to millions, maybe billions of dollars. Doesn’t this mean that we are helping to make the cartels richer and more powerful? What do you think the cartels do with this money? Give it to the Red Cross? Or use it to further corrupt Mexico’s police and government officials, not to mention buy weapons or anything else they want.

This quote doesn’t contain an error but it is very confused. U.S. immigration restrictions are unintentionally enriching criminal smugglers because migrants must pay smugglers to get in. More immigration enforcement leads to more smuggling that raises smuggling prices. The easiest way to defund smugglers and criminal enterprises is to expand legal immigration to channel would‐​be illegal immigrants into a legal market. It’s worked before. The U.S. government could even sell visas, raise revenue, and put the smugglers out of business. In short, our immigration restrictions have created a black market and the solution is to increase legal immigration.

There are other portions of this video that are mistaken on issues of immigrant assimilation, the effectiveness of enforcement, and the ludicrous notion that are borders are open (explain the apprehensions if they’re open), but this blog post is long enough as it is."

The Quantity Theory of Money is underrated

By Tyler Cowen.

"That is the theme of my latest Bloomberg column.  Here is one short bit:

Consider the recent spurt of 8% to 9% inflation in the US. The simple fact is that M2 — one broad measure of the money supply — went up about 40% between February 2020 and February 2022. In the quantity theory approach, that would be reason to expect additional inflation, and of course that is exactly what happened.

The quantity theory has never held exactly, one reason being that the velocity (or rate of turnover) of money can vary as well. Early on in the pandemic, spending on many services was difficult or even dangerous, and so savings skyrocketed. Yet those days did not last, and when the new money supply increase was unleashed on the US economy, there were inflationary consequences.

I do think there are plenty of indeterminacies in macro, but letting M2 rise at such a pace is not one of them!"

Thursday, September 22, 2022

The city without zoning

By Scott Sumner.

"Houston is the only big American city without zoning. Some people argue that Houston is effectively zoned, as many neighborhoods have deed restrictions that limit development. But in his new book on zoning, M. Nolan Gray points out that only 25% of Houston is covered by those contracts, and even in those cases the restrictions are less rigid than with explicit zoning laws.  So how are things playing out in Houston?

For the most part, Houston’s positives are linked to its lack of zoning, and its negatives are essentially unrelated to zoning.  Many people visualize zoning as somehow protecting people from negative externalities.  In fact, regulations against public nuisances have been around long before zoning was first adopted in 1916 (in NYC and Berkeley), and even Houston has many such rules.  Here’s Gray describing Houston:

Pursuant to city regulations, slaughterhouses—an early zoning boogeyman—must remain 3,000 feet from the nearest resident; oil wells cannot be within 400 feet.  Strip clubs and other adult-oriented businesses cannot be within 1,500 feet of a school or church; liquor stores and bars cannot be within 300 feet (Evidently, lust is more offensive than gluttony.)  And the location of billboards is heavily proscribed throughout the city.

So how does Houston benefit from a lack of zoning?  Think about how cities were built before zoning was created.  The densest area (say Manhattan) is in the center, with high-rise office buildings.  A bit further out (say Brooklyn) you have townhouses and big apartment buildings.  Even further out (say Long Island) you have lots of single-family homes.  

After zoning was adopted and then made much more strict over the following decades, this natural growth pattern was artificially halted.  In a free market, central Los Angeles would have many more large apartment and condo buildings. 

Central Houston has evolved more naturally than Los Angeles, as the city has grown into one of America’s largest metro areas (with roughly 7 million people, 2.3 million of which live right in Houston.)  In central Houston, residential lots with one old ranch house are rapidly being converted into three modern townhouses.  Lots of large apartment buildings and condos are also being built on the near west side.  The city is continually being remade, in a style appropriately reflecting its growth into a major city.

In the tweet below, you can see how in just two decades Houston’s permissive permitting rules allowed a residential neighborhood to become much more dense.

You might be thinking, “But I like single family homes with a large lawn.”  In that case, I have good news for you.  In a free market like Houston there are still plenty of such neighborhoods (and far more in the suburbs.)  At the same time, the market is telling us that there are plenty of people who prefer living in dense neighborhoods near the center of major urban areas.  Unfortunately, most zoning plans make such neighborhoods illegal. 

Not all of Los Angeles County should look like Brooklyn.  But LA deserves a Brooklyn-like area close to its major job centers.   

Houston is not as attractive a city as LA (or even Austin.)  It’s hot, humid, flat, prone to flooding, and (AFAIK) has the world’s largest collection of petrochemical facilities.  Yet despite all of those negative characteristics, lots of people move to Houston each year.  (Both affluent and working class migrants.)  That’s partly due to its housing policies, which keep prices reasonable despite the extraordinary growth in population.   

PS.  Houston has had three referenda to allow zoning, and it was rejected all three times.  Gray suggests that this is partly because working class voters tended to oppose zoning, and more affluent neighborhoods were bought off with the promise that private deed restrictions would continue to be enforced.  In American politics, one never achieves anything without compromise."

The Freight Rail Shipping Fair Market Act would increase government interference in freight rail operations

See CEI Leads Coalition Opposing Increased Government Interference in Rail Operations by Iain Murray of CEI.

"CEI and 21 other organizations and individuals have signed a letter opposing the misleadingly named Freight Rail Shipping Fair Market Act, which would increase government interference in freight rail operations.

Much of the bill is aimed at giving the Surface Transportation Board more powers, although it is unclear how the Board can use these powers to achieve the bill’s intended purpose of improving rail operations in emergencies. As the letter states:

As an example, the bill gives the board “emergency powers” aimed at clearing bottlenecks in rail operations. Precisely what the board is supposed to do with these powers is unclear besides being able to “require” such things as additional capacity through building more track. Yet the railroads will still have to go through lengthy permitting processes to do so. In the real world, there is no bureaucratic magic wand that will clear bottlenecks, so involving the board in every such situation is in fact likely to lead to greater inefficiencies and delays (the opposite of the bill’s purported intent).

In all, the bill amounts to reintroducing bureaucracy into rail operations in place of the free market system that has operated successfully since the early 1980s. The level of bureaucratic interference the bill allows will surprise most people. Another example from the letter shows:

The bill also directs the board to increase competition through increased common carrier obligations. Once again, this is likely to involve the board in settling more disputes through micromanaging industry operations, up to and including deciding how many customer service representatives are appropriate. This is, as the saying goes, no way to run a railroad.

Finally, as the letter notes, the Board chairman has repeatedly said that he wants to make sure the Board operates in as depoliticized a manner as possible. Congress inserting itself into the Board’s business this way places a thumb on the scales in a manner that ensures increased political aspects to the Board’s work going forward.

CEI and its coalition partners urge lawmakers to reject this bill."

Wednesday, September 21, 2022

Licensing, and progressively stricter forms of it, is not associated with greater service quality

From Institute for Justice.

"About a quarter of the American workforce must get a permission slip from the government—known as an occupational license—to legally work in their chosen occupations. Getting a license can be costly and time-consuming, requiring fees, exams and many hours—sometimes amounting to several years—of education and experience. Steep licensing requirements serve as a barrier to occupational entry, imposing costs on workers, consumers and the wider economy. But proponents claim they improve service quality by screening out workers likely to provide inferior service. 

This study tests proponents’ claims by comparing consumer Yelp ratings for service providers in neighboring states with different regulatory regimes. For four types of service providers—interior designers, locksmiths, manicurists and tree trimmers—we compare quality in licensed states with that in unlicensed states. For two other types of service providers—barbers and cosmetologists, which are both universally licensed—we compare quality in states with more and less burdensome licenses. In all, across the six occupations, we look at nine sets of state pairings.

We limit our analyses to providers located within a certain narrow distance from either side of state borders, which helps ensure that the primary difference between providers is the regulatory regime under which they operate. This creates an apples-to-apples comparison. 

Our results run counter to the theory that licensing improves service quality. Licensing, and progressively stricter forms of it, is not associated with greater service quality across any of our nine comparisons. In fact, in eight of the nine comparisons, we find no statistically significant difference in quality at all. In the ninth—our comparison of tree trimmers in licensed Maryland and unlicensed Virginia—quality is higher in unlicensed Virginia and statistically significantly so.

These results add to mounting research suggesting the benefits of licensing are overstated and licensing may even be counterproductive. In light of this research and an even larger body of evidence showing licensing’s negative effects, policymakers should be highly skeptical of occupational licensing. To ensure licenses are not needlessly shutting workers out of occupations, policymakers should carefully consider whether proposed and existing licenses are necessary to protect the public and reject or repeal those that are not. They should also ensure requirements for any licenses deemed essential are only as burdensome as necessary to protect the public. To do otherwise is only to raise barriers, not quality."

Why concentration isn’t a good measure of competition

By Alexander Baker. He is Managing Director at Fingleton. Fingleton provides strategic regulatory advice. Excerpts:

"The focus on concentration implies a strong and simple link between the structure of a market and consumer outcomes. In other words, that measures to limit or reduce market concentration will inevitably stimulate competition. However, there are good reasons to believe that the opposite may be true.

First, measuring concentration effectively relies on clearly identifying the boundaries of the markets firms operate in. This is easier said than done.

Take Starbucks, for example: what market is it in? Would you base market shares on coffee income? Or all drinks? What about the cakes, biscuits, salads and sandwiches it sells? If all food and drinks, should fast food outlets — like McDonalds, which sells some of the same products — be included or not? Should supermarkets be included, given they offer such food products (and increasingly coffee) in store?

Making the wrong judgement as to where the boundary of the market falls risks drawing incorrect inferences as to how effectively competition is working: make the boundary too narrow, and you invite intervention where none might be needed; make the boundary too wide, and you risk incorrectly concluding that no action is needed where it might be.

The practical challenge of accurately defining markets is one reason why competition regulators have moved away from rigid, structuralist approaches to competition enforcement over the last decade or so, focusing instead on market outcomes.

Second, concentration tells us less about whether competition is working than is often assumed.

While there is some basis in economic theory to believe that the number of firms in a market tells us something about consumer outcomes, it is more complex in real world markets. For example, a small number of large firms can often serve customers more efficiently than a large number of small ones and consumers in concentrated markets can still be well served where entry is easy.

How many competitors to WD-40 can you name? Does it matter? Are two airlines competing on any given route pair materially worse for consumers than three or four? Don’t people generally consider the market for mobile phone contracts, with four big players, more competitive than energy markets, with six big players?

The judgement as to whether a market works effectively varies depending on factors such as the nature of the product or service, its cost to produce, its value to consumers, and, how easy it is for a new firm to provide that product or service.

Concentration is just one indicator and does not contain all relevant information. It is better to focus attention and policy interventions on the factors which make markets open and competitive, recognising these may vary between markets.

It is notable that many of the markets the SMF focuses on — energy, banking, telecoms — have been subject to numerous recent regulatory analyses which have determined that markets could work better for consumers without relying on simple measures of market structure. The fact that these sectors are highly regulated means we should exercise caution in generalising to other consumer markets, and the fact they have dedicated sector regulators invites questions as to why competition isn’t working more effectively in these markets.

Third, an excessive focus on concentration risks unintended consequences which are equally damaging to consumers. It is a false panacea.

Reducing the question of whether markets function effectively down to a single measure invites false precision, and — where the link between concentration and consumer outcomes is weak — invites policymakers to focus on the wrong thing.

Industry concentration targets risk disincentivising incumbent firms to compete in some markets, because even small changes in market shares could trigger regulatory action (a problem exacerbated by the mechanics of HHI, the SMF’s favoured measure of market concentration). Where entry doesn’t occur, for example because entry barriers are high, a focus on concentration measures could encourage collusion between existing market participants, resulting in higher prices to consumers than would occur otherwise.

Automatic switching of inactive energy and telecoms consumers to ‘challenger companies’ — another SMF proposal — may result in less concentrated markets, but it disempowers consumers and encourages them to rely on government intervention to secure the best deal. It also dulls the incentive for competitor firms to become more efficient in order to win business.

Finally, there are likely to be more effective competition-enhancing policy measures which go with the grain of consumer behaviour."