"I periodically share data showing that America’s long-run fiscal problem is that the burden of federal spending is growing too quickly.
The same thing is true when looking at specific programs. Here’s a chart showing that Social Security outlays are growing rapidly (which helps to explain why the program has a gigantic long-run fiscal problem).
The chart comes from a Washington Post editorial about the program’s shaky finances.
Here are some excerpts, starting with a description of the problem.
The burden of the payroll tax is already enormous. Though the 12.4 percent rate is technically divided in half between employer and employee, workers end up paying the employer’s side of the tax through lower compensation.
…Last year, the Social Security payroll tax raised $1.28 trillion. That’s almost three times what the corporate tax raised. Only the individual income tax raises more federal revenue. …it’s easy to see why the program is broke. The payroll tax rate has been the same since 1990, and revenue as a share of the economy has been roughly flat. The program used to run annual cash-flow surpluses but since 2010 has run deficits — because benefits are rising too quickly.
The editorial then explains why higher payroll taxes are the wrong approach.
According to the latest Congressional Budget Office estimates, the payroll tax rate would need to increase by 40 percent — from 12.4 percent to 17.3 percent — to fund Social Security for the next 75 years. For the median worker in 2025, that would be a tax increase of roughly $3,000. …would the median worker today rather pay $3,000 more in payroll taxes or invest $3,000 in index funds? And why should the government decide that the extra $3,000 is best used for retirement in the first place? Perhaps removing the cap on taxable wages, $184,500 this year, is more appealing since it would affect only high earners. The problem is that doing so would make the top rate on labor income one of the world’s highest while covering only about half of the projected funding gap for Social Security…the payroll tax rate has been raised 20 times already. A 21st hike isn’t going to do the trick.
By the way, that $3,000 tax hike is every year, not a lifetime amount.
And only about 10 percent of Americans would be willing to pay that much to bail out the program.
Here’s another chart from the Post‘s editorial. It shows the amount of taxes needed each year from various income groups to finance existing Social Security promises.
Proponents of bigger government will look at these numbers and argue that higher payroll taxes can solve Social Security’s financing problem.
And if you ignore the potentially damaging impact of higher taxes and more spending, they’re right. At least in terms of math.
But they are overlooking the fact that Social Security has another big problem, which is that it is a lousy way of providing retirement income. Workers pay too much and get too little.
As many countries (including Iceland, Australia, Chile, Switzerland, Hong Kong, Netherlands, the Faroe Islands, Denmark, Israel, and Sweden. have demonstrated, personal accounts based on private savings are much better. More retirement income, more national savings, stronger economic performance, and smaller government.
P.S. Here’s a primer on the five options for dealing with the Social Security mess."
Sunday, September 27, 2026
Tax Increases Are the Wrong Way of Dealing with the Social Security Mess


Saturday, September 26, 2026
Proposed wealth tax risks destroying California’s innovation engine
By David R Henderson and Francois Melese. Excerpts:
"Many wealth tax advocates assume that a founder’s fortune represents wealth unfairly extracted from society. But economic research says the opposite. Nobel laureate William Nordhaus estimated that innovators capture only about 2.2% of the economic value they create. The other 97.8% flows to consumers. In short, a billionaire tech founder’s wealth is only a small slice of the value he or she created for society.
Google illustrates the point. Sergey Brin and Larry Page became extraordinarily wealthy by building one of California’s most valuable companies. Their combined fortunes are over $500 billion. Yet, if Nordhaus’s estimates are even roughly right, the value that Google’s innovations create for consumers is measured not in billions but in trillions of dollars.
Much like AI companies today, Google’s technology was highly disruptive and displaced several categories of work—from print advertising to travel services. Total U.S. newspaper advertising revenue collapsed from nearly $50 billion at its peak in the mid-2000s to under $10 billion by the early 2020s. Meanwhile, as consumers increasingly booked flights and hotels online, jobs for U.S. travel agents tumbled nearly 50%, from around 124,000 in 2000 to roughly 66,000 today.
Happily, as has occurred throughout history with disruptive technologies, these highly visible losses were dwarfed by massive, but less visible gains. Google helped launch and accelerate new industries—from digital advertising and app development to search optimization and cloud services. Google’s platform helped birth a broad ecosystem where businesses can instantly reach suppliers and customers across the globe. Both consumers and businesses benefited as the cost of search and price comparisons fell, shifting bargaining power to buyers and intensifying competition among sellers to produce better products at lower prices.
According to the U.S. Bureau of Labor Statistics, since Google’s founding in 1998 employment in software publishing, internet services, digital marketing, and related information industries has grown by well over a million jobs. Google itself estimates that its Search, Ads, Play, Android, and Cloud ecosystems support more than 2 million U.S. businesses, publishers, developers, and nonprofits.
Brin and Page became billionaires by revolutionizing how billions of people find information, products and services. The fortunes they accumulated are not the result of wealth redistribution; they reflect a series of innovations that increased productivity, expanded consumer choice, reduced transaction costs, contributed to greater competition and more efficient markets, and helped create new markets and employment opportunities across the globe.
This matters for how we think about wealth taxes. Most startups fail. A handful like Google earn outsized returns that compensate investors and founders for those many failures. Meddling with the potential rewards reduces the incentive to take those risks—not just for existing billionaires, but for the next generation of entrepreneurs deciding whether and where to launch a company or pursue risky new technologies."
"But under current law the wealthy already pay a substantial share of the state’s [California] income taxes. The top 1% of taxpayers—around 180,000 filers—pay 40% to 50% of all personal income taxes. The state’s roughly 200+ billionaires alone pay 2-3% of all personal income taxes. They and the tech companies they founded also pay high corporate, capital gains, and payroll taxes."
Thursday, September 24, 2026
Krugman, Stiglitz, et al Flunk Econ 101
"Six winners of the Nobel Prize in economics recently signed a statement in favor of California’s Proposition 40, the measure that would impose a one-time 5 percent tax on California billionaires. They are Daron Acemoglu, Abhijit Banerjee, Peter Diamond, Esther Duflo, Paul Krugman, and Joseph Stiglitz. Their statement showed little understanding of basic economics.
In one section, they write:
Over the 2019-2025 period, the total amount of California income tax paid by billionaires amounted to only 1.6% of their $1.4 trillion wealth gain, much less than what ordinary Californians pay on their paychecks.
There are two problems here. First, they don’t know that billionaires today, the ones who would be paying the tax, got a $1.4 trillion wealth gain. There’s huge mobility in and out of the group of billionaires, especially over a period as long as 6 years. Also, someone might have had a billion in 2019 and have a billion today. That person would be taxed this special 5 percent. What’s his wealth gain? Zero.
Second, it’s a phony comparison because the rest of us “ordinary Californians” don’t see our wealth gain on our paychecks. Our paychecks are for services rendered. Capital gains, whether realized or not, don’t appear. So someone might make $80,000 on his paycheck and have had, over six years, an unrealized capital gain on his house of $200,000. But these economists don’t take account of that. Are they aware that a few million Californians are sitting in houses on which they have had huge capital gains? Or are they just incredibly sloppy or even dishonest?
They also state:
This extreme wealth has translated into extraordinary power, in California just like in the United States more broadly. During the 2000 federal election cycle, billionaires accounted for about 1% of total donations; in 2024 this number had risen to 19%. The Washington Post, the Wall Street Journal, the Los Angeles Times, Instagram, Facebook, TikTok, X are all owned or controlled by prominent billionaires. Sergey Brin alone has already spent more than $100 million to defeat the California billionaire tax.
But there were many fewer billionaires in 2000, for two reasons. First, even inflation-adjusted, there are way more billionaires just as there are way more millionaires. Second, inflation alone has led to more billionaires. One billion in 2024 would be, in 2000 dollars, $549 million.
Moreover, are these economists aware of why Sergey Brin spent more than $100 million to defeat Proposition 40? It’s because it’s on the ballot. If they wanted him not to make political contributions, there was a way to do it: persuade their allies not to put Proposition 40 on the ballot. These economists don’t just flunk Econ 101; they also flunk Irony 101.
The Nobelists also state:
California’s 250 billionaires are collectively worth $2.3 trillion. Their wealth now amounts to the entire annual income of all California taxpayers — some 20 million of them.
But billionaires’ net worth is their wealth, the value of all their assets, and it’s a stock. The annual income of all California taxpayers is a flow. Economists are not worth their pay, a flow, and might even not be worth their wealth, a stock, if they fail to distinguish between stocks and flows.
In his speech at the Nobel banquet of 1974, Friedrich Hayek stated:
There is no reason why a man who has made a distinctive contribution to economic science should be omnicompetent on all problems of society – as the press tends to treat him till in the end he may himself be persuaded to believe.
I’m sure he would extend his generalization to women too, so Esther Duflo isn’t let off the hook.
Actually, though, the six economists’ statement is even worse than what Hayek feared. He worried that Nobelists would pontificate “on all problems of society.” But these Nobelists get even some basics of economics wrong."
Wednesday, September 23, 2026
Matthew Lilley: A bunch of Nobel Prize-winning economists have endorsed California's proposed billionaire wealth tax. I can't oppose them on authority. But I know some academics who can.
He is a lecturer at The Australian National University. This is his This is his Twitter thread.
"Acemoglu (2001) v. Acemoglu (2026)
Colonial Origins: "Protection against expropriation risk is extremely important for long-run prosperity."
Also: "Anyway, here's a 5% levy on the existing property of one narrowly defined group."
It's a one-off. I pinky promise.
Apparently the lesson of Colonial Origins was credible property rights are important until the property crosses ten figures.The coefficient on expropriation risk: enormous.The coef when the taxpayer owns Nvidia stock: Appendix B, VibesDiamond (1971) v. Diamond (2026)
Diamond–Mirrlees: Preserve production efficiency. Don't distort productive choices when other tax instruments exist.
Prop 40: tax the assets of people who own lots of productive capital?
Professor Production Efficiency: "Sounds good."Banerjee & Duflo (2007) v. Banerjee & Duflo (2026)
The credibility revolution: Stop waving your hands about giant ideological questions. Find something you can identify. Run the experiment. Measure what happened.
And therefore, naturally: California should impose a 5% wealth tax.
The causal chain:
1. Randomize remedial tutors in Mumbai and Vadodara.
2. Observe a 0.28σ rise in test scores.
3. ???
4. Tax Jensen Huang's equity.
Thousands of economist-hours teaching the profession to decompose huge policy questions into narrow ones with credible identification.
Then the ballot proposition arrives:
"No RCT necessary for this one, lads. Pre vs post comparisons in an AI boom are fine."
Krugman (1991) v. Krugman (2026)
New Economic Geography: Firms, workers and capital respond to incentives in deciding where to locate; those choices can shift equilibria.
Location is endogenous. Agglomerations aren't laws of nature.
But then for California:
"Yes, location incentives exist. Yes, mobile capital exists. Yes, equilibria can shift. But Silicon Valley will obviously be fine."
Location is endogenous, but apparently not that endogenous.
Truly, the most robust result in modern economics is that, as ideology grows large, every theorem acquires a people-who-are-richer-than-me exception.
(If you don't like the jokes, don't blame me, blame my co-author GPT. He did all the work)."
Saturday, September 19, 2026
A 5 Percent Wealth Tax Would Destroy a Lot More Than It Raises
By Jack Salmon. Excerpts:
"the billions of dollars in wealth held by the almost 1,000 billionaires in the U.S. isn’t cash that is being hoarded under a mattress waiting to be taxed. For instance, Elon Musk’s roughly $900 billion fortune is mostly stock held in SpaceX and Tesla."
"Musk’s personal fortune represents only about one-third of the combined value of the companies he has founded."
"The remaining two-thirds is represented by factories, equipment, intellectual property, business assets, and claims held by other shareholders, including pension funds, mutual funds, and ordinary Americans who own shares directly or indirectly. The companies also employ tens of thousands of workers whose wages support household incomes and consumption.
For other billionaires, the share of wealth kept for themselves versus the share granted as value created for wider society is even larger than that of Musk. Mark Zuckerberg’s personal fortune represents about 13 percent of the market value of Meta. The other 87 percent is owned by shareholders, ordinary investors, or represented as data centers, servers, other productive assets, and nearly 79,000 employees.
In other words, the wealth of billionaires is a small share of the trillions of dollars in private wealth that they have created for millions of ordinary American’s. The free enterprise system rewards this kind of entrepreneurial activity and innovative behavior that in turn promotes productivity and growth. Removing these rewards by confiscating their personal assets and handing them over to the state would instead punish such activity.
A 5 percent wealth tax is a 99 percent income tax
The second thing to recognize is that the proposed 5 percent tax on wealth is a much larger tax on the returns of investments.
But we also have to account for the invisible tax that we all pay—inflation. Once inflation is factored in, market returns drop to 5.48 percent. At that level, the wealth tax is a 91 percent tax on investment returns. If we also assume that capital gains taxes are applied to dividends, then the after-tax return drops to just 5.05 percent. In this case, the wealth tax is effectively a 99 percent tax on investment income.
A 99 percent tax on investment income will have a significant impact on the incentives of investors. One of the incentives that will undoubtedly change is that people will take less risks. Low risk investments have lower rewards, and this will be felt by everyone, not just the billionaires that the policy targets.
Slower capital formation, weaker productivity, lower wages and fewer opportunities for workers and businesses affect all workers and consumers, not just wealthy ones.
We already have a wealth tax of sorts
As Stanford economist John Cochrane recently pointed out on his Substack, the U.S. already taxes wealth in certain circumstances. For example, the estate tax applies to the assets of the deceased when it is passed onto an heir.
Importantly, I should point out that a tax on the transfer of property is very different to a tax recurring tax on property ownership. The Supreme Court has also made a strong distinction between these types of taxes too, as it considers the estate tax an indirect excise tax on the transfer of property.
As Cochrane points out, the estate tax attracts a significant amount of perfectly legal avoidance. Although the tax applies at a much lower threshold than the proposed wealth tax, at $13.99 million, the Treasury estimates, that combined with gift tax receipts, the estate tax raised $29 billion in revenue in FY2025, or less than 0.1 percent of GDP.
Even a study published by supporters of a wealth tax found that the estate tax collects just 300-to-400ths of a percent annually of the Forbes 400 wealth.
The revenue gain is about $200 billion a year
So how much revenue do proponents of a wealth tax suggest it would raise if implemented in the U.S.?
French economists Emmanuel Saez and Gabriel Zucman estimate that a 5 percent wealth tax will raise $4.4 trillion over 10 years. To get this figure, they assume a tax evasion rate of 10 percent. This implies an elasticity of taxable wealth around -2. This assumption is significantly out-of-whack with the bulk of economic literature.
Evidence of savings effects based on Norwegian micro data estimate elasticities of taxable wealth around -7 under a comprehensive tax base. Similarly, evidence from Switzerland using cantonal variation finds that a one-percentage-point reduction in the wealth-tax rate increased reported taxable wealth by at least 43 percent after six years.
One 2021 journal article used rich administrative data from Colombia and a government-designed program for voluntary disclosures of hidden wealth to estimate the behavioral effects of wealth tax. The authors found that two-fifths (40%) of the wealthiest 0.01 percent evade taxes, with these evaders concealing one-third of their wealth offshore.
Using Danish administrative data, Jakobsen et al. find that reductions in the wealth tax increased taxable wealth by 31 percent among the very wealthy over eight years. Their estimates incorporate saving, portfolio and asset-composition responses, legal avoidance, and possible evasion of self-reported assets. The net-of-tax rate elasticity is therefore estimated at around -11.
With these estimates in mind, budget scoring organizations often use more realistic elasticity estimates that are more aligned with the economic literature. For example, the Tax Foundation models wealth tax proposals using a semi-elasticity assumption of -8, while Penn Wharton applies semi-elasticities of evasion and avoidance around -9.
If we replace the elasticity assumptions of Saez and Zucman with a more realistic semi-elasticity of around -8, then the revenue raised by the tax drops from $4.4 trillion to $3.3 trillion over 10 years. This isn’t an outlier assumption. In fact, Sanders and Warren used a 33% avoidance assumption in their 2020 wealth tax campaigns.
Factoring in baseline avoidance in the existing tax system and stronger behavioral responses, tax scholar Kyle Pomerleau applies an elasticity of -13. This results in a 10-year revenue yield of $2.3 trillion, or roughly half the Saez-Zucman figure. This amounts to a little over $200 billion a year in additional revenues, or about 10 percent of current deficits.
A high price for the U.S. economy
A 5 percent wealth tax isn’t just a tax on billionaires, it is a tax on investment, a tax on risk-taking, a tax on capital accumulation that drives productivity, higher wages, and job growth. The people who ultimately bear those costs would include workers, consumers, retirees, and the millions of ordinary Americans whose savings are invested in the companies billionaires helped build.
Wealth is not cash sitting idle in a bank account. It is the factories, companies, technologies, and investments that generate future income for millions of people. Taxing wealth at punitive rates may satisfy a desire to punish the rich, but it risks shrinking the very economic base from which future prosperity will come.
Let’s not tax away our productivity, innovation, and growth for the sake of political symbolism."
Tuesday, September 15, 2026
The Tax Gains from Moving Across State Lines
Comparative tax burden · Tax year 2026
By Daniel Di Martino of The Manhattan Institute.
"Americans have been moving from high-tax states to low-tax states for a long time, but the trend has become more acute since the Covid-19 pandemic hit the world in 2020. The increasing availability of remote work allowed many workers to move elsewhere and keep their jobs, and many companies also chose to relocate or reduce office occupancy. In addition, Americans are increasingly self-sorting according to political preferences. Most coverage of this trend has focused on the rich and how much they have to gain by moving from high-tax to no-income-tax states. Obviously, multimillionaires can keep more of their income if they move from a high-tax jurisdiction like New York City to Palm Beach, where there is no state or local income tax. My new income tax tool shows that not only the rich, but also low- and middle-income Americans, have a lot to gain from moving across state lines.
Take a couple earning $120,000 in New York City. The husband has a decent job paying $100,000, and his wife makes $20,000 working part-time. They have two children still in school. That couple does not benefit from itemizing deductions in their federal tax return, so they take the standard deduction and owe $10,040 in federal income taxes. Since they have two minor children, they will receive a $4,400 child tax credit to offset their tax liability.
Since they both have traditional jobs, their employers will owe $9,180 in Social Security and Medicare payroll taxes, while they will pay the same amount from their salary in payroll taxes, out of an effective compensation cost to their employers of $129,180. Since they live in New York State, they owe $5,186 in state income tax and $581 in payroll taxes for paid family and disability leave (both spouses contribute), but they also benefit from an $800 state child tax credit. Finally, since they live in New York City, they will pay an additional $3,727 in city local income tax.
All in all, out of a compensation cost of $129,180, the couple pays $32,693 in income and payroll taxes, or 25.3% of their income, leaving them with a take-home pay of $96,487. This couple faces an effective 36.3% marginal tax rate.
Would this couple be better off if they moved from New York City’s metropolitan area to the Nashville metropolitan area? Imagine the cost of this move is that the wife loses her $20,000 job and thus their income falls. This is a big hit, but they would pay no state and local taxes, and their federal income tax would also be much lower due to the progressive tax structure. Their federal income tax would be, net of the child tax credit, just $3,240, while their payroll tax liability would fall proportionally. Out of a new employer compensation of $107,650, this couple would pay a total of $18,540 in payroll and income taxes, for a take-home pay of $89,110. But every dollar goes much farther in Nashville than in New York City, as housing and everyday goods and services are cheaper—specifically, 14.48% cheaper. While New York City is 12.6% more expensive than the average U.S. territory, Nashville is 3.7% cheaper. Thus a take-home pay of $96,487 in New York City is equivalent to $85,690, while one of $89,110 in Nashville is equivalent to $92,534. In other words, even with a $20,000 lower nominal income, a married couple with two kids can still increase their real take-home pay by nearly 8% by moving across state lines. If they managed to keep their full income, or the wife later found another job, their real income would actually increase to $109,221—over $23,000 in additional real income, a 27% increase.
Now take the case of a middle-income single worker in Los Angeles, making $60,000 per year. His take-home pay would be $47,961. Say he lives in the Los Angeles metropolitan area, so his price-adjusted take-home pay is lower, at $42,219. If he moves to Orlando in Florida, his take-home pay will rise to $50,390, and adjusted for cost of living it would be $49,694. In other words, his after-tax pay rises by $2,429 per year, or over $200 per month, and his price-adjusted after-tax pay rises by $7,475, or over $600 per month—a nearly 18% increase.
While tax and cost-of-living gains are increasing with income, even the lowest-income earners in the United States can see increases of over 10% by moving across state lines, while the richest can see gains of over 30%."
Wednesday, September 2, 2026
Reflections on Americans’ Net Worth
By Bryan Caplan. Excerpt:
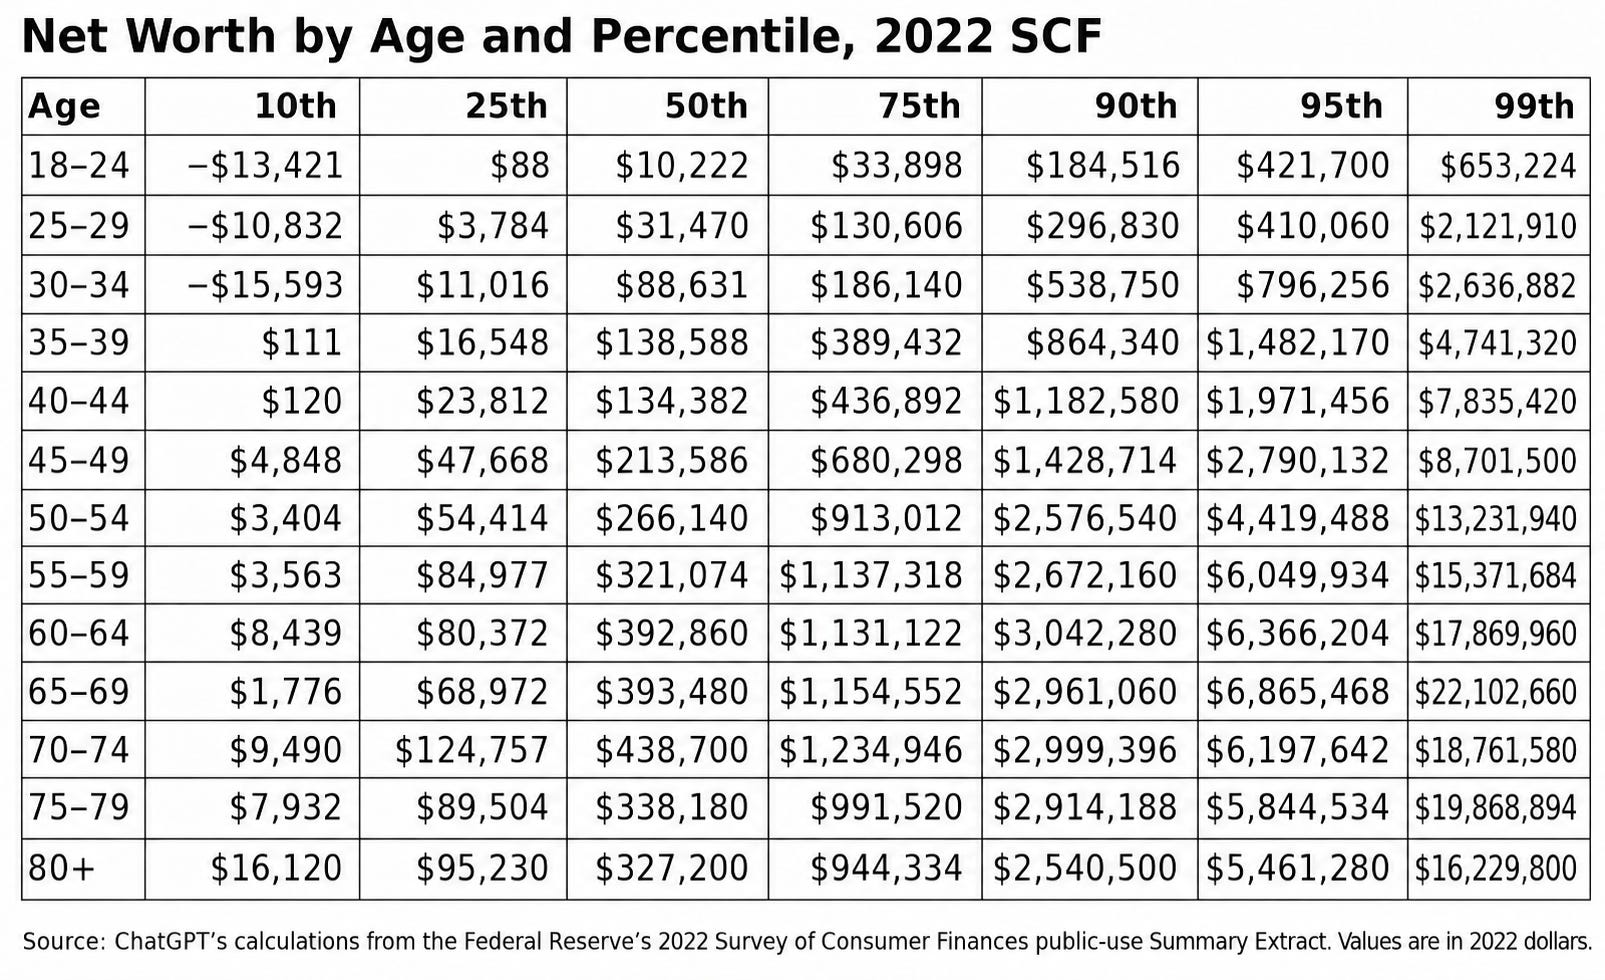
"I’ve been an economics professor for almost 30 years, but I don’t think I’ve ever before seen anything like the table below. I knew that claims that “58% of Americans can’t afford a $1,000 car repair” were laughable clickbait. I knew that — measured by income — the middle class is disappearing… by becoming upper-middle class. But only recently did I start to fully appreciate the chasm between populist pessimism and actual data on Americans’ net worth. From the 2022 Survey of Consumer Finances:
"Main reflections:
Economists have long known that inequality is relatively low for consumption, medium for income, and high for wealth. What they rarely emphasize, however, is how much wealth depends on age. The richest Americans aged 65-69 are worth about 30x as much as the richest Americans aged 18-24.
Net worth is very high in absolute terms. The median is over six figures by the mid-30s. Americans at the 75th percentile are millionaires by their mid-50s. Americans at the 90th percentile are millionaires by around 40. Claims about middle-class, middle-aged Americans who “can’t afford” eggs or gas or beef are nonsense.
The most sensible argument for worrying about trade deficits is that we’re “living beyond our means.” Trade deficits represent borrowing, and we can’t keep borrowing forever. But given Americans’ extraordinary net worth, the most sensible argument for worrying is still senseless. After 50 years of unbroken trade deficits, we’re wealthier than ever."

Monday, August 31, 2026
Most European Countries that Had Wealth Taxes Have Repealed Them
By David R Henderson. Excerpts:
"According to the OECD, 12 OECD countries had individual net wealth taxes in 1990, and all 12 were European countries. By 2017, only four OECD countries still had them"
"the likely reason is that they were losing some of their wealthiest residents to other countries that didn’t impose taxes on wealth."
Tuesday, August 25, 2026
Taxing the Rich Can’t Close the Federal Deficit
"It’s not just the Democratic Socialists who believe in “taxing the hell out of millionaires.” The belief that Washington can finance itself by taxing a relatively small group of wealthy Americans has become increasingly mainstream and bipartisan.
Senators Elizabeth Warren (D‑MA) and Bernie Moreno (R‑OH) propose removing the Social Security payroll tax cap, subjecting earnings above $184,500 to the 12.4 percent combined employer-employee payroll tax. Senators Chris Van Hollen (D‑MD) and Cory Booker (D‑NJ) each propose exempting more wages from income taxes at the bottom while raising taxes on higher earners. President Trump has pursued a similar strategy of expanding tax exemptions, while President Joe Biden and Vice President Kamala Harris both pledged not to raise taxes on anyone earning less than $400,000.
Each approach shifts more of the tax burden toward the top. One problem with this approach is that there are not enough high-income Americans to finance the current federal budget deficit, let alone fund additional spending or tax cuts.
One simple way to illustrate the mathematical impossibility of raising taxes only on rich people is to ask an intentionally extreme question: How much income is actually left to tax at the top? Not as much as popular proposals usually assume.
Using IRS data, the post below shows an upper bound for income-tax increases on high earners. In 2023, if the government had confiscated every dollar earned over half a million dollars, it still would have run a budget deficit.What’s left to tax?
Using IRS data from the 2023 tax year (the most recent available), we can illustrate the difficulty of raising a lot more revenue from a narrow segment of the population.
In 2023, taxpayers filed 161 million individual income tax returns, reporting $15.3 trillion in adjusted gross income (AGI). AGI includes wages, capital gains, personal business income, and other forms of income, minus adjustments for things like student loan interest and retirement contributions.
The IRS reports this information by different income groups, separating taxpayers into buckets with AGIs above and below $200,000, $500,000, $1 million, and $10 million, among others. Table 1 shows the total AGI and income taxes paid, including federal taxes and an estimate of state-level taxes, by each group.

In 2023, taxpayers earning over $1 million reported $2.5 trillion in total AGI and paid $747 billion in federal and state income taxes. To estimate state income taxes, we apply average rates by income group from the Institute on Taxation and Economic Policy. The 799,094 tax returns in the $1 million+ group accounted for 0.5 percent of all returns and paid an average federal and state income tax rate of 29.5 percent.
In theory, Congress could devise a way to reach every dollar of untaxed millionaire income. But most proposals to raise taxes on high earners instead start by increasing marginal tax rates. Under a graduated income tax, a higher rate imposed above $1 million applies only to income exceeding that threshold, which exempts the taxpayer’s first $1 million from additional taxes.
The IRS data show that for the $1‑million-and-above group, there is $1.7 trillion in AGI above the threshold. Applying the group’s average tax rate implies they have already paid roughly $512 billion in taxes on their above-threshold income. That leaves $1.2 trillion after taxes.
If Congress confiscated every one of the remaining $1.2 trillion after-tax dollars earned above $1 million, the resulting revenue would have fallen nearly $600 billion short of covering the cost of the 2023 $1.8 trillion calendar-year deficit. Dropping the taxable income threshold to $500,000 would also have fallen just short of covering the same year’s deficit. And these estimates make the wildly unrealistic assumption that a 100 percent marginal tax rate would have no behavioral or other economic effects.
Figure 1 extends the improbable assumption over 10 years, assuming that high-income Americans would continue to earn income when facing 100 percent income tax rates. It adjusts the 2023 data by projected income and household growth to show untaxed income over the next 10 years. Confiscating all income earned over $1 million would cover only about 80 percent of the Congressional Budget Office’s (CBO) projected $24.4 trillion federal deficit over the same period.

The Committee for a Responsible Federal Budget produces a more realistic projection of future deficits that assumes Congress extends many expiring tax and spending programs (which the CBO is required to assume are not renewed). At the more likely deficit figure of $29.4 trillion, even lowering the income threshold to $500,000 does not cover the next decade’s budget shortfall.
Lowering the taxable income threshold further to $200,000 expands the pool of untaxed income, but it does not make confiscatory tax rates economically plausible.
Common sense and economic incentives make clear that Congress cannot raise marginal income tax rates anywhere close to 100 percent and expect taxpayers to continue earning and reporting the same income. A recent report by economists at the Joint Committee on Taxation estimates that combined state and federal income tax rates are already near their revenue-maximizing level. Raising top income tax rates further would result in revenue gains of about 0.1 percent of GDP, equivalent to at most $400 billion over the next decade.
Conclusion
Taxing incomes at 100 percent marginal rates is not a realistic policy proposal. Taxes significantly higher than what we have today would radically change how much people work, invest, and realize as income, as well as how much income they report to the government. The point of this exercise is to show that “just tax the rich” proposals fail, even under arithmetic that is the most favorable possible."
Sunday, August 23, 2026
Wealth Tax 2.0
By John H. Cochrane. Excerpts:
"If you invest an extra dollar today, how much extra do you get in a year? A 5% wealth tax drags down the rate of return by 5 percentage points. If you earn 10% on your investments, but then pay a 5% wealth tax, you only get a 5% after-tax rate of return. Starting from a 10% return, a 5% wealth tax is the same as a 50% tax on interest, dividends, and capital gains."
"The wealth tax applies on top of corporate taxes, property taxes, and taxes on dividends, interest, and capital gains. Inflation acts as another wealth tax, running 3% a year now. My guesstimate is that the government takes all the return and more."
"Should they (billionaires) bet the farm on a new venture, investing time and effort as well as their money? Should young Elon Musk take his $175 million PayPal payout and retire on it, or plow it all into electric cars and rockets? We often think of saving vs. consumption here, but I think we underestimate the disincentive to take risk and invest effort that comes from progressive taxation. If the government taxes away the upside to investing, people take less risk."
"Billionaires do not have a pot of gold that can be costlessly handed out. Billionaires’ wealth stays re-invested in companies. Redirecting their wealth to social spending lowers national investment and raises national consumption, dollar for dollar. That’s not even hidden; it’s the point. But less investment mechanically means less capital for the future, fewer businesses, less productivity, lower wages."
"less investment also drives up interest rates as people with profitable ventures look for investors. Companies could finance investment with foreign money, but that raises the trade deficit"
"Structuring businesses to avoid taxes rather than generate profit might be the most insidious effect of high taxation."
"We have a wealth tax, the estate tax. It tries to charge 40% of wealth once in a generation, or about 1% a year. (You pay double if you pass it to grandkids, so really about once every 30 years.) The estate tax attracts a beehive of perfectly legal avoidance. (Avoidance, not evasion. “Tough enforcement” and audits do nothing here.) Though the estate tax applies above a lowly $11 million, the CBO reports that it yields only $18 billion, or 0.1 percent of GDP. A recent study—by wealth tax backers—reports that the estate tax collects only three to four hundredths of a percent (0.03%–0.04%) annually of the Forbes 400 wealth, not 1% or so."
[the bill] includes “a $3,000 direct payment to every man, woman and child living in a household making $150,000 or less.” $1.1 trillion for Medicaid and Obamacare subsidies. Free dental, vision and hearing. $856 billion of government-provided homes to “abolish homelessness.” A childcare entitlement. A minimum salary for teachers. And so on. This is proudly a bill to turn investment into consumption."
"Free market wealth did not install Putin, nor did it create US crony capitalism under the regulatory state."
"What’s the right question? There is only one question — long run growth. Redistributing Rockefeller’s wealth would not have made your family better off. We’re all immensely better off because of long-run growth. Even if your concern is entirely at the lower end of the economic spectrum, long-run growth is the question. Ask of any policy, what does this do to long-run growth? For the wealth tax, not much!"
Saturday, August 22, 2026
Did UBI make people happier? (only in the short run)
"Eh, only in the short run:
We study the causal impacts of income on a rich array of employment outcomes, leveraging an experiment in which 1,000 low-income individuals were randomized into receiving $1,000 per month unconditionally for three years, with a control group of 2,000 participants receiving $50/month. We gather detailed survey data, administrative records, and data from a mobile phone app. The transfer caused total individual income excluding the transfers to fall by about $1,900/year relative to the control group and a 4.2 percentage point decrease in labor market participation. Participants reduced their work hours as a result of the transfers by 1-2 hours/week and participants’ partners reduced their work hours by a comparable amount. Among other categories of time use, the greatest increase generated by the transfer was in time spent on leisure. Despite asking detailed questions about amenities, we find no impact on quality of employment, and our confidence intervals can rule out even small improvements. Treated participants broadly increase expenditures, led by spending on non-durable goods and services, with smaller increases in spending on durable goods and human capital. We observe no significant effects on degree attainment, though the magnitudes of the estimated effects generally appear larger among younger participants. Measures of subjective well-being are higher among treated participants in the first year of the transfers but then revert to control group levels. Overall, our results suggest a moderate labor supply effect that does not appear offset by other productive activities.
That is from the QJE by Eva Vivalt, Elizabeth Rhodes, Alexander Bartik, David Broockman, Patrick Krause, and Sarah Miller. Via Matt Yglesias."
Thursday, August 20, 2026
A Reality Check on the Inequality Panic
Calls for wealth redistribution rest on a faulty premise about inequality
"Summary: Widespread claims of rapidly worsening global inequality are unsupported by the evidence. Long-term data show significant declines in inequality across income, health, education, and other important metrics, largely driven by rising prosperity in poorer countries. Popular policy proposals to address inequality, such as wealth taxes and expanded foreign aid, are misguided and dangerous. Policies that sustain economic growth and market stability are better guarantors of progress.
Anthropic CEO Dario Amodei called for far higher taxation in a recent blog entry, arguing that current wealth concentration is higher than that of the Gilded Age and is about to get worse globally. The chart-topping singer Billie Eilish implored billionaires to give away their money, while New York City mayor Zohran Mamdani has gone further, opining, “I don’t think we should have billionaires” because we live in “a moment of such inequality.” If anything is having a moment, it is the conviction that inequality has grown urgent enough to justify a muscular policy response.
But the facts don’t support this. Not only has global income inequality fallen over the long run — contrary to the popular narrative — but inequality has also declined in education, health, and a host of other areas. The world is now more equal across a range of factors, from lifespan and childhood survival to internet access and schooling. The more broadly one examines inequality, the more encouraging the data appear. It turns out that even the shock of COVID-19 failed to erase decades of progress toward a wealthier and more equal world.
Indeed, the data show a pronounced decline in global inequality over the past few decades, driven largely by rising prosperity in poorer countries. During the pandemic years of 2020 and 2021, progress slowed sharply. Some indicators stalled and a few modestly worsened. But the gains accumulated before the crisis were not undone.
In short, the damage to human well-being was more limited than many feared.
Another recent analysis published in The Economist finds that global inequality in consumption spending is falling. In 2000, the richest 10% of humanity spent 40 times more than the poorest 50%. In 2025, they spent around 18 times more. Using data from World Data Lab, they find that the poorest 50% now out-consume the richest 1%, breaking from past trends.
Yet many think that only large-scale redistribution can stop runaway worldwide inequality. Figures as diverse as Amodei, Eilish, and Mamdani are far from alone in embracing this view. Over the past few years, calls for a worldwide wealth tax, a vast increase in foreign aid spending, and other unprecedented measures are gaining steam across academia, non-profits, the press, and international organizations like the United Nations.
That conclusion is premature. Getting the facts straight is essential, because misunderstanding global inequality can push policymakers toward harmful solutions.
The record on foreign aid is far less encouraging than its advocates suggest: decades of evidence show that aid frequently fails to deliver sustained development and bears no reliable relationship to long-term economic growth. Worse, the fixation on ever larger aid flows often crowds out the harder work of domestic reform. In some cases, foreign aid has been shown to weaken political institutions, entrench bad governance, and slow the process of democratization.
Wealth taxes have their own problems, from high administrative costs and enforcement challenges to low revenue production and invasion of financial privacy. These problems help explain why so many of the countries that have implemented wealth taxes in the past — such as France, Germany, and Sweden— later abolished the tax. Perhaps the worst of all, by discouraging risk-taking, wealth taxes suppress investment and growth, effects that would be felt in both rich and poor countries and would likely prove especially damaging to development in the world’s poorest economies.
Recent work on multidimensional inequality suggests that the world has not been drifting toward ever greater gaps, but that the rich and the poor have been converging in material comfort. Calls for global wealth taxes or massive new aid programs often rest on the assumption that international trade and economic freedom have failed to deliver broadly shared gains. Yet the long-term evidence suggests the opposite.
The pandemic offers two lessons here: First, it highlights just how sensitive progress is to disruptions in markets. It depends on conditions that allow growth to occur and persist, including functioning markets and stable institutions. Many of the proposed policy solutions risk undermining that progress.
The second lesson is that while the pandemic represented a hurdle in the path of progress, the long-term trend toward lower global inequality is holding strong.
Alarmist narratives shape public opinion and encourage policymakers to pursue sweeping interventions that may do more harm than good. A clearer view of the data counsels caution rather than panic."
Monday, August 17, 2026
Who Will Pay for Democratic Socialism’s $200 Trillion Cost?
"The Democratic Socialists of America (DSA) propose new spending that could more than triple federal outlays. They propose the government pay for health care, housing, higher education, and electricity. Jobs are government-guaranteed, retirement benefits are expanded, paid family leave is universal, fossil fuels are eliminated, and reparations are paid.
The DSA platform claims that the bill for all this will be sent to “the richest individuals and corporations.” Tally up that bill, and it ballparks between $71 trillion and $212 trillion in new spending over the next decade. Confiscating every dollar of high-end wealth and corporate profits would cover only a fraction of those costs. The DSA agenda necessitates high taxes on middle-class Americans.
$200 Trillion in New SpendingTotaling up nine of the largest proposals in the DSA platform would mean new federal spending equivalent to between 18 percent and 53 percent of GDP.
Table 1 reports various low-end and high-end estimates of proposals for programs that approximate the DSA’s vague descriptions. Each proposal’s original spending estimate is converted to a share of GDP and then applied to the 2027–2036 projected GDP, so all estimates are in current dollars.

Medicare-for-All-style proposals for universal healthcare would increase federal spending by $40 trillion to $75 trillion over 10 years. Reparations, a federal jobs guarantee, infrastructure, green energy investment, larger retirement benefits, free housing, paid family leave, and no-cost college would increase spending by tens of trillions of dollars more. In total, the DSA’s new spending would cost between $71 trillion and $212 trillion over the next decade.
This exercise is inherently imperfect, which is why the estimates vary so widely and should be understood as orders-of-magnitude estimates. They likely overstate the cost where programs overlap with each other or existing spending. They understate the cost by failing to fully capture behavioral responses, broader economic effects, and the comprehensive scope contemplated by the DSA. Each estimate comes from different authors using different methods and assumptions, and builds on a similar methodology by David Burton.
Internationally High Spending
In the US, federal, state, and local governments spent almost 40 percent of GDP in 2024. The average across the European Union is 49 percent, ranging from 58 percent in Finland to 22 percent in Ireland.
Using the lower-bound estimates, the DSA agenda would raise US spending to more than 57 percent of GDP. Among large, industrialized countries, only Finland would have a larger government. France comes in a third of a percentage point under the US’s low estimate. Add the high-end estimates, and US government spending would reach 92 percent of GDP.
No comparable country on Earth spends anywhere close to that amount. The DSA agenda’s spending could give the government a claim on national output much closer to estimates of state control under Soviet-style communism than to today’s European welfare states.

Who Pays?
The federal government is projected to collect $70 trillion in taxes over the next decade, roughly 18 percent of GDP. Paying for the DSA agenda would require roughly doubling federal revenue at the low end and quadrupling it at the high end, in addition to the revenue needed to cover the Congressional Budget Office’s $24 trillion projected ten-year deficit.
The DSA suggests that the richest Americans and corporations will pay for all these new outlays. The problem is, there simply aren’t enough resources at the top to make this plan work.

The 400 wealthiest Americans were worth a record $6.6 trillion in 2025. Confiscating all of their wealth would cover only about 9 percent of the low-end revenue requirement and 3 percent of the high-end estimate. Their wealth could be seized only once, and attempting to liquidate trillions of dollars in assets would, in turn, drive their value down.
Domestic corporate profits after federal taxes are projected to be about $35 trillion over the next decade. Seizing every additional dollar of corporate profits would fund half of the low-end estimate and 17 percent of the high end. This also assumes that firms continue operating normally while the government takes every cent of profit. Without a profit motive, businesses would cease to exist.
Higher earners are also not a source of vast untapped revenue. A recent report by economists at the Joint Committee on Taxation concluded that raising top federal income tax rates to their revenue-maximizing level would result in revenue gains of less than 0.1 percent of GDP, equivalent to roughly $400 billion over a decade at today’s projected GDP levels.
The entire wealth of the richest Americans, plus every dollar of corporate profit and maximum top income tax rates, still leaves the DSA agenda between $29 trillion and $169 trillion short.
The only remaining source of revenue large enough to cover the DSA agenda is the same one every large European welfare state relies on: the middle class. France and Finland don’t fund their large governments by only taxing billionaires. They impose high income, payroll, and consumption taxes on ordinary households.
To cover the DSA’s high-end spending estimate and current deficits, every $1 the federal government collects today would need to become about $4.36. Mechanically applying that increase to individual income-tax rates would push the 24 percent bracket above 100 percent and the top rate above 160 percent.
The DSA is promising Americans a world in which someone else will pay for potentially hundreds of trillions of dollars in new benefits. The problem is that there aren’t enough rich people or corporations to pay for Democratic Socialism. Eventually, the bill will come for the rest of us."
Monday, August 10, 2026
Revenue over reason: A case for home distilling
"Want to distill spirits at home? Congress says you can’t. This ban from the Reconstruction era was not instated for health or public safety reasons. Rather, the prohibition arose from the inability to accurately tax home-produced alcohol. This reasoning does not justify such a restrictive practice. Distilling is a historically significant process with deep ties to the culture of this nation. Depriving Americans of this liberty in their own home undercuts a storied American tradition.
Creating home-brewed spirits was not a niche or commercial practice in early America; it was an everyday routine. Alcoholic beverages were a staple of the early American diet and were often much safer than local water sources. Wives were often responsible for the process and used various crops distilled into safe beverages to quench the thirst of their households. Stills were treated as ordinary kitchen appliances, like a butter churn or wood oven. In the late 18th century, 25 percent of households in Augusta County, Virginia owned and operated home stills.
Distilling was not just a household chore; it was also a primary source of income for many farmers. Common crops, such as barley, corn, apples, and peaches, were all vulnerable to spoilage even across short distances. Where travel was especially difficult, distilling these crops provided a more resilient product and a steady source of income for many.
After the Revolutionary War, Alexander Hamilton proposed an excise tax on distilled spirits to tackle the extreme debt the country had accumulated. Excise taxes operate by taxing the manufacture of a targeted good rather than the income generated from sales. Many farmers reacted in outrage, sparking the famed Whiskey Rebellion, during which George Washington led a militia of 13,000 troops to quell the unrest.
The rebellion represented the first violent domestic challenge under the new American Constitution. Hamilton’s enforcement of the tax required every still, no matter how small, to be registered with the federal government. The upheaval underscored the importance of distilling culture in early America. Citizens felt betrayed by their newly formed government, not only due to the tax, but also government intrusion into routine household activities.
Distillation remained common in the home despite the tax, and Jefferson later repealed it, much to the delight of many Americans. Soon after the distilling culture exploded. The early 19th century came with many advancements in distilling, making the practice accessible to non-farmers. An author at the time noted “we find men of science, men of capital, lawyers, doctors and merchants abandoning other pursuits to learn the art of extracting spirit from grain.” Distilling was no longer merely a household chore or a farmer’s practice; it had become a hobby.
The Civil War marked the second excise tax on spirits. Lincoln had to finance the war, and since stills were so common, spirits were the obvious choice for a tax. Once the war was won by the North, the tax extended to the southern states. The agriculturally dependent South hated the tax, often flouting federal collection officers. In fact, during the early days of the policy, nearly seven out of every eight distilled spirits went untaxed.
This led to a federal clampdown on spirits. In 1868, in order to “secure the revenue” of the spirit excise tax, Congress passed sweeping reforms on enforcement. Distillers were instructed by statute to turn over the keys to their distilleries, allowing inspectors to enter the premises at all times. If they were denied entry at any point, congress authorized them to use any force necessary to gain access.
Because of the obvious hurdles involved in enforcing this surveillance, home distilleries were banned outright. Taxing home distilled spirits would be nearly impossible. In order to further dissuade home distilling, Congress attached harsh penalties to the activity. From that point onward, operating a still in or near a home resulted in a felony, up to five years in federal prison, and, in some cases, forfeiture of their property. Home distilling, once the task of the homemaker and the fun of the hobbyist, was now strictly illegal.
The Treasury was not passive in its enforcement either. The 1880 annual report of Internal Revenue declared “the day of the illicit distiller” over with 4,061 illicit distilleries seized and 7,339 people arrested on account of the new enforcement techniques. Distillers were pushed into the forest under moonlight to avoid internal revenue officers, earning them the now infamous name “moonshiners.”
Around this time social perception of distilling was soured by its close association with violent criminal activity. Moonshiners would clash with enforcement officers, often leading to shootouts. The alignment of some moonshiners with the Ku Klux Klan damaged their reputation as well. Once the 18th Amendment and Volstead Act were passed, illicit distilling, including home distilling, had firmly cemented itself as a stigmatized practice.
However, the Prohibition would not stand for long. Due to enforcement problems, the propagation of organized crime, and the loss of revenue from the excise tax, the 21st Amendment repealed the 18th Amendment, decriminalizing the production and sale of alcohol. However, this liberty remained limited to heavily regulated commercial breweries, wineries, and distilleries. The government was seeking an easily taxable commodity to pull itself out of the Great Depression.
1978 marked the first meaningful restoration of home production of alcoholic beverages. With extensive advocacy efforts from the hobbyist brewing lobby, H.R. 1337 was signed into law. It amended the tax code exempting home-brewed beer and wine from taxation and legalizing their production for personal use. Notably, home distilling was neither decriminalized nor exempted from the tax.
Legalizing home distilling is the next logical step. The prohibition was a step too far, and ever since the regulation of alcohol has been trending downward. For such a common practice during the founding, it is shocking that home distilling carries such steep penalties. The federal government picked this fight, not frontier farmers. The ability to produce spirits in your home for personal consumption should not be infringed. It is what George Washington, with his own home distillery, would have wanted."
Friday, August 7, 2026
The Deadly Focus on Income and Wealth Inequality
Wealth Inequality, Sylvia Nasar, Jeff Bezos, Elon Musk, Bernard Madoff, LBJ
"Readers under age fifty-five might not realize this, but economic inequality was not a large issue in American political discussions until 1992. After that year, discussions of the issue ebbed and flowed. So much of what has been said by opponents of inequality is simple assertion. What has been missing in the statements of those who want government to reduce inequality is much information about why it exists and any sense of why some kinds of inequality are good.
Unfortunately, a single-minded focus on reducing inequality will lead to bad outcomes, even death. That conclusion follows from standard economic reasoning about the causes of economic growth. Reducing inequality by lopping off wealth from the wealthiest would lead to less economic growth; lower economic growth makes death rates higher than otherwise.
You might think that the focus on wealth inequality has come about because of the huge growth in wealth of the 100 or so wealthiest people in the world, many of whom live in the United States. While that surely has made the issue more prominent, the upset about inequality began well before that. I date it at 1992. In 1992, Jeff Bezos, whose wealth is close to $300 billion, had not yet even started Amazon, the source of his wealth. He and his then-wife MacKenzie Scott started Amazon two years later, in a rented garage. In 1992, Elon Musk, now the world’s wealthiest man, was a twenty-one-year-old undergraduate at Queen’s University in Kingston, Ontario, who was about to transfer to the University of Pennsylvania.
So, if not the wealth of Bezos and Musk, what did lead to the focus on economic inequality? Two key factors were an article in the New York Times and a politician running for the Democratic nomination for president who picked up on that article.
The New York Times article was reporter Sylvia Nasar’s “The 1980’s: A Very Good Time for the Very Rich,” March 5, 1992. In that article, Nasar reported data from the Congressional Budget Office on income gains at various percentiles of the income distribution. She quoted Paul Krugman’s exaggerated statement that “it [the additional income from a growing economy] all went to the very top.” As a good reporter, she also gave balance. She quoted Lawrence Lindsey, who, in his book The Growth Experiment, had noted that the early 1980s drop in the top federal income tax rate from 70 percent to 50 percent encouraged high-income people to use fewer tax loopholes and thus show more taxable income on their tax forms. One important example, which Nasar didn’t mention, was municipal bonds. Interest on those bonds was exempt from the federal income tax and so that interest income was not reported on tax forms. But when the top rate fell to 50 percent, high-income people shifted much of their investment away from tax-exempt municipals to other investments whose income was subject to the federal tax. The income from those investments showed up on their tax forms, making it look as if their income had risen substantially; in many cases, it hadn’t.
These are the opening paragraphs of my latest Hoover article, “The Deadly Focus on Income and Wealth Inequality,” Defining Ideas, August 6, 2026.
And:
The other main myth is that the rich don’t deserve their wealth. It’s true that a small percent of them didn’t or don’t deserve their wealth. If they obtained their wealth through fraud or by using the political system to get special treatment, then they are undeserving. Exhibit A for someone who got his wealth through fraud is Bernard Madoff, who ran a Ponzi scheme to take wealth from strangers and even from friends.
Exhibit A of someone who got his wealth as an insider in the political system is Lyndon B. Johnson. In the 1940s, after he had defended the budget of the Federal Communications Commission, an official at the FCC suggested that the Texas congressman’s wife buy a license to operate a radio station in the Austin market. She did so and only a few weeks later, applied for a better part of the spectrum and for longer hours of operation. Both requests were granted within weeks. The FCC also was slow to grant licenses for other radio stations to compete in the lucrative Austin market. By the time LBJ ran for president in 1964, the market value of his and his wife’s net worth was between $9 million and $15 million, over half of which was the value of their media holdings. To put that in perspective, $14 million in 1964, when adjusted for inflation, would be $151 million today."
Sunday, August 2, 2026
Industrial carbon tax and carbon capture requirements increase the cost to produce energy, making Alberta uncompetitive with U.S. counterparts
By Jack Mintz. He works at The School of Public Policy, University of Calgary.
Impact of Carbon Policies on Competitiveness in Oil, Natural Gas, and Electric Power: An Alberta–US Comparison
- This study, based on a newly developed methodology to assess the impact of corporate, royalty, and energy taxes on production, estimates the impact of taxes and carbon policies on marginal cost of production in Alberta, Texas, and New Mexico for oil, gas, and power industries.
- In the absence of carbon policies, the existing tax and royalty system in Alberta is tax competitive except for conventional oil, despite the differences in tax systems among the three jurisdictions.
- US and Canadian capital subsidies encourage carbon, capture, utilization, and storage investments but do not improve cost competitiveness since the subsidies are offset by CCUS costs for marginal investments.
- With the existing Alberta carbon tax at $95, not only is Alberta’s conventional oil tax disadvantaged but the oil sands lose most of its tax advantage compared to projects in New Mexico or Texas (with enhanced oil recovery). Natural gas production remains tax competitive. With a carbon tax at $170, oil sand investments are somewhat tax disadvantaged.
- As Alberta’s effective carbon tax rate is increased by raising the rate and/or limiting allowances, both oil and natural gas production will be heavily disadvantaged compared to Texas.
- While much focus has been paid to the impact of the carbon tax on the oil sands, the biggest impact will be on the electric power industry. The carbon tax will noticeably increase power prices in Alberta which will impact competitiveness of many industries. This illustrates well the competitiveness issue for Alberta when carbon taxes apply in Canada but not the United States.
Saturday, July 25, 2026
The Myth of the Free-Riding Billionaire: Ray Madoff’s ‘The Second Estate’
In her new book, Ray Madoff argues that America’s wealthiest exploit the tax code at the public’s expense. But her critique understates both what the rich pay and what they produce.
"Wealthy professionals can be strident egalitarians or naive optimists about the benefits of government spending — or so it would seem after reading law professor Ray Madoff’s book The Second Estate: How the Tax Code Made an American Aristocracy.
Madoff clearly has an axe to grind against America’s wealthiest citizens, and she is deeply critical of the legal mechanisms they use to protect and transfer their assets. Her argument often seems to boil down to this: Why should wealthy Americans keep so much of their wealth for personal use rather than allow the public — or, more specifically, Congress — to decide how those resources should be spent?
Yet The Second Estate is no low-brow polemic. Professor Madoff knows federal tax policy well, and her explanations of the tax code and the ways wealthy individuals use it are often insightful. My disagreement is not with her description of the mechanics of taxation, but with her underlying assumption — at times explicit, at times implied — that concentrated wealth is inherently harmful because it deprives the federal government of resources.
The wealthiest Americans pay hundreds, thousands, or even millions of times more in taxes than the average taxpayer. More importantly, the companies they create and build make the country more prosperous and generate enormous tax revenues in the process.
This should be obvious upon reflection. The businesses created, owned, or led by members of the Forbes 400 employ millions of people and generate tens of billions of dollars in federal tax revenue each year.
Yet The Second Estate presents a very different picture: a special class of Americans who exist above the reach of the tax code and avoid contributing their fair share to government revenue. We can set aside the questionable assumption that more federal revenue is automatically beneficial for most Americans. The deeper flaws in Madoff’s argument stem less from what she says than from what she leaves out about the super-wealthy.
Myths About the Rich and Taxes
Professor Madoff is correct to distinguish between different types of federal taxes. Income from dividends, interest, and the sale of assets (capital gains) is generally taxed differently — and often at a lower rate — than income earned through wages.
Long-term capital gains and qualified dividends are typically taxed at rates of 0, 15, or 20 percent, depending on income level, while wages are subject to both income taxes and payroll taxes. Employees pay 7.65 percent in Social Security and Medicare taxes through FICA, and employers pay another 7.65 percent. Capital gains, by contrast, are not subject to payroll taxes.
As a result, a billionaire’s effective federal income tax rate can be lower than that of an employee earning a middle-class salary. Madoff correctly explains how these differences affect taxpayers who receive income through wages versus those who receive income through investments.
Suppose Adam is self-employed while Betty receives all of her income from dividends and long-term capital gains. The following table illustrates how their federal tax burdens would differ at income levels of $80,000, $160,000, and $320,000.

Madoff explains how wealthy individuals often borrow against their assets rather than sell them. They don’t pay taxes on those loans (though they do pay interest). This is true. Sometimes individuals with a net worth of tens or hundreds of billions of dollars will report little or no income in a year because their “salaries” or wages are very small and they didn’t realize any capital gains.
But the fact that the ultra-wealthy can avoid paying federal income taxes some years does not mean they avoid them altogether. They have to pay down their loans and lines of credit periodically. And if they want to make exceptionally large purchases or investments, loans from banks are not enough. Then they must sell shares, realize gains, and pay taxes. The super-wealthy undoubtedly pay far more dollars in taxes than any middle-class or upper-middle-class individual.
Elon Musk, for example, famously paid about $11 billion in income taxes in 2021. This particular tax bill was anomalous both for its size and because the IRS taxed much of it as ordinary income at a high tax rate. Musk had a huge block of his stock options that he had to exercise or lose. Yet even if those were the only income taxes he ever paid over the course of 50 years, that would still come out to ~$200 million in taxes annually — far more than any but the very wealthiest Americans earn over their lifetimes, let alone what they pay in income taxes.
Most of the super-wealthy find ways to pay lower rates on their income. Still, many wealthy individuals pay vast sums, in the tens or hundreds of millions of dollars, annually on dividend income (Steve Ballmer pays approximately $250 million every year). There are also large one-time tax payments from capital gains. Ken Griffin paid roughly $4 billion in 2021, Jeff Bezos paid about $2 billion in 2020 and 2021, Jensen Huang paid more than $100 million in 2024 and 2025, and Tim Cook paid roughly $300 million in 2021.
Even accounting for the payroll taxes paid by ordinary wage earners, these tax payments represent the equivalent of thousands upon thousands of “Adams” paying federal income taxes. And this is where the shortcomings of Professor Madoff’s argument become clear.
Her account gives the impression that the ultra-wealthy largely avoid taxes because their effective tax rates are often lower relative to their income or wealth. While wealthy individuals certainly have ways to reduce their tax liabilities and structure their assets efficiently, it is inaccurate to suggest that they simply avoid paying federal taxes.
It is also misleading to ignore the many other taxes the super-wealthy pay.
They pay property taxes on their land and houses every year. In places like Los Angeles and New York City, those tax bills can reach hundreds of thousands or even millions of dollars. They pay taxes when they shop, dine, or travel. They pay transfer taxes, building fees, development fees, and a host of other taxes and charges.
That is hardly “free-riding” on the tax system — especially when they pay many times (10, 100, or even 1,000 times more) than the average taxpayer while consuming nowhere near that proportion of government services.
The Wealth Creation the Tax Debate Ignores
Even this oversight, however, misses the most important contribution of the super-wealthy to society: wealth. Focusing on how much Elon Musk or Jeff Bezos or the Mars family pays in personal income or other federal taxes in a specific year is a red herring. It is a rounding error compared to how much wealth their companies have generated for shareholders and how much tax revenue they have generated. Focusing on the corporate income taxes paid (or not) by individual companies makes similar mistakes.
Consider Tesla. Over the past five years, the company has reported relatively little federal income tax liability (about $48 million in 2023) despite nearly $20 billion in net income. This is largely because Tesla has carried forward previous losses, invested heavily in new capital, and benefited from certain green energy and research-and-development tax credits. Yet Tesla employs roughly 134,000 people. If the average wage for those employees is $100,000, the company would pay more than $1 billion annually in employer-side FICA taxes alone. Employees would pay another $1 billion-plus through their share of payroll taxes — not including the income taxes they pay.
Those figures are small compared to what Amazon (1,100,000 employees), Apple (90,000 employees), Meta (45,000 employees), and Alphabet (115,000 employees) pay in FICA taxes — over $10 billion annually for the employer share alone.
Madoff’s quixotic crusade against dynastic or family wealth is just that — tilting at windmills. Only a quarter or so of people on the Forbes 400 list inherited the majority of their wealth. And that number gets smaller as you move to the top 100 and then the top 50. Inherited wealth can only last if it remains invested in companies rather than cashed out or spent. For every example of inherited wealth growing, there are more examples of inherited wealth becoming depleted.
Who Owns Wealth?
All of this raises a basic question: Why should we care that families such as the Mars, Walton, or Koch families possess wealth they can pass on to future generations?
Madoff argues that the wealthy “free-ride” on the tax system. But this assumes their money somehow already belongs to the government or the public.
It does not.
Madoff also suggests that the super-wealthy exercise undue political influence from the shadows. In this, she leaves the solid ground of analyzing existing tax rules and mechanisms to the ideological concerns and disapproval she has for large concentrations of wealth in general.
Could the tax code be fairer and better than it is? Certainly. Will her specific recommendations make it so? I’m not sure. But will politicians implement her “ideal” policies? Assuredly not.
Besides raising revenue, the tax code should distort and discourage economic activity as little as possible. While everyone benefits from clear rules of the game that promote competition and responsibility, it’s far from clear that they would all benefit from more “tweaks” to the tax code to close loopholes. Revenue with minimal distortion, not leveling the fortunes of the super-wealthy or making sure they pay their “fair share,” should guide tax policy.
Lobbyists, insiders, and wealthy individuals have certainly influenced the tax code for their own benefit. But so have middle-class homeowners through mortgage deductions, residents of high-tax states through state and local tax (SALT) deductions, and lower-income Americans through welfare programs and tax credits. This is how the political game is played.
Rather than criticizing the super-wealthy for minimizing their tax liabilities as best they can, policymakers should focus on reducing government spending so that everyone else’s taxes can be reduced too. Reducing political power, limiting the coercive reach of the state, and allowing individuals to keep more of what they earn would do far more to improve Americans’ lives than taking more money from the wealthy and giving it to politicians.
Such broad-based reforms would also be more just."