Saturday, October 31, 2026

Some Common Fallacies About American Health Care

See 50 Common Fallacies About American Health Care by Richard E. Ralston. Excerpt:

"Following are some of the most common arguments with suggested responses that apply the principles discussed above.

1. “The quality of health care in America is ranked lower than 36 other countries.”

When you hear this, always ask, “Ranked by whom and how?” In 2000 United Nations bureaucrats at the World Health Organization sent a survey to “officials and experts” selected by the U.N. Why should we be surprised to learn that government “officials and experts” in France thought that their government-run health care system was the best in the world? The scoring of these surveys also made them meaningless. For example, 25 percent of the scoring was weighted based on the assessment of how “fair” the financing was in each country. For “fair,” read socialist—the list was largely a ranking of how socialist each country’s system is.

2. “Medicare and Medicaid are far more efficient and less wasteful than private insurance, spending only three percent on administrative overhead.”

When you hear this, always ask, “Why is the administrative cost always given as a percentage?” One reason is that, due to the age of covered patients, the average Medicare and Medicaid reimbursements are higher than those of private insurance—and administrative costs are therefore a lower percentage of the larger amount paid. Another reason is that the huge cost of contending with 130,000 pages of Medicare regulations is pushed onto the providers. The cost of the more than 100,000 employees of the Internal Revenue Service who collect Medicare taxes are also omitted from Medicare’s “administrative overhead.” But the biggest reason is that the government programs make no effort to minimize expense or fraud. Fraud counts for about $50 billion in Medicaid expenses every year—as high as $18 billion in New York alone. Total spending has been going through the roof for more than 40 years, but the government’s administrative cost of burning money is quite low. That does not prove that the government is efficient or prudent. Private insurance companies, on the other hand, need to keep fraud and expenses down or go out of business.

3. “Government or universities develop most new medications and then just hand them over to pharmaceutical companies to manufacture and make all the profits.”

When you hear this, mention that the National Institutes of Health (a government agency) reports that the pharmaceutical companies—who spend about $60 billion each year on research—develop more than 90 percent of new drugs.

4. “Advertising of drugs is bad because it increases the price of medications.”

When you hear this, ask, “Why does any business advertise any product? Because they just want to add to their costs and increase the price?” Manufacturers of computers and other technological products who spend a lot on research need to find their market. A pharmaceutical company, spending an average of $800 million to develop a major new drug, has a few years of patent protection to bring the drug to the attention of physicians and patients who need it. This allows them to spread research costs over a much larger customer base and reduce unit cost—which lowers the price.

5. “Private corporations are wasteful and bloated bureaucracies. Government-provided health care is lean and efficient.”

When you hear this, you might want to laugh. Then ask, “So you think that the 20th Century proved that communism and fascism work?” Is the Department of Motor Vehicles or the purchasing practices of the Defense Department our best models of administrative efficiency?

6. “People live longer in some countries because of their socialist health care systems.”

When you hear this, ask if the people in those countries didn’t live longer before they nationalized their health care systems. Ask how many people in those countries died on their highways, were killed in combat, shot by criminals, addicted to drugs, were severely overweight or in poor health when they arrived as illegal immigrants."

California’s Billionaire Tax May Cost More Than It Raises, Reports Find

If a 5-percent levy chases billionaires out of Cali, the long-term income tax gap (not to mention litigation costs) will swallow any wealth-tax windfall.

By Thomas Savidge of AIER. 

"California voters will decide on Proposition 40, a proposal for “a one-time 5-percent tax on the worldwide net worth of individuals exceeding $1 billion,” this November. 

The measure’s obligation reaches backward to January 1, 2026, so any billionaire who was a California resident this year could owe a tax on the value of covered assets on December 31, 2026. Californians are essentially being asked to approve a tax whose residency trigger has already passed, and whose tax base doesn’t exist yet. 

A cadre of Nobel Prize winners justify support of Proposition 40 as “modest relative to the gains made by billionaires, yet large enough to offset the federal cuts to Medicaid.” Supporters of the proposition claim that the wealth tax can bring in $100 billion. A recent paper from Benjamin Jaros and Joshua Rauh, however, estimates what the tax could collect about $30 billion, with a range of $28 billion to $26 billion, after accounting for taxpayer departures and litigation risk. That estimate excludes lost future income tax revenue. If that lost revenue is included, Jaros and Rauh estimate a net fiscal loss of $38.9 billion in present value. That includes a “litigation survival discount” on the portion of taxpayers who stay to fight, and is validated by the wealth tax base elasticity literature. They note that the permanent loss of annual income tax revenues would offset the one-time wealth tax revenue.  

Jaros and Rauh’s analysis received a response from economist Gabriel Zucman, attempting to claim that Jaros and Rauh’s assumption of tax flight was unfounded. Jaros, Rauh, and others responded. Zucman wrote:

Why would billionaires permanently leave California in response to a one-time tax owed if they lived there on January 1, 2026? It would only make sense for them to leave if the tax becomes annual. But if the tax becomes annual, it would also generate revenue annually — by virtue of, well, being annual.  

Mr. Zucman is missing that the billionaires facing the wealth tax are strategic planners who can afford excellent advice. They will not wait around to see if Sacramento’s appetite grows.

What is Wealth? Can it Be Taxed? 

A wealth tax applies a tax rate to an individual’s net wealth (the market value of total owned assets minus liabilities) and is applied to net wealth above a certain threshold. While appearing straightforward, however, those eager to enact a wealth tax will find that it can be difficult to define wealth, let alone measure it accurately. 

A wealth tax requires lawmakers to decide which resources count as wealth, who owns them, and how to put a dollar value on them. The IRS defines “net worth” as total assets minus debts and mortgages (“mortgages, liens, and other debts of the individual”). The complications begin once a law must specify what belongs on each side of the calculation. 

While some assets (such as real estate and personal property) can be reasonably appraised, other forms of wealth can prove more difficult. Determining the value of bank accounts or financial assets heavily depends on when the valuation takes place, because their value fluctuates over time. Other assets such as fine art, wine, or jewelry do not have a readily available market value because there is often not a liquid market that can be referenced for valuation purposes. Any attempt to value these kinds of assets involves a degree of subjectivity. 

Proposition 40 runs into similar difficulties. It proposes taxing worldwide assets of taxpayers and their spouses (the spouse’s residency does not matter), minus permitted debts. Directly owned real estate, somewhat unexpectedly, would be excluded from the wealth tabulation, but property held through a corporation would be reflected in the value of its shares. The tax treatment of a building depends on how the owner holds it. 

Proposition 40 attempts to value private businesses by adding the company’s book value to 7.5 times its average annual accounting profits and then multiplying that sum by the taxpayer’s presumed ownership share. Those calculations, however, might differ from what buyers would actually pay for the business based on expected future earnings and risks. 

The proposition’s attempts to determine ownership further complicate matters. The Revenue and Taxation code states that when a non-publicly traded business interest carries voting or other direct control rights, the taxpayer’s ownership percentage is presumed to be “no less than” the taxpayer’s share of the entity’s overall voting or direct control rights.  

Suppose that formula values a private company at $2 billion. Its founder holds 10 percent of the economic interest but controls 60 percent of the votes. If the founder’s stake were valued strictly according to the 10 percent economic ownership, the calculation would be $200 million. If the founder’s stake were valued using the proposal’s voting rights presumption, it would be valued according to the 60 percent share of the votes, or $1.2 billion. The same company could produce a sixfold difference in the founder’s presumed taxable interest depending on whether the calculation follows economic ownership or voting control. If slammed with a tax, the taxpayer or the state’s Franchise Tax Board must produce a certified appraisal to overturn the tax calculation. 

The measure also instructs appraisers to disregard forced-sale prices (which often fall below normal market prices) despite the fact that the imposed wealth tax may well force an owner to sell assets or borrow against them. 

Wealthy taxpayers are left facing a tough choice. Exemptions can treat comparable assets differently, while valuation formulas can produce assessments that owners dispute. Some may be able to challenge the tax through an appraisal, with additional work and money fronted by the state. Before officials can collect a wealth tax, they must settle disagreements over what’s being taxed and what it’s worth. 

A One-Time Windfall?  

In the proposal for Proposition 40, Jasper Boll, Emmanuel Saez, and Gabriel Zucman estimate that Proposition 40 could collect roughly $100 billion. In their paper this month, Jaros and Rauh estimate wealth tax collections to be closer to $30 billion, but the overall fiscal effect is negative. The Legislative Analyst’s Office, California’s nonpartisan fiscal adviser, estimates a similar tradeoff between temporary receipts and recurring revenue losses. Specifically, the wealth tax would collect tens of billions of dollars over several years as well as ongoing income tax losses of “less than $1 billion per year” and administrative costs of “tens of millions of dollars per year for several years.”

In a Substack post, Jaros, Rauh, and others respond to criticisms recently raised by Gabriel Zucman on X (formerly Twitter). Many billionaires have already left California, with some citing the potential wealth tax as the reason. Even if the wealth tax survives legal challenges (specifically the legality of a retroactive valuation), Rauh and Jaros note that billionaires leaving California will result in massive income tax revenue losses of $3.3 to $5.8 billion annually and growing. 

The exodus of (especially high-net-worth) taxpayers will place greater strain on the already strained California budget. In September, Governor Gavin Newsom vetoed a bill that would increase post-retirement benefits for police and firefighters, citing a pension crisis and budgeting woes. Additionally, Medi-Cal, the California Medicaid Program, takes up 35.1 percent of California’s total expenditures, making it the single largest line item in the state budget. 

Research from Rauh and others also finds that Medi-Cal spending nearly tripled after 2011 and that most anticipated federal reductions would occur after 2030, long after the wealth tax was collected. Meanwhile, California continues to face recurring budget deficits despite recent revenue booms. A one-time wealth tax may, at best, postpone some difficult budget cuts, but it will not permanently reconcile recurring spending with recurring revenue. 

The Politics of “Just This Once” 

Jaros and Rauh state in Section 6 of the paper, “If the state of California votes to enact this tax, and if it is sustained by the courts, the constitutional barrier to future wealth taxation is removed, and the state’s ability to commit to not enacting additional wealth taxes is substantially diminished.” Once lawmakers and interest groups develop a taste for wealth taxes, they will predictably try for more in the future. 

These concerns are not unfounded. Saez and Zucman have explicitly called for “a permanent wealth tax down the road.” Additionally, the use of the wealth tax revenue on Medicaid, a recurring budget commitment, makes future wealth taxes all the more tempting, especially when the federal cuts to Medicaid do not begin until 2030. 

Interest groups would also be prepared to mobilize and advocate for future wealth taxes. The SEIU-United Healthcare Workers West sponsored Proposition 40, and health care programs would receive 90 percent of its proceeds. An organized constituency has serious motivation to campaign for something that clearly benefits them while dispersing the costs among Californians. 

California’s income tax changes provide a cautionary tale. In 2012, voters approved Proposition 30, an increase on the existing 9.3 percent personal income tax rates on higher incomes through the end of 2018. These temporary increases were then extended through 2030, when voters approved Proposition 55 in 2016. Once government spending has been promised, it is tempting for policymakers to turn “one time” into “one more time.” 

Wealth Is Mobile — and It Moves 

Mark Zuckerberg, CEO and founder of Meta Platforms, recently struck a deal with the company after expressing an intention to leave California for Florida over the possibility of Proposition 40. Meta gave Zuckerberg non-voting shares that he can sell to foot the wealth tax should Proposition 40 pass, in exchange for a promise to reside in California, near Meta headquarters, for eight years. 

Wealth tax advocates who point to this episode as an example of billionaires being able to “pay their fair share” are missing the bigger picture. People can only be paid to stick around for so long. California’s spending obligations are still massive and thousands of Californians of all incomes have taken notice and left the state.  

The Golden State exodus will likely continue until Sacramento revises its tactics. The more people, companies, and investments leave the state, the more California will struggle to meet its obligations. If the tax encourages high-income residents to leave, the state could sacrifice future income-tax revenue for a short-term infusion of funds. California still thinks it can tax and spend its way out of its budget woes, but wealth doesn’t stick around where it’s under attack."

Friday, October 30, 2026

Gap in living standards between Canada and the U.S. has more than doubled from 1999-2024; U.S. now $23,757 higher than Canada

By Grady Munro, Jake Fuss and Joel Emes of The Fraser Institute.

Squandering the Canadian Century Part 1: Comparing Economic Performance in Canada and the United States

  • At the turn of the 21st century, some hoped this would be the “Canadian Century” wherein Canada’s economic growth could begin to rival that of the US. Now, a quarter of the way into the century, this study compares economic performance in the two countries across a variety of measures to see whether this hope is beginning to materialize or if policymakers have squandered this opportunity.
  • In 1999, inflation-adjusted gross domestic product (GDP) per person in the US was CA$10,766 higher than in Canada. By 2024, that gap had more than doubled to CA$23,757.
  • Similarly, in 2010, inflation-adjusted median employment income in the US was CA$6,126 higher than in Canada. By 2024, that gap had increased to CA$8,663.
  • Since 1999, Canada experienced higher levels of government-sector employment growth than private-sector employment growth, resulting in a shrinking private sector and growing government sector (both as a share of total employment). The US experienced the opposite.
  • Canada has also seen a decline in business investment relative to the US. From 2007 to 2024, investment in Canada went from nearly 90 cents (per worker) for every dollar invested in the United States to 54 cents (per worker).
  • From 1999 to 2025, labour productivity increased 26.7% in Canada, compared to 67.9% in the United States.
  • These measures show that policymakers have thus far squandered the Canadian Century. In particular, Canada began to truly squander this opportunity post-2014. Prior to 2014, Canada largely kept pace with, or in some cases exceeded the US, across multiple measures.
Squandering Canadian Century


Thursday, October 29, 2026

Puzzling Results at the USDA

New research raises questions about federal conservation spending

By Jane Shaw Stroup of The Independent Institute. 

"The Department of Agriculture (USDA) is a giant agency with a $481 billion budget, 65 percent of which goes to the food stamp program. As the 2026 farm bill nears passage this autumn, the public is watching a bitter partisan debate over food stamps. But few people—other than insiders—are scrutinizing the rest of the bill. Yet other agriculture programs, although minuscule compared to food stamp benefits, deserve attention, too. The USDA pays $5.3 billion a year for its conservation programs. Two recent studies raise questions about their effectiveness and appropriateness. 

Woody Encroachment

Let’s start with woody encroachment. This is the unplanned intrusion of trees and shrubs into croplands and grasslands. Such vegetation reduces the amount of land that can be used for raising crops or grazing cattle, thus reducing production. 

In 2019, the Natural Resources Conservation Service (NRCS, an agency of the USDA) started the Kansas Great Plains Grassland Initiative (KGPGI). Its goal was to end, or at least slow, woody encroachment in Kansas. Two researchers from Kansas State University studied this problem carefully. 

Between 2017 and 2024, the USDA spent only $24 million addressing woody encroachment in Kansas, while the problem was causing landowners $30 million in forage losses each year (and even more in Oklahoma and Texas). Surveying landowners of Kansas cropland, the researchers found that between 41 and 61 percent of the landowners saw this encroachment as a major problem. Yet relatively few were participating in the government’s Environmental Quality Incentives Program, which provides payments for addressing environmental issues such as this. 

So why the low participation? The researchers, Jackson Lindamood and Gabriel S. Sampson, found “high [tree and shrub] control costs, labor constraints, and difficulties prioritizing treatment areas,” as well as landowners’ “limited awareness, uncertainty about eligibility, and program complexity.”

The authors then began an economic study to calculate the impact of woody encroachment on land values, knowing there might be benefits as well as losses. They selected more than 12,000 parcels for which they had land sale prices and environmental data from 1990 to 2024.

Very simply, they found that woody encroachment increased land values. “The value of a one percentage point increase in woody cover on the parcel is associated with increased per-acre value ranging from $9 to $27 depending on model specification,” they wrote. This new vegetation was providing habitat for wildlife, which encouraged recreation, especially hunting—a service that was more valuable at the margin than raising crops or grass alone.

They called their findings “somewhat of a management and policy paradox: landowners face high costs to control woody encroachment on grassland, yet the land market places a land value premium on woody cover.”

So perhaps woody encroachment is a good thing and should be left alone? It’s not clear whether the researchers saw it that way. “This suggests a clear role for policy interventions that substantially lower the costs of control, have clear eligibility guidelines, and are easy to navigate for producers or landowners,” they wrote.

CRP and Land Values

There is something amusing about the upside-down effect of woody encroachment, but to me, there is something disturbing about a recent study of the Conservation Reserve Program (CRP). Unlike the woody encroachment program, the CRP—the USDA’s largest conservation program—pays farmers to reduce their usable acreage by setting aside marginal or erodible land. Started formally in 1985, it has two goals: increasing natural habitat and, by reducing farmland, keeping up crop prices.

This year, the environmental research organization Resources for the Future (RFF) produced a comprehensive working paper by Matthew Wibbenmeyer et al. on the effect of the CRP on nearby property values. 

The paper begins: “Conservation is often perceived to be at odds with economic activity.” Specifically, the government’s “payments for eco-system-services” under the CRP has caused anxiety that its “spillover effects” may be harming rural communities. This could happen “by reducing outputs, employment, and demand for support services from agriculture, forestry, or other land-based industries.” 

On the other hand, they continue, there are also benefits, such as “improved environmental quality, recreational amenities, and landscape resilience to erosion, extreme weather, and ecological disturbances.”

The RFF used CRP data and residential property values to find out if CRP land affects the value of nearby homes. And it does. They write: “a 10-hectare [2.47-acre] increase in CRP enrollment [by landowners] results in an approximately 4 and 1.6 percent increase in the value of homes within 500 and 1,000 m[eters], respectively.” Nationally, this adds up to an increase in residential property values by $775 to $900 million per year.

So a government payment program to keep up prices and protect the environment raises the value of nearby land. That’s nice, but should taxpayers pay money to raise the land values of what may be well-heeled homeowners who aren’t, as far as we know, doing anything special to protect the environment? Whatever the answer, the question is largely irrelevant. The paper seems to be a strategic effort to boost the CRP.

Over the years, the CRP has not shown environmental benefits that are dramatically greater than costs. In fact, in 2007, Leroy Hansen, an economist at the USDA’s Economic Research Service, wrote that: “Nationally, the CRP is estimated to provide $1.3 billion in annual benefits, which represents 75 to 80 percent of the program’s cost.” In other words, by cost-benefit standards, it is a net loss. This study by RFF gives support to the benefit side. 

These two cases suggest that members of the public should take a closer look at the USDA’s conservation programs."

Share of incomes and income taxes by brackets

From Mark Perry.

May be an image of text 


Wednesday, October 28, 2026

America’s Misplaced Income Priorities

You won’t hear it from politicians, but economic inequality is on the decline

By Ryan Young of CEI.

"The national inequality debate is asking the wrong questions. Pundits are cheering a recent Congressional Budget Office (CBO) report showing a decline in income inequality in the United States, but focusing on the mathematical ratio between high and low incomes distracts from more important questions: How are low-income people actually doing? Are they becoming better off in absolute terms? Effective poverty-fighters focus on real people, not ratios.

The headline finding of the CBO report is a decline in the country’s Gini coefficient, which measures how evenly income is distributed on a scale from zero to one. A value of zero represents identical incomes for everyone, while a value of 1 represents one person earning all the income and everyone else earning nothing. In 2023 — the most recent year with available data, discussed in the CBO report — the Gini coefficient in America after transfers and taxes was 0.418. This is down from 0.442 in 2021. That puts the U.S. in the highest quarter or so among OECD countries.

Contrary to its reputation, the U.S. has a highly progressive tax code and a large welfare state. According to a different dataset from Our World in Data, taxes and transfers moved the U.S. Gini coefficient from 0.51 to 0.39 in 2024.

Medieval France and Italy were very unequal, with Gini coefficients estimated to have been around 0.70. Modern dictatorships with entrenched elites, such as Russia and North Korea, also have high inequality, though they do not publish reliable data.

The rich and powerful in these societies got that way through force and through political connections, which are a zero-sum game. In liberal democracies with relatively free markets, by contrast, most people must earn their money honestly through positive-sum trade. Entrepreneurs have to offer people things they value. In these societies, measures of inequality ought to count for very little.

According to a well-known 2004 study by Nobel-winning economist William Nordhaus, entrepreneurs capture only about 2 percent of the value they create. By that estimate, for someone like Jeff Bezos to capture $1 billion in value, roughly $49 billion would accrue to customers, employees, shareholders, and suppliers. Unlike feudalism or socialism, market-based wealth is positive-sum. That’s a pretty good deal ethically and materially. In market-based societies, Gini coefficients are a question of aesthetics, not of well-being. For example, Michigan Senate candidate Abdul El-Sayed recently said, “I’d rather have an economy that makes 1,000 millionaires than 1 billionaire.”

This statement is fine as an aesthetic preference. But that is different from making as many people as possible as well-off as possible. Each productive billionaire creates numerous millionaires through the wealth their ventures create. SpaceX’s IPO created about 4,400 new millionaires, for example. That’s part of the reason why, in the United States, there are currently about 28,000 millionaires for every billionaire.

Ethically, what is important is not relative poverty, but absolute poverty. Do people at the economic bottom have enough to live in comfort and dignity? Are they becoming wealthier over time?

Data from the St. Louis Federal Reserve’s FRED database find that people at the economic bottom are indeed becoming wealthier. This shows another problem with obsessing over inequality.

Many people have low annual incomes but plenty of saved wealth, such as retirees. Many younger people with children, mortgages, and student debt have higher incomes but little wealth, or even negative wealth. The important thing is that they all have a decent standard of living that improves over time, regardless of how their situation affects the Gini coefficient.

In inflation-adjusted dollars, the bottom 50 percent of households had about $700 billion of wealth in 1989. Since then, it has more than doubled to $1.7 trillion."

Tuesday, October 27, 2026

Great tweet from Phil Magness on the tariffs

Click here to see it.

Image 


Media Bias and the L.A. Times

By David Henderson. 

"This a repost of an EconLog post I did in 2010. What motivated me to repost is something I read in the Wall Street Journal a few minutes ago. It’s James Freeman, “Kudos to the New York Times,” WSJ, October 26, 2026. Freeman writes about an interaction between constitutional law scholar Josh Blackman and Patrick Healy, the NYT’s assistant managing editor for standards and trust. [DRH aside: That title is already revealing. The NYT thinks it needs a special editor for standards and trust? Wow!] 

Here’s a quote from Blackman that Healy uses in his piece:

Back in February of this year, I was quoted twice in The New York Times back to back in the span of 24 hours, which is, you know, pretty cool. But I sort of noticed that both of the references were to Josh Blackman as a “conservative” law professor. And I just thought that was strange. So I went through the Westlaw archives and just sort of searched for “liberal” law professors and “conservative” law professors in the New York Times database, and it was far more likely that you’re identifying a conservative than a liberal. And those numbers are stacked because liberals are quoted even more often. So the numbers even have a greater disparity.

The whole NYT piece is worth reading. Healy was fairly accountable, which doesn’t mean that his colleagues will be.

It reminded me of a not so nice interaction I had in 2008 with Ralph Vartabedian of the Los Angeles Times. I wrote about it in 2010. Here it is.

Bryan Caplan’s and David Boaz’s comments on media bias remind me of an incident that happened almost two years ago. Ralph Vartabedian called me to get my take on the members of President-elect Obama’s economic team, particularly Christina Romer and Larry Summers. I answered his questions. At no time did he ask my ideology. Here’s his article. [DRH note: Surprisingly, you can still access it.]

In case you’re in a hurry, I’m posting here the relevant 2 paragraphs:

He also will have to work with some outsized egos and giant intellects on Obama’s economic team: Lawrence H. Summers, chairman-designate of the National Economic Council; Timothy F. Geithner, nominated to be Treasury secretary; and Christina Romer, chosen to lead the Council of Economic Advisors.

The group is generally not of one mind. Major differences exist in how they view regulation, monetary control and fiscal policy. Summers, for example, was among the Clinton administration officials who helped relax federal regulation on Wall Street, recalled David R. Henderson, a conservative economist at the Hoover Institution. Romer has questioned how well fiscal policy works at all, a central tenant of Democratic economic thinking.

So I wrote him the following:

Dear Ralph, 

I saw your piece. I’m not a conservative. I notice also that not only did you get my ideology wrong but also that I’m the only economist to whom you ascribed an ideology. What gives, Ralph?  

David

He replied:

Dear David,  

I thought your comment about Summers and Romer came from a viewpoint of significant concern about what the Obama Administration was going to do, so I used the reference only as an indicator that you are critical of at least Summers. As for the conservative label, I based that on a couple of points…clearly Hoover is known as a conservative organization and I have honestly never known anybody in it who was a liberal. I believe you were on the council of economic advisors under President Reagan, no? You seemed pretty critical of the liberal members of Obama’s team and our data base at the Times indicates you are a registered Republican there in the Monterrey [sic] area. I can give you a call later today. 

Ralph

I replied:

Dear Ralph, 
Those are all relevant techniques for figuring out my ideology–if I’m dead. Given that I’m alive, another way is to ask me.  
Also, couldn’t you use those same techniques to discern the ideology of Blinder and others you cited? And yet you didn’t.  
Best,  
David
Later that day, he did call me. He said he felt apologetic. I persisted and asked him why he didn’t ascribe an ideology to the other economists quoted, who clearly had ideologies. He explained that I was the only one quoted who was critical of the Obama team.
 
“Did you hear what you just said?” I asked. “Only those who are critical are given ideologies.”  
“Yes, I get it,” he said.   
That’s why I didn’t blog on it. I thought maybe he really did get it and I didn’t want to reduce my probability of being interviewed again. Twenty months later he still has not called for another interview. My guess is that by simply confronting him about it, I reduced my probability to close to zero."

Monday, October 26, 2026

The Washington Post‘s Editorial Board makes the case for letting “private capital determine how many data centers America needs.”

From Cafe Hayek. 

"But the political movement to slow down or block the growth of data centers could have adverse consequences for the entire economy. By some estimates, AI-related goods accounted for as much as three-quarters of all global trade growth in the first quarter of 2026 and upward of a third of U.S. economic growth.

Financial risk does not diminish the structural utility of technological advances. Many railroads failed, but the track remained. Ditto for companies in the 1990s that laid fiber-optic cable, which continues to generate value.

If CoreWeave has borrowed too much, creditors and shareholders will bear the consequences. If Microsoft or Meta wants another gigawatt of electricity, they should pay the cost of producing and transmitting it. But neither investors nor consumers benefit when zoning boards, permitting regimes and utility bottlenecks prevent otherwise economically viable projects from being built."

Sunday, October 25, 2026

Between 1900 and 1990, real consumption of house furnishings and apparel grew by a factor of 114

See Cataloging Growth: A Re-Evaluation of 1900–1990 by Veonica Backer-Peral & Benjamin Wittenbrink. 

"Measuring real GDP growth requires distinguishing changes in prices from changes in product quality and composition, yet systematic quality adjustment of price indexes is unavailable for much of the twentieth century. We construct a new quality-adjusted price index for U.S. house furnishings and apparel goods using 5.1 million product listings from Sears catalogs, 1900–1990. We use large language models to extract product information and estimate hedonic price schedules with detailed product characteristics, allowing us to infer annual changes in the cost of living. The resulting cost-of-living index implies substantially lower goods inflation than conventional deflators, and consequently implies much faster real economic growth: between 1900 and 1990, real consumption of house furnishings and apparel grew by a factor of 114 using our index, compared with a factor of 24 using standard goods deflators. The gap between our index and canonical ones is largest before World War II and suggests that productivity growth peaked earlier in the twentieth century than conventional estimates indicate."

Self-Destructive Class Warfare in the United Kingdom, Part II (high taxes sending the rich away)

By Dan Mitchell.

"Last year, in Part I in this series, I warned that the United Kingdom was pursuing a “sure-to-fail policy.”

More specifically, I explained that the class-warfare attacks on upper-income taxpayers were going to backfire for the simple reason that entrepreneurs, investors, and business owners could “vote with their feet” by moving to nations with better policy.

Which is exactly what’s been happening.

Today’s column will share fresh evidence on the consequences of the U.K.’s suicidal tax policy.

We’ll start with some excerpts from a new story in Bloomberg by Benjamin Stupples.

The exodus of the uber-rich from the UK has become a $160 billion problem. That figure, calculated using data from the Bloomberg Billionaires Index, lays out for the first time the vast amounts of money and assets behind those quitting Britain. It’s the total wealth represented by individuals tracked in the list who have loosened their ties with the UK — or cut them entirely — just in the past two years. …Tax changes targeting the wealthy since Labour came to office in 2024 are taking a growing toll…and near constant speculation that more measures are coming, has dramatically frayed the relationship between the well-heeled elite and the government. …The top 1% of UK earners account for about 27% all income tax revenue, according to government figures. When they leave, they also take their hefty spending power. …Half of the overall group finalized their departures from the UK — to territories spanning Monaco, Switzerland and the United Arab Emirates — in the weeks leading up to Labour bringing in sweeping tax reforms in April 2025.

Here’s a chart from Bloomberg listing the rich people who have escaped.

But that list is incomplete.

Today’s news adds even more evidence. As reported by Maira Butt for the Independent, another wealthy taxpayer has decided that the United Kingdom is no longer a good place to live.

Instead, he has decided that zero-income-tax Monaco is a good place to reside.

A billionaire who formerly topped the Sunday Times Rich list has become the latest wealthy businessman to leave the UK to take up residence in Monaco. David Reuben, 88, is a property tycoon and Newcastle United shareholder, who along with his younger brother Simon Reuben, has a combined estimated net worth of nearly £28bn. …A spokesperson confirmed to the publication that the property tycoon had moved to Monaco but declined to comment further. …Last week, billionaire Manchester United owner Sir Jim Ratcliffe complained that Britain’s billionaires were leaving as the country was “on the slide” and blamed high taxes and high immigration for the decline. The remarks followed the departure of several of the UK’s highest earners… More than 10 per cent of the total wealth identified in the Rich List is controlled by UK citizens who now reside in Monaco, a total of £77bn, according to The Times.

I’ll close with the depressing observation that the out-migration of successful taxpayers began when the so-called Conservative Party was in charge.

Because they were fiscally irresponsible, they imposed class-warfare taxes.

Once the Labour Party took over, they doubled down on that misguided approach.

The only silver lining to this dark cloud is that we’re getting more evidence for the Laffer Curve.

P.S. One takeaway from today’s column is that the U.K. desperately needs Milei-ism."

Saturday, October 24, 2026

Has Mexico’s “Canasta Básica” Policy Made Food More Affordable?

By Jeremy Horpedahl.

"A recent article in The Guardian profiles economist Isabella Weber. She doesn’t seem to like other economists very much, supposedly because we “obsess over ideological purity and are inflexible when searching for solutions.” Weber wants economists to come up with solutions that work even if… I guess, even if they don’t work well in theory? Maybe they will work well in practice?

Anyway, so far as I can tell, the article only gets into details on two concrete solutions to affordability. I’m sure she has more in her book, but let’s see what these are. The first for governments to create “publicly owned entities that can buy and sell grain into its market,” presumably to smooth out fluctuations in grain prices. The second is “the Mexican government’s canasta básica policy, through which retailers voluntarily cap the total price of a basket of two-dozen essential goods.”

Let’s look at the second one, since I think for developed countries like the US, fluctuating grain prices aren’t the primary source of affordability concerns. But perhaps American consumers would like a basket of grocery essentials to be cheaper.

Has this policy in Mexico worked? It was first implemented in 2022, and food inflation has certainly fallen in Mexico since then. But it has also fallen everywhere else in the world — 2022 was peak inflation not just in the US, but in most countries — so we can’t judge the success of the program based on that alone.

Instead, we can look at internationally comparable data on food spending, which comes from the USDA’s Economic Research Service. Our World in Data has a nice chart based on this data, and even though it is now two years out of date (I will provide 2025 data below), the 2023 data makes a case against the success of the “price controls” in Mexico (I put “price controls” in quotes because it is not a true price control, but an attempt to control prices via incentives):

Figure 1

It will probably not surprise you that the US spends much less on food as a percent of total spending than Mexico, given that we are a high-income country. But it is still worth pointing out just how low food spending is in the US. However, this chart still paints Mexico in a very poor light: for countries with about the same income level in the Americas (as measured by consumer expenditures), Mexicans spend much more on food than Argentina, Chile, or Panama.

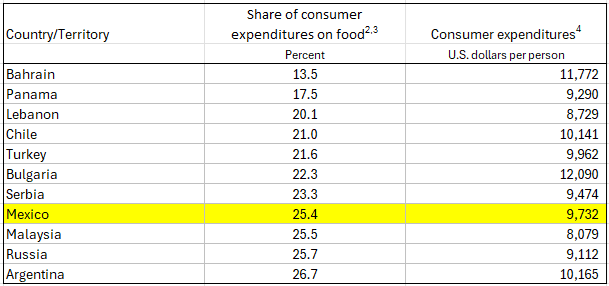
If we use the 2025 USDA data, and focus on the 10 countries with consumption expenditure closest to Mexico (between about $8,000 and $12,000 of consumption), we see that Mexico is very much on the high end: only Argentina was clearly higher:

Table 1

Finally, we can compare Mexico against itself in this data, looking at food spending going back to 2017:

Figure 2

Food spending actually peaked in 2020, though be cautious of any data from 2020 as the pandemic made data collection difficult. After declining in 2021 and then into 2022 (the policy seems to have been put in place in mid-2022), there haven’t been any further declines. And food spending is still well above pre-pandemic levels (unlike the US, where the 2025 figure of 6.4% is the same as 2017-18).

Ultimately, we would want a more sophisticated analysis than my simple tables and charts here. But it doesn’t appear that Mexico’s 2022 policy really made food much more affordable, either relative to peer countries with similar income levels, or relative to Mexico’s own recent history. And that’s even before we get into any unintended consequences of the “price controls.” Of course, the policy may have made that basic basket of two-dozen items more affordable than it otherwise might be — for that we would need to compare individual item prices to peer countries — but it hasn’t obviously made food overall more affordable in Mexico."

Asian females out earning white males

From Mark Perry. Excerpt:

"Asian women have out-earned White men in each of the last 12 quarters over the last three years. In the most recent quarter (2026:Q3), White men earned only 92.6 cents for every $1 earned by Asian women, a GENDER/RACE EARNINGS GAP of 7.4% favoring Asian women."  

May be an image of text 


Friday, October 23, 2026

Income-based Ginis exceed consumption-based ones by 4.7 points on average globally, and by as much as 10 points in some regions

Lidia Ceriani and Paolo Verme. 

Abstract: The Gini index remains the most important measure of economic inequality worldwide, and accurate estimates of this index are essential for effective public policies. Yet, Gini estimates for the same country and year vary considerably across data sources, a problem that remains largely unresolved. The paper reviews the largest global and regional databases providing Gini estimates, surveys the related literature, and constructs a unified dataset of 122,351 Gini observations spanning 222 countries and territories and 158 years, from 1867 to 2024. The analysis of this new dataset shows that income-based Ginis exceed consumption-based ones by 4.7 points on average globally, and by as much as 10 points in some regions, with these gaps widening over time. The gross--net income distinction and the use of alternative equivalence scales together with several other measurement choices add further systematic differences. Based on these findings, the paper provides correction factors that can be used to harmonise Ginis built on different welfare concepts. We further show that overall divergence across databases has grown only modestly since 1960, and mainly through the proliferation of databases rather than through genuine divergence among long-standing sources. Thus, improving on the existing discrepancies across Ginis globally is possible, but ultimately depends on database administrators disclosing full details of Gini construction and on users selecting Ginis built on comparable measures.

A Health Economist Regrets Supporting the ACA

By Michael F. Cannon.

"Dana Goldman is a top-notch health economist and the founding director of the University of Southern California’s Schaeffer Institute for Public Policy and Government Service. On October 22, he published a courageous and eye-opening mea culpa that everyone should read:

In November 2009, I joined 10 other economists in a letter urging Congress to pass a bill that became the Affordable Care Act. I could hardly imagine what would come next.

The ACA promised to expand coverage, and it did. But I signed the letter primarily because the ACA promised to “bend the cost curve” of American health care, which was getting out of control.…

The curve did not bend, and I now wish I hadn’t signed my name to that letter.

Why did Obamacare fail to contain costs?

I, and many of my economist colleagues, didn’t foresee how many of the ACA’s cost-control and financing provisions would be stripped out by Congress, on a bipartisan basis, or watered down over the following decade.

That was true of many health economists. But many saw this coming. We warned the world as loudly as we knew how. In July 2009, I wrote:
… the administration agreed that the new subsidies would start flowing immediately, while the pay cuts would take effect over time. That means the pay cuts may never take effect at all: physicians have been blocking their own scheduled pay cuts for nearly a decade…
All [the industry deals] are contingent on the favored groups getting something they want, and all “savings” could be undone by future lobbying. To paraphrase George Bailey, the industry isn’t selling — the industry is buying.
In December 2009, when the ACA’s authors were drafting the financing provisions that Congress would later strip out, I wrote:
Senate Democrats promise to fund half of their new entitlement with $491 billion of Medicare cuts.…Congress frequently reneges on such promises. Want proof? At the very same time Congress is promising to cut future Medicare spending by $491 billion, it is reneging on a past promise to cut Medicare’s physician payments by $210 billion. Even Medicare’s chief actuary calls the (new) promised cuts “doubtful” and “unrealistic.”
In March 2010, I wrote:
… this legislation would set in motion political forces that would make additional spending inevitable. It would create new constituencies for government spending, hook existing constituencies on even more government spending, and promise implausible cuts in existing subsidies to constituencies that are highly organized and vocal.

I made similar points in 2010 (here, here, here, here, here, here, and here), 2011 (here, here, here, here, here, and here), 2012 (here, here, and here), and 2013 (here, here, here, here, here, here, here, here, here, and here).

In 2011, when I was trying to prevent the spigot from opening, I explained that the dynamic behind these predictions is something economists have known about for some time:
The measure repealing the 1099 mandate may itself increase the deficit slightly. It will reduce federal tax collections by $17 billion, and the offsetting spending cuts are highly questionable. This vote’s real significance, however, is that it shows why ObamaCare’s entitlement spending would survive the political process while its revenue-raising provisions would not.…

When the political process “goes to work” on the rest of ObamaCare’s various provisions, the revenue-raisers will fall because they get the formula wrong, while the entitlement spending will survive because it gets the formula right.…

The 1099 mandate is actually the second ObamaCare revenue-raiser to fall. Worried about the political fallout from private insurers exiting the Medicare program, the Obama administration rather transparently forestalled cuts to Medicare Advantage by granting $1.3 billion of “quality-based” bonuses to mediocre and low-performing MA plans. 

This public-choice dynamic is why the Congressional Budget Office, the chief Medicare actuary, and even the International Monetary Fund have discredited the idea that ObamaCare will reduce the deficit. It is one of the principal reasons why, as Thomas Jefferson wrote, “The natural progress of things is for liberty to yield, and government to gain ground.” In other words, the game is rigged in favor of bigger government. 

It also explains why the Obama administration is sprinting to implement ObamaCare in spite of a federal court having struck down the law as unconstitutional. As that and similar cases work their way toward the Supreme Court, the White House needs to get some concentrated interest groups hooked on ObamaCare’s subsidies–fast.

If Goldman receives praise for admitting error, it will encourage others to do the same. If he receives scorn, it will have the opposite effect."

Thursday, October 22, 2026

Uncapping the Payroll Tax Would Raise the Top Marginal Tax Rate on Wages to Above 60 Percent in Some States

By Kyle Pomerleau of AEI.

"Social Security’s trust fund is nearing insolvency. The latest trustees report projects that the Old-Age and Survivors Insurance Trust Fund will run out in late 2032. If this occurs, benefits paid will be limited to payroll tax revenue, resulting in a roughly 22 percent benefit cut. Some lawmakers have suggested eliminating the payroll tax cap to help close the gap. This would raise revenue, but it would push top marginal tax rates on wages to over 60 percent in some states. 

Social Security is financed with a 12.4 percent payroll tax on employee wages and a matching tax on self-employment income. The tax is split evenly between the employee and employer. The payroll tax is “capped,” meaning that it applies only to the first $184,500 in wages and salaries (in 2026). 

Several proposals would eliminate or alter the cap. Two proposals would introduce a “donut hole” by applying the payroll tax to earnings above either $250,000 (Social Security Expansion Act) or $400,000 (Social Security 2100 Act). A proposal by Sens. Elizabeth Warren (D-MA) and Bernie Moreno (R-OH) would apply the payroll tax to all earnings. 

Eliminating the payroll tax cap would raise the top marginal tax rate on labor earnings. The top marginal tax rate is the combined federal, state, and local tax that a top earner pays on each additional dollar of wage and salary income. 

For example, a top earner in Massachusetts faces a top marginal tax rate of 49.5 percent. This includes the top individual income tax rate of 37 percent, the 2.9 percent Medicare payroll tax, the 0.9 percent Additional Medicare Tax, and Massachusetts’s top income tax rate of 9 percent.1 Eliminating the cap would raise the top marginal tax rate in the state by 8.7 percentage points to 58.2 percent. 

The top marginal tax rate would depend on where a taxpayer resides. The top marginal tax rate would rise to 63.1 percent in New York City, 63 percent in California, and 59.7 percent in Washington, DC. In states without an income tax, the top rate would rise to 49.4 percent. This would be the highest top marginal tax rate on wages since the Tax Reform Act of 1986.

Lawmakers should proceed with caution. 

First, higher top marginal tax rates reduce the incentive to work. This is because eliminating the cap would reduce the after-tax wage that an individual earns. For example, top earners in Washington, DC, would experience a 17.4 percent reduction in their after-tax wage rate if the cap were eliminated. Using the Congressional Budget Office’s estimate that the labor supply elasticity (or responsiveness) of high-income workers is 0.17 (net of the income effect), this would imply a reduction in hours worked of 3 percent for those facing the top marginal tax rate. 

Second, eliminating the cap would exacerbate the incentive for business owners to reclassify their income. Owners of partnerships and S corporations can split their income between profits and wages. The tax code creates an incentive to pay more income out as profits because profits are taxed at a top federal income tax rate of 29.6 percent (37 percent reduced by the 20 percent deduction for pass-through business income) compared to the top federal tax rate on wages of 40.2 percent. Eliminating the cap would widen that gap from 11 percentage points to 19.8 percentage points. 

Third, eliminating the cap would reduce revenue from other taxes. Because the employer-side payroll tax is borne by workers in the form of lower W-2 wages, raising it shrinks the base of the income and employee-side payroll tax. The Joint Committee on Taxation estimates that for each dollar raised by the payroll tax, the federal government collects only 86 cents. Furthermore, the reduction in hours worked would mean that total taxable income would fall, offsetting an even larger share of the initial tax increase. 

Finally, eliminating the cap would delink taxes from benefits. One of the virtues of the current Social Security system is that benefits and taxes are at least loosely linked. The more an individual works, the more they pay in payroll taxes, but also the more they accrue in future benefits, up to the cap. This limits the work disincentive effect because future benefits partly offset taxes at the margin. Eliminating the cap without expanding benefits would make the tax on earnings above the cap a pure tax, with no offsetting benefit. 

Lawmakers are right to be concerned about the future of Social Security. Reform will require changes to both spending and revenue. It matters, however, how those changes are structured. Eliminating the cap on the payroll tax would come with important economic trade-offs. 


[1] The top marginal tax rate is calculated on total labor compensation, including the employer-side payroll tax. Assumes Massachusetts’s paid family leave payroll tax remains capped."

Wednesday, October 21, 2026

Welcome to the New Era of AI Medicine

By David Galland. He is with The Rational Optimist Society. Excerpts:

"For three years, Courtney Hofmann’s young son Alex suffered pains no one could explain.

He chewed on things to cope with headaches. His gait changed, and he stopped growing. By the time he turned seven, he had been seen by 17 doctors and specialists, including pediatricians, neurologists, orthopedists, ENTs, and even dentists.

Every doctor followed the established protocols, ordering exams to test their latest theories, but ultimately none came up with a helpful diagnosis.

Finally, in desperation, Courtney pasted her son’s medical records into ChatGPT and asked for an opinion.

After engaging in a collaborative exchange about her son’s symptoms, ChatGPT came back with tethered cord syndrome, a rare condition in which the spinal cord is abnormally anchored to the surrounding tissue instead of floating freely. As Alex grew and his spine lengthened normally, the tethered cord was increasingly stretched.

ChatGPT results in hand, Courtney found a neurosurgeon who specialized in the condition. He confirmed the diagnosis, and Alex had the necessary surgery. Today, he’s fine.

And so we find ourselves on the cusp of a new era of medicine and healthcare where, for the price of a modest monthly subscription, a chatbot working from the same records as 17 medical professionals correctly diagnosed a complicated medical problem the experts had all missed.

In this Deep Dive, we’ll look at the astonishing progress AI is enabling across the very foundations of medicine, including disease diagnosis, drug development, and treatment.

As you’ll read, AI is almost certainly the most important development in human health since antibiotics.

And it’s happening right now, as you read this, which means we’ll be the beneficiaries of this healthcare revolution."

The current AI-driven progress in radically improved diagnosis and healthcare is the result of three fairly obvious developments unfolding at the same time:

Data digitization – Though privacy rules and fragmented systems still create roadblocks, today nearly all medical records and associated images have been digitized, creating a pool of trillions of data points available for analysis and, importantly, training AI.

Foundation Models – A single large model can now process text, images, genomes, and waveforms—such as those produced by an ECG—all at once. The latest AI models can read your medical history, review your charts, study your scans, and weigh your genetics, processing every input together in an analysis that happens in the blink of a proverbial eye.

Compute – The AIs powering today’s medical breakthroughs run on a level of computation that would have been prohibitively expensive—and perhaps impossible—just 15 years ago.

Put those three developments together, and you get . . . a near-superhuman diagnostician that can weigh your personal health data against a vast library of peer-reviewed research, massive clinical databases, and archives of medical images tied to known outcomes—and apply all of it in seconds."

"The first randomized controlled trial of AI in cancer screening involved nearly 106,000 women in Sweden. During the trial, radiologists, supported by an AI system called Transpara, detected 29% more breast cancers than using standard practices, with no increase in false positives.

Importantly, those results were produced while cutting screen-reading workload by 44%!"

"An observational study in Germany involving the routine screening of nearly half a million women found that radiologists using AI caught 17.6% more breast cancers than those not using it."

Tuesday, October 20, 2026

Some Progressives Tried To Abolish the Tipped Minimum Wage. Now They're Backtracking.

Policymakers across the country are confronting the unfortunate—and predictable—economic results of prohibiting restaurants from paying servers a lower base wage supplemented by tips

By C. Jarrett Dieterle of Reason. 

"In recent years, one of the predominant policy initiatives of the progressive left has been raising the minimum wage in locales around the country. At the same time, left-leaning politicians have sought the elimination of what's known as the tip credit, which allows employers to pay restaurant servers and other tipped employees a lower hourly base wage that they then bolster with gratuities.

Just a few years into this experiment, however, policymakers are showing signs of an about-face on the tip credit's abolition as they grapple with the unfortunate, and predictable, economic results.

In 2022, Washington, D.C., made news headlines when voters passed Initiative 82. As originally designed, it would have repealed the tip credit and required servers to be paid the District's full statutory minimum wage by 2027. (D.C.'s minimum wage was $16.10 per hour in 2022, but has since risen to $18.40 due to inflation indexation.) Prior to Initiative 82, D.C. servers could be paid a $5.35 tipped wage, so long as they earned enough tips to make up the difference between the lower tipped wage and the higher traditional minimum wage.

D.C.'s Initiative 82 was just the beginning. One Fair Wage, a progressive group that lobbies against subminimum wages, quarterbacked an all-out push to eliminate the tip credit in jurisdictions across America. Chicago became the second prominent city to follow suit. States like New York, Connecticut, and Illinois also quickly saw legislation introduced to eliminate the tip credit at a statewide level. (Apart from this recent wave, a small handful of American states—including California, Oregon, and Alaska—have long operated without a tip credit).

But just when it seemed like momentum against the tip credit had reached its apex, progressive politicians started to see the writing on the wall. In the aftermath of the tip credit's repeal, D.C. saw a close to 5 percent decline in full-service restaurant jobs. Tipped worker earnings also dropped by just under $12 million—likely a result, at least in part, of restaurants reducing hours for staff in the face of higher labor costs. At the same time, many D.C. restaurants began implementing service fees or so-called auto-gratuity policies that added mandatory 10-20 percent charges onto customers' bills.

Mugged by this economic reality, D.C. Mayor Muriel Bowser called for the full repeal of Initiative 82. Ultimately, the D.C. Council settled for a partial repeal in 2025, maintaining at least some semblance of a tipped wage that sits below the traditional minimum wage into the years ahead (although the tipped wage eventually rises to 75 percent of the traditional wage by 2034). This was a familiar story: The council had previously repealed Initiative 77, a near-identical attempt to abolish the tipped wage that voters passed in 2018.

After Chicago moved to eliminate the tip credit, the Illinois Restaurant Association found that 89 percent of Windy City restaurants raised menu prices; another 79 percent responded by reducing worker hours. Again bowing to economic reality, the progressive Chicago City Council voted to freeze the tip credit's planned elimination, only to see the effort vetoed by Mayor Brandon Johnson. Eventually, a compromise was brokered to at least pause the tip credit at its current level for two years—which punts the issue until after Johnson stands for election again, allowing a potential successor to endorse a more lasting reversal.

In Michigan, a 2024 state supreme court ruling set the tip credit on the path toward elimination by 2030. But state lawmakers intervened last year, deciding to maintain a 50 percent tip credit in perpetuity after 2031. Notably, Michigan is currently governed by a Democratic trifecta in the governorship and both houses of the Legislature. The tip credit's revival garnered key support from Republican lawmakers to pass in a bipartisan fashion, before being signed into law by Democratic Gov. Gretchen Whitmer.

While progressive efforts to eliminate the tip credit may be motivated by an earnest desire to ensure waiters are paid more, the math isn't that simple. Requiring a server to be paid a $16 traditional minimum wage—up from a $5 tipped wage—might appear to raise their pay on paper. But this fails to consider several important factors.

Under our "No Taxes on Tips" new normal, raising the minimum wage for servers could lead to a partial reduction in tips, which under certain scenarios can result in less take-home pay for waiters once the taxman takes his cut. If more server earnings come in the form of "auto-gratuity" policies—which are treated as taxed wages under the law—then the tax repercussions may grow even grimmer.

But more broadly, these laws attempt to subvert basic economics. As of 2025, Bureau of Labor Statistics data show that D.C. restaurants shed over 1,600 jobs in aftermath of Initiative 82; meanwhile, between 2022 and 2025, restaurant job growth in the District declined by more than 8 percent. This is just one example. The fallout is the inevitable result of restaurants responding to labor costs that suddenly skyrocket, forcing establishments to cut worker hours and sometimes transition to quick-service models that require less hourly staff. And that's to say nothing of the diners who bear the cost with higher prices and new service fees.

"We're watching a beloved bar back, a beloved busser, a dishwasher have their jobs taken away," D.C. restaurant worker Valerie Graham told Reason in 2024. "Not because our owner-operator is an evil billionaire but because they're an independent business owner who had to make some business decisions and there's a callousness with which our industry is talked about."

To be sure, the tip credit has only survived in modified and reduced form in D.C., Chicago, and Michigan—and in the case of Chicago, the about-face is only temporary. But the partial reversals show the tip credit's elimination is not a foregone conclusion. Economic reality continues to rear its head."