Showing posts with label natural resources. Show all posts

Tuesday, April 28, 2026

A Minnesota Mining Liberation Act

The GOP overturns a Biden rule that banned resource development

WSJ editorial. Excerpts:

"a Biden public land order that withdrew some 225,500 acres of land in the Superior National Forest in northern Minnesota from mining and other resource development."

"Expanding domestic critical mineral development ought to be a bipartisan cause as China seeks to weaponize its control of the supply chain. The Duluth Complex beneath Minnesota’s Superior National Forest boasts nearly eight billion tons of critical minerals" 

Thursday, July 17, 2025

Dixie Cups, CAFE Standards, and Numeracy (every increase in MPG standards saves less gas than the last one)

By David Henderson.

"The second use is more resource-saving  than the third.

At my cottage in Canada, I have running water from a pump in the lake but not safe water. So in what we call the “bath hut” I have a bottle of clean water from which I pour a little into a Dixie cup when I brush my teeth. After I’ve finished brushing, I swirl the toothbrush around in the Dixie cup water and then empty the water.

I used to throw away the Dixie cup immediately after, but when I had a friend visiting last week, I noticed that he reused his. So I started doing the same.

What I found, though, is that the cup lost a lot of resilience after the second use. So I started throwing the cups away after the second use.

Then my numerate mind went to work. I realized that getting the second use was more important than getting the third use. Why?

Here’s why. Imagine that I’m at my cottage for 18 days, which is approximately right. If I use each Dixie cup once, I use 36 (one in the morning and one in the evening.) If I use each cup twice, I use 18 of them, saving 18 Dixie cups. If I use each cup 3 times, I use 12 of them, saving an additional 6.


So the saving in resources from a second use is triple the saving in resources from a third use.

The point generalizes. What if I went for a fourth use? Then I would use 9 cups. The saving from the fourth use would be only 3 cups. And so on.

What’s the point?

There are really two points.

The first is the power of thinking on the margin. The next use, in going from 2 to 3 uses, is less resource-saving than in going from 1 to 2 uses.

The second relates to an issue I worked on when I was the senior economist for energy with President Reagan’s Council of Economic Advisers: the CAFE mandate. CAFE is short for Corporate Average Fuel Economy. The mandate was part of the Energy Policy and Conservation Act, a law that President Ford signed in 1975. It was an indirect result of the price controls on gasoline, imposed by Nixon and kept by Ford. People were facing an artificially low price of gasoline and, OMG, were acting as if they were facing an artificially low price of gasoline. They weren’t switching to fuel-saving cars as quickly or extensively as many government energy planners thought they should.

So rather than get rid of the price controls, Congress and the president came up with a requirement that each auto manufacturer, for a given model year, reach an average fuel economy of x miles per gallon, where x steadily ratcheted up over the years.

I had 2 bosses at the CEA, chairman Martin Feldstein and member William Niskanen. Bill and I would have liked to repeal CAFE but that wasn’t going to happen. So we argued against further increases and in favor of relaxing the standards.

We were unsuccessful.

But here’s an argument that I didn’t emphasize but should have. The fuel economy saving from moving from a mandate of, say, 20 mpg to a mandate of 22 mpg is greater than the fuel economy saving of moving from 22 to 24. Imagine that in the United States, people drive their 100 million cars an average of 10,000 miles, for a total of 1 trillion miles. With an average mpg of 20, they use 50 billion gallons of gas. If the mandate is raised to 22, they use 45.5 billion gallons, for a saving of 4.5 billion gallons. But if the mandate is raised from 22 to 24, they use 41.7 billion gallons, for an extra saving of 3.8 billion gallons. If the mandate is raised from 24 to 26, they use 38.5 billion gallons, for an extra saving of 3.2 billion gallons. Notice that, just as with Dixie cups, each increment of required mph saves less gasoline than the previous increment.

I’m assuming away behavioral effects. The so-called rebound effect is that with higher mandate fuel economy, the price of an extra mile falls, and so people will drive more miles. But this assumption doesn’t hurt my reasoning because with each increment of mandate mpg, the rebound effect attenuates also.

So this is one of the things a microeconomist who studies regulation does on his vacation. Oops. I’m in Canada. Not vacation, but holiday."

Friday, June 20, 2025

Unhinged Reactions: Federal Lands Edition

By Stephen Slivinski of Cato.

"There are a few safe bets on outrageous online reactions to proposed government policies. Unhinged hyperventilation over very modest proposals to sell federal land seems to be one of them.

A recent proposal by the Senate Committee on Energy and Natural Resources directs the Bureau of Land Management and the Forest Service to auction off a combined 1 to 1.5 percent of federally owned land to private owners for the express purpose of building new housing in 11 western states.

To see the overheated reaction from opponents, you’d think the committee was proposing to build casinos along the rim of the Grand Canyon and Olive Gardens in Yellowstone. There was pearl-grasping over the perceived acreage (“It’s equal to the size of Connecticut!”) and revulsion over transferring ownership rights of federally owned land to private owners (“This land is our birthright!”).

The proposal is indeed modest: as noted already, it’s no more than 1.5 percent of what is currently federally owned land in 11 of the 20 largest states in the US. Together, those states equal 1.7 million square miles. Tiny Connecticut amounts to 0.3 percent of that 11-state landmass.

Assuming the feds max out this allotment (which they are not required to do), there’s a rather lengthy multi-year process to sell the land, including getting approval from the state and local governments (including tribal governments if applicable) where each parcel is located. 

And that’s the big myth in all of this: these are not beautiful national parks with breathtaking vistas. This is mostly land in the hands of the Bureau of Land Management, the agency that oversees the purchase and management of land that, when the bureau was created in 1946, was described as “the land nobody wanted.”

Plus, the land has to be deemed suitable for housing development, specifically, as determined by the aforementioned process and prioritizing attributes such as being adjacent to already developed areas and having access to existing infrastructure.

This isn’t the first time such a proposal has been put forward—or, for that matter, been enacted. There’s a version of this that has already been in place in the geographic zones along the outskirts of Las Vegas for most of the past 30 years. That one was also designed specifically to increase the land available to build new housing, and, unlike this proposal, which requires the land to be sold at market price, that land was to be sold at a discount.

The author of that proposal? Well-known fire-breathing free-market radical Sen. Harry Reid (D‑NV).

Friendly reminder: Cato’s been on this case for quite some time." 

Monday, May 19, 2025

China’s Rare Earths Aren’t as Rare as You Think

When the country tried to choke off supply of the metals before, the world found ways to adapt

By Marian L. Tupy of Cato. Excerpts:

"China produces about 61% of rare-earth minerals, and it processes 92%."

"Fifteen years ago, following a dispute with Tokyo over contested waters, China imposed a rare-earth embargo on Japan, while cutting its rare-earth export quotas to the rest of the world by 40%."

"Prices of the rare-earth metals spiked, with cerium soaring from $4.15 a kilogram in January 2010 to $150.55 in July 2011."

"Market mechanisms undermined China’s attempt at resource leverage. In the early 2010s, supply growth outside China accelerated. Projects already in development by Molycorp in California and Lynas in Australia ramped up, adding tens of thousands of metric tons of production capacity. By 2014 China’s market share of rare earths had fallen from more than 90% to about 70%.

China’s export quotas also proved surprisingly porous. Producers exploited loopholes by shipping minimally processed alloys exempt from restrictions, while an estimated 15% to 30% of production was smuggled through neighboring countries. Beijing’s inability to police thousands of small miners fatally undercut its embargo."

"Refineries temporarily substituted alternative catalysts, and magnet producers optimized alloys to use less rare-earth material, some even switching entirely to new technologies. This “demand destruction” blunted the crisis’ effect even before new supplies could fully come online. Prices that had spiked in 2011 quickly retreated to pre-crisis levels."

"the U.S. defense industry has reduced its reliance on rare earths to a minimum (the equivalent of less than 0.1% of global demand), and weapons programs maintain inventories to buffer temporary supply disruptions."

"rare earths are quite abundant. Cerium is the 25th most common element on Earth. At 68 parts per million of Earth’s crust by weight, it is more abundant than copper. Rare earths are “rare” because of geochemical dispersion. They tend to remain evenly mixed rather than found in their pure form."

Wednesday, April 23, 2025

Earth was 518.4 percent more abundant in 2024 than it was in 1980

See The Simon Abundance Index 2025 by Gale L. Pooley & Marian L. Tupy. Excerpts:

"The Simon Abundance Index (SAI) measures the relationship between resource abundance and population. It converts the per capita abundance of 50 basic commodities and the size of the global population into a single value. The index began in 1980 with a base value of 100. In 2024, the SAI stood at 618.4, indicating that resources have become 518.4 percent more abundant over the past 44 years. All 50 commodities in the dataset were more abundant in 2024 than they were in 1980. The global abundance of resources increased at a compound annual growth rate of 4.22 percent, thus doubling every 17 years."

"The SAI is based on the ideas of Julian Simon, a University of Maryland economist and Cato Institute senior fellow who pioneered research and analysis of the relationship between population growth and resource abundance. If resources were truly finite, as many people believe, an increase in population would be expected to lead to scarcity and higher prices. However, as Simon discovered through exhaustive research spanning decades, the opposite was true. As the global population increased, resources tended to become more abundant."

"How is that possible? Simon recognized that atoms, without knowledge, have no economic value. Knowledge transforms atoms into resources—and the supply of undiscovered knowledge is limitless. He also understood that only humans can discover and create new knowledge. Therefore, resources can be effectively infinite, and humans are the ultimate resource.

Consider this example. Before the 19th century, agriculture relied heavily on manure for fertilization, limiting crop yields due to its low nitrogen content. As populations grew, farmers sought more potent alternatives. In the early 1800s, guano—bird droppings rich in nitrogen, phosphorus, and potassium—was discovered on islands off the coast of Peru. Its extraordinary effectiveness led to a global guano trade boom, fueling industrial agriculture in Europe and America. By the late 19th century, however, supplies started to dwindle.

The breakthrough came in the early 20th century with the Haber–Bosch process, developed by the German chemists Fritz Haber and Carl Bosch. This method allowed for the synthetic fixation of atmospheric nitrogen into ammonia, producing fertilizer on an industrial scale. It decoupled food production from natural nitrogen sources, revolutionizing agriculture and enabling the rapid expansion of global populations. It is estimated that without synthetic fertilizer, the planet’s food production would be able to support only four billion rather than eight billion people.

Individual Commodity Changes Between 1980 and 2024

The SAI uses “time prices” to measure changes in relative abundance. Time prices tell you how long you must work to earn enough money to buy something. As long as you work less time this year than last year to afford something, your standard of living is rising. Time prices are a simple and intuitive way to compare the true cost of things.

Time prices for individual commodities decreased, on average, by 70.4 percent between 1980 and 2024, ranging from −2.9 percent for oranges to −85.2 percent for lamb. That means that the average inhabitant of the planet saw their personal resource abundance increase by 238.1 percent, ranging from 2.9 percent for oranges to 573.6 percent for lamb. Put differently, the same length of work that allowed the average inhabitant of the planet to purchase 1 unit in our basket of 50 commodities in 1980 allowed him or her to buy 3.381 units in 2024.

To continue with our fertilizer example: Since 1980, the time price of fertilizer has fallen by 56.4 percent. The same length of work that allowed the average inhabitant of the planet to purchase 1 unit of fertilizer in 1980 allowed him or her to buy 2.2 units in 2024, an increase of 120 percent.

Finally, the SAI is calculated by multiplying personal resource abundance by population size. As noted, between 1980 and 2024, personal resource abundance increased by 238.1 percent. Over this same period, the global population increased by 82.9 percent, rising from 4.444 billion to 8.126 billion. The relevant equation is:

SAI = (1 + percentage change in population) x (1 + percentage change in personal resource abundance) x 100
SAI = 1.829 x 3.381 x 100
SAI = 618.4"

Monday, March 10, 2025

How central planning ruined forests

See ‘In Praise of Floods’ Review: Let the River Run by Timothy Farrington. He reviewed the book In Praise of Floods: The Untamed River and the Life It Brings by James C. Scott. Excerpt:

"In the late 1700s, Scott recounted, German officials set out to rationalize timber production. They replaced the thickety labyrinths of natural forests with uniform rows of single species. Yields went up, and the model spread across the wooded world. Then, a few decades on, the forests began to wither. The fertility of the soil, it turned out, had been sustained by a web of species and processes neglected by the technocrats. As Scott couldn’t resist quipping, the “utilitarian state could not see the real, existing forest for the (commercial) trees.”"

Monday, January 20, 2025

California’s Climate Time for Choosing

Sacramento tilts at reducing temperatures while its cities burn from failure to adapt to a variable climate

WSJ editorial. Excerpts:

"The evidence doesn’t support the climate explanation since (among other reasons) California has had a dry climate and Santa Ana winds, even with hurricane-force gusts on occasion, for centuries. If the Democrats who run the state believe their own advertising, why not spend money in useful ways rather than on a green-energy transition to nowhere?"

"Donald Trump in particular is blaming Gov. Gavin Newsom for scrapping his first-term plan to ease fish protections to let more water flow from the north to farmers and cities in Southern California. He’s half right."

"The state never has enough to go around because much of the Sierra Nevada snowpack . . . gets flushed out to the Pacific Ocean rather than stored for dry years."

"Mr. Trump is right that the species protections he cited are largely to blame"

"But increasing water flows from northern California wouldn’t have helped firefighters in L.A. since the problem there was an overwhelmed local water system."

"renovating the water system to bolster its firefighting capacity is costly."

"If fires are going to be more common, then overhauling water systems will be essential. But governments have limited resources and need to set priorities. And California’s politicians—state and local—prefer to spend money on income transfers and green subsidies"

"Democrats have in particular given priority to reducing CO2 emissions over mitigating the effects of a variable climate. The state’s renewable-energy mandates have forced Pacific Gas & Electric Co. to spend heavily on wind, solar and battery power, at the expense of upgrading its aging power lines that have sparked some of the state’s most catastrophic fires."

"the state spends more on “fighting” climate change than preparing for it."

"The Governor’s budget last year included $2.6 billion for “forest and wildfire resilience”—far less than the $14.7 billion provisioned for zero-emission vehicles and its “clean energy” transition. California’s $100 billion bullet train and offshore wind turbines will do nothing to prevent fires or protect communities. Rooftop solar subsidies are no consolation for people who lose their homes."

"nothing California does to subsidize EVs or punish fossil fuels will have any effect on global temperature. Its CO2 emission reductions are dwarfed by increases elsewhere"

Thursday, April 18, 2024

Conservation Through Capitalism

By Kevin Corcoran of Econlib.

"I recently stumbled across a news story that highlights something about capitalism and the profit motive that is underappreciated by the very people who most loudly clamor for it – the conservation of resources. Capitalism doesn’t merely incentivize maximizing output – it also incentivizes minimizing the use of inputs as well. If you want to conserve resources, capitalism and the profit motive are your best friends. 

The story in question describes how the publishing company HarperCollins reduced the amount of paper they use to publish their books, as a result of making numerous “subtle, imperceptible tweaks” to the font and layout of the pages. The efforts first began in their Christian publishing division, where making these adjustments resulted in 350 fewer pages being needed per Bible, which in 2017 alone resulted in over 100 million fewer pages needed – four times the height of the Empire State Building, according to the story. 

HarperCollins sought to use these innovations across all of their publishing lines and put quite a lot of effort into it. There were a number of factors that had to be considered and counterbalanced against each other:

The team got to work. They tested their theories with a large book in their catalog—more than 600 pages—by creating 50 versions of it using different fonts. HarperCollins uses a wide range of off-the-shelf fonts in its books, rather than custom ones. As the team ran the experiments, they observed that some fonts were more compact, resulting in fewer total pages, while remaining easy to read.

…In the end, the designers found that clever font selection, coupled with a thoughtful layout design that reduced white space, resulted in more words per page…And when you place them side by side, the differences are imperceptible.

And what’s been the payoff for all this effort? The report tells us that “these subtle, imperceptible tweaks have saved 245.6 million pages, equivalent to 5,618 trees.” The other payoff, of course, is that these changes have “cut HarperCollins’s printing costs.” 

One might want to dismiss this as no big deal. While 5,600 trees might seem like an impressive number, how big is it really? After all, there are more trees on Earth than there are stars in the entire galaxy! In light of that, isn’t 5,600 trees kind of small potatoes? Yes, but at the same time, that actually strengthens the point I want to make! The market provides strong incentives to find and implement every feasible option to reduce and minimize the resources needed in production. If there is some means available to reduce resource usage by even a tiny amount, someone out there is looking for it, and will find and implement it. By contrast, can you imagine any government agency putting teams to work engaging in similarly intensive efforts to ensure they are using only the minimum amount of resources necessary? 

The difference is that capitalism and market discipline provide a very different institutional structure and set of incentives – incentives that are absent from government agencies. And because of this difference in incentives, market actors will take much greater care to conserve and reduce resource usage than state actors. So if your goal is the conservation of resources, be glad that markets exist – and cheer for them to expand."

Thursday, January 11, 2024

How Malthus Got It Wrong

By David Henderson.

"Something that seems obvious if you think about it for a minute is that a growing population pushing on a finite planet means that resources will become pricier and people will become, on average, poorer. In 2019, Bill Maher, for example, who most people, including me, think is a smart person, stated, “In 1900, there were less [sic] than two billion people on Earth; now it’s approaching eight. We can’t just keep on like this. The world is just too crowded.” He went on to propose that we “not have kids, die, and stay dead.” Maher is a 21st-century Malthusian. Thomas Robert Malthus, recall, was the person who wrote the famous 1798 Essay on the Principle of Population, in which he argued that food production grows arithmetically while population tends to grow geometrically. Malthus did more thinking than Maher, by the way. The fact that Britain didn’t have widespread starvation was what led Malthus to examine the ways people did check their tendency to multiply. But Malthus did not foresee what actually happened: huge increases in standards of living for a much greater population.

Fortunately, we can think about this issue for much more than a minute. And our thinking can be informed not just by gut feelings but also by basic economic thinking about progress and by a vast economic history. It can also be informed by knowledge of a famous bet about resources. And the bottom line of all this thinking and economic history is that the vast majority of resources, especially those sold in relatively free markets, have become more plentiful relative to population.

These are the opening paragraphs of my latest article for Hoover, “How Malthus Got It Wrong,” Defining Ideas, January 11, 2024.

Another excerpt:

In their article, Blackman and Baumol give some striking data on five minerals: tin, copper, iron ore, lead, and zinc. They show world reserves in 1950, world production between 1950 and 2000, and reserves in 2000. If we were running out of ihose resources, all of the reserves should have been smaller in 2000 than in 1950. In fact, all were larger. The case of iron ore is the most striking. In 1950, there were 19 billion metric tons. Between 1950 and 2000, 37.6 billion metric tons of iron ore were produced, which was more than the number of tons to begin with. By 2000, world reserves were 140 billion metric tons, over seven times as many as in 1950!"

Sunday, May 21, 2023

Nicholas Kristof says we should let the market allocate water

See When One Almond Gulps 3.2 Gallons of Water. Excerpts:

"One study found that 88 percent of water in 17 Western states was used by agriculture. Only 7 percent was consumed by homes."

"California produces a bounty of almonds, which gulp about 3.2 gallons of water for each almond, according to a 2019 study."

"A central problem is that water isn’t allocated by market price but inefficiently through a muddle of irrigation rights that were mostly awarded on a first-come-first-serve basis. This water is so cheap that there is little attempt to conserve or develop technical innovations to use less water.

Many of the shortages would disappear if water were rationed the way goods normally are in a market economy, by price: Farmers would not irrigate almond orchards if they had to buy 3.2 gallons of water at market rates to produce each almond.

Mostly we’re a market economy, but water allocation resembles a 1970s Soviet system, with the same lack of price signals and consequently the same inefficiency. Any rationalization of the system and raising of irrigation costs would be wrenching — consider a farm family that has gone into debt to plant a large almond orchard — but there is no other sensible path forward."

Wednesday, May 10, 2023

Human beings are intelligent animals who innovate their way out of shortages

See The Oldest Mistake in Economics: Chile nationalizes its lithium reserves, in another sign of Latin America’s left turn by Mary Anastasia O’Grady. Excerpt:

"“Human beings are intelligent animals who innovate their way out of shortages, real and imagined,” the Cato Institute’s Marian Tupy wrote in 2018 in reference to alarms set off by China’s dominance of rare-earth minerals. The national-security crisis predicted by New York Times columnist Paul Krugman and others hasn’t happened because the market has produced searches for new deposits and substitutions, Mr. Tupy explained.

But let’s suppose that lithium is the silver bullet for humanity that Mr. Boric describes. A second problem is the unlikely assumption that state ownership is the best way to capitalize on it.

There are currently two companies mining lithium in Chile: Sociedad Química y Minera de Chile (SQM) and Charlotte, N.C.-based Albemarle Corp. (ALB). Mr. Boric has said that their concessions—expiring in 2030 and 2043, respectively—will remain in place. But he also said that he hopes the companies will work with the state before those expiration dates, which sounds like they’ll be pressured to do so.

When those concessions expire, and for any new entrants in lithium, only minority ownership by private investors will be permitted. The state will become the 51% owner of the business. The day after the Boric speech, SQM shares lost nearly 20% while ALB was off almost 10%.

The government says that minority partners will put up capital and know-how to explore and exploit Chile’s lithium reserves and the Chilean state will provide “financing.” But the Associated Press reported on April 21 that “it remains unclear whether the government would contribute capital in direct proportion to its ownership stake.”"

Monday, January 30, 2023

Shift to Mined vs. Man-Made Graphite Raises Shortage Risk for EVs

Natural graphite is greener than synthetic, leading auto makers to turn to mines for the mineral

By Scott Patterson and Amrith Ramkumar of The WSJ. Excerpts:

"Mining companies are ramping up supplies of critical minerals for rechargeable batteries such as lithium, cobalt and nickel. Graphite, a key battery component, has largely been overlooked. 

That is about to change. Some of the world’s biggest auto and battery makers and the U.S. government are racing to secure graphite supplies amid looming signs of shortages of the mineral suitable for batteries. So far graphite prices haven’t reflected the tight supply. 

“Graphite always seems to be the forgotten battery material, yet it’s in half the battery,” said Brent Nykoliation, executive vice president of NextSource Materials Inc., which is developing a graphite project in Madagascar. “It’s the largest raw material in the battery.”

Graphite is unusual among materials seen as crucial for the energy transition because it can be man-made as well as mined. Most lithium-ion batteries use synthetic graphite, which is produced from a petroleum byproduct, mostly in China.

But using an energy-intensive, high-emissions process to produce graphite defeats the purpose of the batteries that power EVs and store renewable energy. The production of synthetic graphite can be four times more carbon intensive than that of natural graphite, according to Benchmark Mineral Intelligence, which tracks the battery supply chain. 

As battery and auto makers look to reduce carbon emissions in their supply chains, more are looking to natural graphite, analysts say. The problem: The increase in demand is running headlong into a supply shortage. By 2030, natural graphite is projected to have among the largest supply shortfalls of battery materials, with demand outstripping expected supplies by about 1.2 million metric tons, according to Benchmark."

"Turning to supplies in unstable parts of the world has its own issues. Some analysts have raised concerns that the mine in Mozambique is near a conflict area where attacks by Islamic rebels have fueled a humanitarian crisis."

Friday, January 21, 2022

The Simon Abundance Index 2021

The Earth was 608 percent more abundant in 2020 than it was in 1980.

By Gale Pooley and Marian L. Tupy.

"Does population growth lead to greater resource scarcity, as argued by the English scholar Thomas Malthus and, more recently, by the Stanford University biologist Paul Ehrlich? Or does population growth make resources more abundant, as argued by the University of Maryland economist Julian Simon? The Simon Abundance Index measures the relationship between population growth and the abundance of 50 basic commodities, including food, energy, materials, minerals, and metals.

Main findings:

Global resource abundance increased by 5.9 percent in 2020, according to the 4th annual Simon Abundance Index. The base year of the index is 1980, and the base value of the index is 100 percent. In 2020, the index reached 708.4 percent. In other words, the index rose by 608.4 percentage points over the last 40 years, implying a compound annual growth rate in resource abundance of around 5 percent and doubling of global resource abundance every 14 years or so.

Figure 1: The Simon Abundance Index (1980-2020)

Source: The Simon Project

Analysis:

The Simon Abundance Index is measured in time prices. To calculate a commodity’s time price, the nominal price of a commodity is divided by the global average nominal hourly wage. Over the last 40 years, the average nominal price of the 50 commodities rose by 51.9 percent, and the global average nominal hourly wage rose by 412.4 percent. So, the average time price of the 50 commodities fell by 75.2 percent.

The personal resource abundance multiplier is calculated by dividing the average time price of the 50 commodities in 1980 by the average time price of the 50 commodities in 2020. The multiplier tells us how much more of a resource a person can get for the same hours of work between two points in time. We find that the same hours of work bought one unit in the basket of 50 commodities in 1980 and 4.03 units in the same basket in 2020.

The average inhabitant of the planet’s personal resource abundance rose by 303 percent. The compound annual growth rate in personal resource abundance amounted to 3.55 percent, implying that personal resource abundance doubled every 20 years.

Over the last 40 years, the average time price of the 50 commodities fell by 75.2 percent, and the world’s population increased by 75.8 percent. So, for every one percent increase in the world’s population, the average time price of the 50 commodities decreased by almost one percent (i.e., -75.2 percent ÷ 75.8 percent = -0.992 percent).

Note that the personal resource abundance analysis looks at resource abundance from the perspective of an individual human being. The question that we aim to answer is: “How much more abundant have resources become for the average inhabitant of the planet?”

Population resource abundance analysis, in contrast, allows us to quantify the relationship between global resource abundance and global population growth – a question that’s central to the disagreement between Malthus and Ehrlich on the one hand and Simon on the other hand. 

You can think of the difference between the two levels of analysis by using a pizza analogy. Personal resource abundance measures the size of a slice of pizza per person. Population resource abundance measures the size of the entire pizza pie.

The population resource abundance multiplier is calculated by multiplying the change in personal resource abundance with the change in global population (i.e., 4.03 x 1.758). The multiplier of 7.08 corresponds to the 708.4 percent increase in Simon Abundance Index. It indicates an increase in the global resource abundance of 608.4 percent at a compound annual growth rate of around 5 percent. As such, we estimate global resource abundance doubles every 14 years or so.

Figure 2: Visualization of the relationship between global population growth and the abundance of the 50 basic commodities (1980-2020)

Source: The Simon Project

Finally, let us say a few words about the resource abundance elasticity of population. In economics, elasticity measures one variable’s sensitivity to a change in another variable. If variable X changes by 10 percent, while variable Y, as a result of the change in X, changes by 5 percent, then the elasticity coefficient of X relative to Y is 2.0 (i.e., 10 ÷ 5). A coefficient of 2.0 can be interpreted as a two percent change in X corresponding to a one percent change in Y.

We found that every one percent increase in population corresponded to an increase in personal resource abundance (i.e., the size of the slice of pizza) of 4 percent (i.e., 303 ÷ 75.8). We also found that every one percent increase in population corresponded to an increase in population resource abundance (i.e., the size of the pizza pie) of 8.03 percent (608.5 ÷ 75.8).

Conclusion:

We found that humanity is experiencing what we term Superabundance – a condition where abundance is increasing at a faster rate than the population is growing. Data suggests that additional human beings tend to benefit, rather than impoverish, the rest of humanity. That vindicates Julian Simon’s observation that:

There is no physical or economic reason why human resourcefulness and enterprise cannot forever continue to respond to impending shortages and existing problems with new expedients that, after an adjustment period, leave us better off than before the problem arose.… Adding more people will cause [short‐​run] problems, but at the same time there will be more people to solve these problems and leave us with the bonus of lower costs and less scarcity in the long run.… The ultimate resource is people—skilled, spirited, and hopeful people who will exert their wills and imaginations for their own benefit, and so, inevitably, for the benefit of us all.

Figure 3: Changes in the time prices and the abundance of the basic 50 Commodities (1980 to 2020).

Source: The Simon Project

Table 1: Detailed view of the changes in the time prices and the abundance of the basic 50 commodities (1980 to 2020)

Source: The Simon Project

Professor Gale L. Pooley teaches economics at Brigham Young University, Hawaii. He is a Senior Fellow at the Discovery Institute and a board member of HumanProgress.org

Marian L. Tupy is a senior fellow in the Cato Institute’s Center for Global Liberty and Prosperity and editor of HumanProgress.org."

Wednesday, July 21, 2021

Resilience, not collapse: What the Easter Island myth gets wrong

By Jennifer Micale of SUNY-Binghamton.

"You probably know this story, or a version of it: On Easter Island, the people cut down every tree, perhaps to make fields for agriculture or to erect giant statues to honor their clans. This foolish decision led to a catastrophic collapse, with only a few thousand remaining to witness the first European boats landing on their remote shores in 1722.

But did the demographic collapse at the core of the Easter Island myth really happen? The answer, according to new research by Binghamton University anthropologists Robert DiNapoli and Carl Lipo, is no.

Their research, “Approximate Bayesian Computation of radiocarbon and paleoenvironmental record shows population resilience on Rapa Nui (Easter Island),” was recently published in the journal Nature Communications. Co-authors include Enrico Crema of the University of Cambridge, Timothy Rieth of the International Archaeological Research Institute and Terry Hunt of the University of Arizona.

Easter Island, or Rapa Nui in the native language, has long been a focus of scholarship into questions related to environmental collapse. But to resolve those questions, researchers first need to reconstruct the island’s population levels to ascertain whether such a collapse occurred and, if so, the scale.

“For Rapa Nui, a big part of scholarly and popular discussion about the island has centered around this idea that there was a demographic collapse, and that it’s correlated in time with climate changes and environmental changes,” explained DiNapoli, a postdoctoral research associate in environmental studies and anthropology.

Sometime after it was settled between the 12th to 13th centuries AD, the once-forested island was denuded of trees; most often, scholars point to human-prompted clearing for agriculture and the introduction of invasive species such as rats. These environmental changes, the argument goes, reduced the island’s carrying capacity and led to a demographic decline.

Additionally, around the year 1500, there was a climactic shift in the Southern Oscillation index; that shift led to a dryer climate on Rapa Nui.

“One argument is that changes in the environment had a negative impact. People see that there was a drought and said, ‘Well, the drought caused these changes,’” said Lipo, a professor of anthropology and environmental studies and associate dean of Harpur College. “There are changes. Their population changes and their environment changes; over time, the palm trees were lost and at the end, the climate got drier. But do those changes really explain what we’re seeing in the population data through the radiocarbon dating?”

Reconstructing population changes

Archaeologists have different ways to reconstruct population sizes using proxy measures, such as looking at the different ages of individuals at burial sites or counting ancient house sites. That latter measure can be problematic because it makes assumptions as to the number of people who live in each house, and whether the houses were occupied at the same time, DiNapoli said.

The most common technique, however, uses radiocarbon dating to track the extent of human activity during a moment in time, and extrapolating population changes from that data. But radiocarbon dates can be uncertain, DiNapoli acknowledged.

For the first time, DiNapoli and Lipo have presented a method that is able to both resolve these uncertainties and show how changes in population sizes relate to environmental variables over time.

Standard statistical methods don’t work when it comes to linking the radiocarbon data to environmental and climate changes, and the population shifts connected with them. To do so would involve estimating a “likelihood function,” which is currently difficult to compute. Approximate Bayesian Computation, however, is a form of statistical modeling that doesn’t require a likelihood function, and thus gives researchers a workaround, DiNapoli explained.

Using this technique, the researchers determined that the island experienced steady population growth from its initial settlement until European contact in 1722. After that date, two models show a possible population plateau, while another two models show possible decline.

In short, there is no evidence that the islanders used the now-vanished palm trees for food, a key point of many collapse myths. Current research shows that deforestation was prolonged and didn’t result in catastrophic erosion; the trees were ultimately replaced by gardens mulched with stone that increased agricultural productivity. During times of drought, the people may have relied on freshwater coastal seeps.

Construction of the moai statues, considered by some to be a contributing factor of collapse, actually continued even after European arrival.

In short, the island never had more than a few thousand people prior to European contact, and their numbers were increasing rather than dwindling, their research shows.

“Those resilience strategies were very successful, despite the fact that the climate got drier,” Lipo said. “They are a really good case for resiliency and sustainability.”

Burying the myth

Why, then, does the popular narrative of Easter Island’s collapse persist? It likely has less to do with the ancient Rapa Nui people than ourselves, Lipo explained.

The concept that changes in the environment affect human populations began to take off in the 1960s, Lipo said. Over time, that focus became more intense, as researchers began to consider changes in the environment as a primary driver of cultural shifts and transformations.

But this correlation may derive more from modern concerns with industrialization-driven pollution and climate change, rather than archaeological evidence. Environmental changes, Lipo points out, occur on different time scales and in different magnitudes. How human communities respond to these changes varies.

Take a classic example of the overexploitation of resources: the collapse of the cod fisheries in the American Northeast. While the economies of individual communities may have collapsed, larger harvesting efforts simply switched to the other side of the world.

On an isolated island, however, sustainability is a matter of the community’s very survival and resources tend to be managed conservatively. A misstep in resource management could lead to tangible, catastrophic consequences, such as starvation.

“The consequences of your actions are immediately obvious to you, and everyone else around you,” Lipo said.

Lipo acknowledged that proponents of the Easter Island collapse story tend to see him as a climate-change denier; that’s emphatically not the case. But he cautioned that the ways ancient peoples dealt with climate and environmental changes aren’t necessarily reflective of current global crises and their impact in the modern world. In fact, they may have a good deal to teach us about resilience and sustainability.

“There’s a natural tendency to think that people in the past aren’t as smart as we are and that they somehow made all these mistakes, but it’s really the opposite,” Lipo said. “They produced offspring, and the success that created the present. Even though their technologies might be more simple than ours, there is so much to be learned about the context in which they were able to survive.”"

Wednesday, May 19, 2021

The Government’s War on Pipelines Made Us Vulnerable to Attacks on Our Infrastructure

The recent fuel disruptions show the danger in the government's long war on oil pipelines

By Jon Miltimore of FEE. Excerpt:

"One answer is that we simply don’t have enough oil pipelines. The Colonial Pipeline provides nearly half—45 percent—of the fuel consumed on the East Coast. As other astute commentators have noted, “one pipeline network shouldn't be serving half of the East Coast's fuel needs.”

The reality is regulatory hurdles have made it all but impossible to build new pipelines, which has placed a great deal of pressure on existing energy infrastructure. And it’s getting worse. Indeed, politicians are now actively scrapping pipelines that are instrumental to meeting future energy needs.

One of President Biden’s first initiatives was to scrap, by executive order, the Keystone Pipeline, a 1700-mile pipeline that could have carried roughly 800k barrels of oil each day from Alberta to the Gulf Coast. (Instead, the bulk of that fuel will be transported by railways, which are less environmentally friendly and more dangerous.)

Biden’s scrapping of the Keystone Pipeline received a great deal of attention, but it’s worth noting the action was part of a trend that has been largely overlooked. Across the US, pipelines are being targeted by politicians, regulators, and courts with great zeal.

A year ago, Michigan Gov. Gretchen Whitmer took legal action to force the shutdown of the Line 5 Pipeline, which links Lake Michigan and Lake Huron and carries about 500,000 barrels of crude each day.

"Here in Michigan, the Great Lakes define our borders, but they also define who we are as people," said Whitmer, who gave Enbridge Energy a deadline of May 2021 to stop the oil.

As of Tuesday, with the deadline rapidly approaching, the oil was still flowing. And news reports say Enbridge Energy and the Michigan governor are likely heading for a legal showdown.

Then there is the Atlantic Coast Pipeline. Last year Duke Energy and Dominion Energy announced the cancelation of the 600-mile project—which would have piped gas from West Virginia to eastern North Carolina—because delays and regulatory uncertainty had threatened “the economic viability of the project.”

The 1,200 mile-long Dakota Access Pipeline, which has been flowing since 2017, currently carries hundreds of thousands of barrels of crude through the Dakotas to Iowa and Illinois. While the Biden administration has announced it will not shut down the pipeline, a US district court judge did in July 2020. That ruling was overturned by a federal appellate court, but the pipeline’s fate hangs in the balance pending an environmental review.

For many, the lesson of the recent gas shortage is that we need more cybersecurity oversight.

"This pipeline shutdown sends the message that core elements of our national infrastructure continue to be vulnerable to cyberattack,” Mike Chapple, a professor in University of Notre Dame’s Mendoza College of Business, told Reuters. “Securing our energy infrastructure is a national security issue that involves several different federal agencies and requires centralized leadership.”

Anyone who understands the “knowledge problem” will be rightly skeptical of solutions based on “centralized leadership,” especially when it comes to a “national security issue that involves several different agencies,” given the track records of the NSA, the TSA, the CDC, etc. What we really need is, not more, but less government oversight getting in the way of more pipelines.

The current disruption should serve as a reminder that fossil fuels are an essential part of human prosperity.

No one has made this point better than Alex Epstein, the author of The Moral Case for Fossil Fuels, who noted that cheap, plentiful fossil fuels—when married with human ingenuity—allow humans to improve the world around them.

“Fossil fuel technology transforms nature to improve human life on an epic scale. It is the only energy technology that can currently meet the energy needs of all 7+ billion people on this planet,” wrote Epstein. “Ultimately, the moral case for fossil fuels is not about fossil fuels; it’s the moral case for using cheap, plentiful, reliable energy to amplify our abilities to make the world a better place – a better place for human beings.”

The other side of that coin is that when energy is made needlessly expensive, scarce, and unreliable—whether by cybercriminals or politicians—it makes the world a more frustrating and unhappy place for human beings"

Wednesday, October 28, 2020

Native tribes once set fires to help keep forests in balance. After banning the practice, authorities are returning to it

See Fighting Wildfires With Fire by Richard Schiffman. He is a freelance health and environment journalist based in New York. Excerpts:

"Traditionally, indigenous groups throughout North America and much of the rest of the world set fires to encourage the growth of edibles like berries and tubers and to kill off insect pests. Hunters used fire to drive buffalo herds on the Great Plains, and tribes in the Eastern Woodlands burned vegetation to trigger the sprouting of oak and chestnut trees, which were prized for their nuts.

Human-set fires reduced the tangle of small trees and underbrush that make many forests today tinder boxes waiting to explode. Native American fire culture in California and the Pacific Northwest created a biodiverse mosaic of forests and woodlands interspersed with open meadows that served as natural fire breaks—a far safer landscape than the uniform conifer stands that exist now."

"That relative permissiveness ended with “The Big Blowup” wildfire in 1910 that incinerated 3 million acres, leveling towns in Montana and Idaho. Thereafter, the Forest Service trained crews to put out all fires, a policy championed in the mid-20th century by its mascot, Smokey Bear. We’ve been paying dearly for that mistake for years now, Mr. Tripp argues. [Bill Tripp, the Karuks’ director of natural resources.]

“We don’t think climate change is the cause of these big fires. It is a stressor, a significant stressor,” he said. “But we view fire exclusion as the cause because it allows all of that dead, burnable material to accumulate.”

During the 1960s, scientists began warning presciently that excluding fire from forests was setting the stage for the kind of disastrous blazes that we’re seeing today, and federal programs began to encourage allowing lightning fires to run their course. A spate of big blazes in the 1990s convinced some fire managers to take a more proactive approach, implementing mechanical thinning along with controlled burns to reduce dangerous fuel loads.

The pace and scale of these efforts has lately been accelerating. In 2019 over six million acres were treated by federal agencies with prescribed fires, nearly three times the total of a decade earlier, according to data from the National Interagency Fire Center. Recently, the Forest Service also began partnering with native fire experts like Ron W. Goode, the chairman of California’s North Fork Mono Tribe.

Still, Mr. Tripp says that progress has been far too slow. “The Karuk are given permission to burn about 400 acres a year on private lands,” he said. “We need to be burning at least 4,000 acres a year—and on public lands as well.” He blames bureaucratic hurdles like the difficulty in getting environmental clearance for fires, due to liability issues and a shortage of people properly trained to do the work."

"fire management experts argue that small-scale controlled burns produce far less smoke for shorter durations than the megafires that are darkening skies for weeks throughout the West Coast today.

Can these ancient practices work in the radically different climate and environment that exists today? Mr. Lake, the forest service ecologist, thinks they can. [a U.S. Forest Service research ecologist whose family is of Karuk and Yurok ancestry] He points to Florida, one of a handful of “right to burn” states in the Southeast with strong traditions of rural burning. Landowners there are permitted to set fires on their own property, and forestry agencies also use controlled fire a lot more freely than they do out West.

Florida’s unique fire culture grew out of the contact between early Scottish and Irish settlers, who were already accustomed to burning to manage forage for cattle and wildlife in their homelands, and Native American tribes with a robust tradition of maintaining their landscape of grassy prairies, wetlands and open woodlands with well-timed fires. The tribes schooled Florida’s early settlers on the best times of year to burn based on the natural cycles of plants and the seasonal rising and falling of water on the land.

Unlike in the West, where wildfire frequently spelled disaster, Florida’s history of frequent low-intensity burns was far more benign, creating a more fire-tolerant culture in the state, according to Rick Anderson, the former fire management officer at Everglades National Park. “Florida burns two to three million acres a year to manage its fuels,” Mr. Anderson said. “If California did even a percentage of that, they’d have a lot less catastrophic fire there.”

Another place with a long tradition of safe fire is the wilderness of Arnhem Land in northern Australia, where aboriginal peoples light frequent bush fires, as their ancestors have done since the Pleistocene era, according to David Bowman, a professor of pyrogeography and fire science at the University of Tasmania. Mr. Bowman published an influential study on the subject in 1999 that describes the remarkable survival of what he considers one of the world’s last intact fire cultures."

Sunday, September 20, 2020

Oil Industry Is Fading Away in Land of the World’s Richest Reserves

Venezuela sees its production dwindle after decades of graft and mismanagement under Chávez and Maduro regimes, and now the burden of U.S. sanctions. The last drilling rig in the country has shut down

By Kejal Vyas and Ginette González of The WSJ. Excerpts:

"While U.S. sanctions have undoubtedly made matters worse for the Venezuelan industry, economists say most of the fault lies with the two decades of incompetence and graft under the Chávez and Maduro governments, which included making foreign business partners unwelcome.

Venezuela’s oil story began in 1922 with the country’s first successful well. Before long, Venezuela was the second-largest oil producer in the world, after the U.S., with output exceeding even that of Saudi Arabia and Iran. In 1960, Venezuelan Oil Minister Pablo Pérez Alfonzo spearheaded the founding of OPEC.

Venezuela was developing rapidly and attracting European immigrants by the 1970s, a decade when its government nationalized the oil industry. Oil made Venezuela the wealthiest country per capita in Latin America by the late 1970s.

But the country also had large pockets of poverty and a corrupt ruling class. Its dependence on oil left it vulnerable to disruptions such as price shocks. Mr. Pérez Alfonzo prophesied that the reliance on what he called “the devil’s excrement” would one day bring ruin.

When Mr. Chávez, a revolution-minded former army captain, rose to power in 1999, vowing to close the wealth gap in Venezuelan society with socialist policies, he put an end to the operational independence enjoyed by PdVSA, the state oil company.

PdVSA had earned a reputation for efficiency. Mr. Chávez fired its top management after an industry strike aimed at toppling his leadership. He began using the company to build housing, distribute chicken to slum dwellers and organize Socialist Party rallies. Venezuela left gasoline virtually free for its citizens. It also sold cut-rate oil to leftist allies in the region such as Cuba.

In 2006, Mr. Chávez ripped up contracts with the international companies that were doing much of the oil-field work, forcing them to cede majority operational and financial control of projects to PdVSA. One by one, oil majors such as Exxon Mobil Corp. quit the country. Investment declined, and so did output.

At first, few in Venezuela noticed or cared. Oil’s price, driven by a rising Chinese economy, was surging. The price spike bought the government a bounty, which Mr. Chávez spent on programs such as food and other subsidies rather than maintaining the oil industry. By the time he succumbed to cancer in 2013, Venezuela’s crude oil production was about half the level of when he took over. 

In addition, billions of dollars of oil revenue were diverted into discretionary funds controlled by the president with little accounting. Unchecked spending allowed regime insiders to plunder the state coffers and enrich themselves. The graft spawned a leftist bourgeoisie in Venezuela that splurged on luxuries from opulent Miami lofts to castles in Spain. 

Diego Salazar, an oil executive and cousin of a longtime oil czar, became a gatekeeper at PdVSA. Mr. Salazar is accused by Venezuelan prosecutors of charging foreign companies multimillion-dollar bribes to operate in the country. Friends said he sometimes handed out Rolexes at parties, earning the moniker Mr. Wristwatch. After a falling-out with Mr. Maduro, Mr. Salazar was jailed in 2017 on corruption charges. His family has likened the arrest to a kidnapping. Mr. Salazar couldn’t be reached for comment. He hasn’t had court hearings.

Lower-level executives also took advantage, according to company records and court documents. At one joint venture, managers stole hundreds of millions of dollars by routinely inflating the cost of oil-field supplies such as office equipment by more than 100-fold, according to charging documents and purchasing invoices reviewed by The Wall Street Journal. The operator of a company that supplied office equipment pleaded guilty and was sentenced to house arrest.

Transparency International, which calls itself a global movement with the mission of promoting accountability and integrity, ranks Venezuela as one of the world’s most graft-ridden countries in its “corruption perceptions index.” The years of theft, combined with endless subsidy spending and neglect of infrastructure, have left Venezuela’s economy with little to show for the more than $1 trillion in oil revenue it collected in 22 years of socialist rule. Nearly a third was lost to malfeasance, former allies of the government have told the Journal.

The party ended when global oil prices abruptly started dropping in the autumn of 2014. Venezuela’s economy, deprived of revenue, went into freefall. The Maduro government tightened political control to stay in power, sidelining the country’s legislature and having protesters beaten, arrested or shot."

Thursday, September 19, 2019

The market finds a way (to deal with declining resources)

By Scott Sumner.
"Experts often warn that we are soon going to run out of a natural resource.  If so, then we might expect an increase in price, which encourages conservation. In many cases, however, that price increase unleashes a new and unforeseen alternative supply. Consider the fishing industry, which used to rely on fish caught in the ocean:


Notice that ocean caught fish peaked in the mid-1990s, and all the new supply has been coming from aquaculture.

Here’s the global oil industry:


Notice that conventional oil production peaked around 2011, and all the new growth in demand is being filled by unconventional oil sources (mostly fracking.)  Further back in history, whale oil was the “conventional oil” and underground petroleum was “unconventional”.


"

Thursday, May 30, 2019

China's Threat To Restrict Exports of Rare Earth Minerals to the U.S. Is an Empty Bluff

China's 2010 export restrictions on rare earth compounds failed then, and they would fail now

By Ronald Bailey of Reason.
"China is shooting blanks with its threat of a rare earth minerals embargo, the most recent salvo in an ongoing trade war with the United States.

Agence France-Presse reports that, according to various state propaganda sites, the Chinese government may counter President Trump's tariffs by cutting off America's access to exports of rare earth minerals that are used in all sorts of advanced electronics. Rare earth metals are chemically similar and include cerium, neodymium, europium, and samarium. Despite their name, most rare earth metals are similarly abundant as more familiar elements like copper, nickel, and zinc.

"Waging a trade war against China, the United States risks losing the supply of materials that are vital to sustaining its technological strength," the official Xinhua news agency said in a commentary. The state-owned Global Times further warned, "It is believed that if the U.S. increasingly suppresses the development of China, sooner or later, China will use rare earths as a weapon."

While the U.S. Geological Survey reports that China produced 70 percent of rare earth minerals in 2018, there are rare earth minerals elsewhere in the world. What's more, the Chinese government has played this game before, imposing export restrictions on rare earth minerals back in 2010. At the time, I predicted that "new supplies and innovation will ensure that the future of the world's high tech economy will not depend upon the whims of the mercantilist mandarins who steer Chinese industrial and trade policy." By 2016, my prediction had come true.

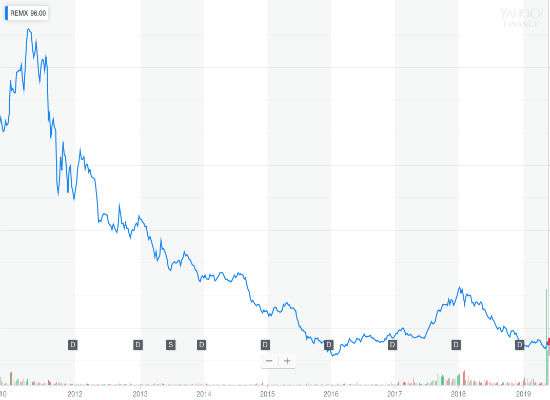
As a result, the price for the VanEck rare earths ETF, for example, has dropped by more than 85 percent since the fund's inception in 2010. [that is a weighted stock index of companies that mine rare earths]


Also, keep in the mind that the U.S. Geological Survey estimates the value of rare earth compounds and metals imported by the United States in 2018 was just $160 million. Chinese export restrictions on rare earth compounds could cause some short term economic pain, but it would be soon alleviated as miners and innovators turned to exploit the nearly two-thirds of the world's reserves that lay outside of the Middle Kingdom. Those global reserves, by the way, would last more than 700 years at current rates of extraction."

Monday, January 28, 2019

Laws over the last 50 years, including the Endangered Species Act and National Environmental Policy Act, have hampered tree-clearing, controlled burns and timber sales on federal land which increas forest fires

See California’s Paradise Lost: Trump is a bully, but he’s right about bad forest management. WSJ editorial. Excerpt:

"About 57% of California forestland is owned by the federal government while most of the rest is private land regulated by the state. Nearly 130 million trees died in California between 2010 and 2017 due to drought and a bark beetle infestation. Dense forests put trees at greater risk for parasitic infection and enable fires to spread faster. When dead trees fall, they add more combustible fuel.

Once upon a time the U.S. Forest Service’s mission was to actively manage the federal government’s resources. Yet numerous laws over the last 50 years, including the Endangered Species Act and National Environmental Policy Act, have hampered tree-clearing, controlled burns and timber sales on federal land.

California also restricts timber harvesting and requires myriad permits and environmental-impact statements to prune overgrown forests. As the state Legislative Analyst’s Office (LAO) dryly noted in April, “project proponents seeking to conduct activities to improve the health of California’s forests indicate that in some cases, state regulatory requirements can be excessively duplicative, lengthy, and costly.”

One problem for landowners is disposing of deadwood. Dozens of biomass facilities that burn tree parts that can’t be used for lumber have closed due to emissions regulations and competition from subsidized renewables and cheap natural gas.

To burn leaves and tree limbs, landowners must obtain air-quality permits from “local air districts, burn permits from local fire agencies, and potentially other permits depending on the location, size, and type of burn,” the LAO explained. “Permits restrict the size of burn piles and vegetation that can be burned, the hours available for burns, and the allowable moisture levels in the material.”"