Wednesday, May 31, 2017

How paid family leave hurts women

By Vanessa Brown Calder of Cato writing for CNN.
"The White House released its full budget last week, and one of President Donald Trump's campaign promises materialized along with it: paid family leave. The details of the program remain hazy, but what we do know is that states would be required to design and finance six weeks of paid parental leave for workers. It would cover mothers and fathers.

This surely sounds like a boon to working women, who (on average) do more child rearing and housework than working men do. To those who object to some of the budget cuts to social programs, the administration's policy on family leave may even seem heartwarmingly egalitarian. 
 
Unfortunately, a review of states and countries with government-mandated paid leave programs indicates they harm young women, whether they're available to fathers or not. This is because parental leave policies are associated with an increase in leave-taking and childbearing, which leads to lost labor or increased health care costs for companies. As a result, employers may assume women will cost more to employ than before the policy, and company decisions to hire, promote, train or pay women less can reflect that, at women's expense. 
 
But it doesn't have to be this way. Government can create a buyer's market for labor through a variety of deregulatory initiatives. For instance, reforming occupational licensing laws, which prevent women from working in certain occupations, and relaxing zoning regulations, which increase low-income women's commute times, will make it easier for mothers to participate in the labor force on their terms.  
Meanwhile, eliminating the tax exclusion for employer-sponsored health insurance, which ties women to jobs with abysmal maternity benefits, will enable women to take jobs that line up better with their personal needs. Finally, deregulation of inane child care regulations, such as Washington, D.C.'s new requirement that child care workers obtain college degrees, will make work economically practical.
Lawmakers should also look closely at an alternative that Congress is considering: the Working Families Flexibility Act of 2017. The bill allows interested employees of either gender to bank overtime hours and use them as time off later as government employees and some unionized workers already do. Remarkably, private companies are prevented from compensating employees this way under the Fair Labor Standards Act. Because women highly value flexibility at work, the ability to reach this type of working agreement is more essential than ever.
Ignoring these ideas may be costly, and California provides a ready example of why government-mandated paid leave is a less effective way of imparting leave benefits. The state instituted a six-week paid leave program in 2000, and research indicates a noticeable increase in young women's unemployment and unemployment duration lengthened by 4% to 9%. Hypothetically, this is because "firms decrease their demand for these possibly more costly (female) workers," according to the report. These results held when researchers compared young women with Californian men, with older Californian women and with young women in states that did not adopt the policy. 
 
Still, defenders of policies such as California's argue it hasn't been around long enough to see a full range of social benefits. In that case, Europe serves as a shining example of how government-mandated paid leave can be a letdown, even in the long term. In the Nordic countries, which are often cited as the gold standard for gender equity, research suggests family-friendly policies are a "costly solution" and may have inadvertently created a "system-based glass ceiling" for women. 
 
And indeed, paid leave policies in Norway seem to have done just that: Women in the United States occupy, according to a project of the Cato Institute, about 40% more of the nation's legislative, senior official and managerial roles than Norwegian women do in their home country. 
 
So why is it that paid leave policies, which are ostensibly created to help women, end up hurting them? For one thing, even in places where paid leave programs are gender-neutral, female employees utilize the benefits at higher rates than men do. In Sweden, for instance, only about 14% of men share the days equally with their partners despite government subsidies providing bonuses and tax credits to motivate parents' identical division of paid leave. Woman probably take more leave for a variety of biological, sociological and cultural factors
 
Fortunately, the current proposal and its associated impacts are not foregone conclusions: The administration's leave policy still needs congressional approval. Congress can choose another way: Deregulating industry will provide women with more professional choices, and amending rigid labor laws will endow employers with the flexibility to provide flexibility."

Small Businesses Struggling With $15 Minimum Wage, New Site Reports

By Esha Chhabra of Forbes.
"Last week Senate Democrats introduced legislation to support a raise for minimum wage to $15 an hour by 2024. Nearly 20 states have already raised minimum wage at the local level.

While the Raise the Wage Act may have had positive intentions, it could close many small businesses, according to the Employment Policies Institute, a nonprofit which launched its own campaign last week called “Faces of $15,” a website that chronicles the stories of small business owners throughout the United States who are struggling to keep up with all the minimum wage increases.

The website contains 100 stories of small businesses that have been affected by the increased costs. “The real Faces of $15 are the business owners who've been forced to close their doors, and the employees who've lost their jobs,” says Michael Saltsman, managing director at EPI, "Policymakers shouldn't be fooled by labor's rose-colored rhetoric on a new wage mandate." 

According to the Small Business Administration, small businesses provide 55% of all jobs and 66% of all net new jobs since the 1970s in the United States. 28 million small businesses account for 54% of all US sales. In addition, 600,000 franchise small businesses in the US are responsible 8 million jobs. Add to that the real estate component: small businesses in America are responsible for occupying an estimated 20 to 30 billion square feet of commercial space.

The EPI argues that while it might be easy for corporations to adopt the $15 minimum wage, it's much more challenging for small businesses which form the backbone of the US economy.

Los Angeles, San Francisco and Seattle have already adopted minimum wage hikes. Los Angeles is geared to have $15 minimum wage by 2021.

Houman Salem of ARGYLEHaus of Apparel in San Fernando, California, a city within the limits of LA county, said that he will be going to Nevada for expansion because of the state’s minimum wage. He made the reason for this move public in an LA Times op-ed:

“The biggest reason is the minimum wage, which will rise to $15 by 2021 in the county and by 2022 statewide. I write with some hesitancy, because I’m in no way an opponent of higher pay. When you have a company with fewer than 50 employees, you get to know them pretty well and have a genuine concern for them as individuals. But that has to be balanced with concern for keeping your clients, who can always take their business to other countries or states.”

He then went to break down the economics of his company, which employs 25 individuals:

“When the $15 minimum wage is fully phased in, my company would be losing in excess of $200,000 a year (and far more if my workforce grows as anticipated). That may be a drop in the bucket for large corporations, but a small business cannot absorb such losses….Today, it’s cool to be a tech startup in Silicon Valley, but not to be an apparel industry startup in the San Fernando Valley. That needs to change.” 

He even challenged the president to get more familiar with the reality of running a manufacturing business in the US: “If President-elect Donald Trump is interested in learning more about the hurdles to adding manufacturing jobs in America, looking at the Golden State’s steep pay requirements would be a good place to start.”

That’s why the EPI has brought together stories of small businesses owners throughout the US onto one central platform to put a face to the economics of it all. Interestingly, one of the stories highlights a profit-sharing business that has ironically now closed because of the minimum wage hikes. Kelly Ulmer, owner of Almost Perfect Books in Roseville, California, had a business model that was employee-friendly, offering shares of all profits to the employees each week. 

“As the minimum wage increased, the profits decreased,” she says. “All of my employees actually made more money at $8 an hour than they do at $10 an hour because I had actual money to give them.”

In July 2016, she closed her store because of “the ever increasing minimum wage,” she says. She’s not alone. Nat Cutler, one of the owners of Abbot’s Cellar in San Francisco also had to close his doors when minimum wage went up -- along with other business costs in the city.

The stories are not limited to California, though they are concentrated in states that have already made moves to raise minimum wage. So it begs the question: is $15 minimum wage actually a good idea? 
According to Salem, “California’s putting up the going out of business sign. It’s a tragedy. ”"

Tuesday, May 30, 2017

The White House is proposing long-needed reforms that would fix a dysfunctional disability system that traps Americans in dependency.

About That ‘Gutting the Safety Net’: Runaway disability payments invite fraud and punish work. WSJ editorial. Excerpt:
"Critics are accusing President Trump’s 2018 budget of “gutting the safety net” with cuts to food stamps and disability insurance. In reality, the White House is proposing long-needed reforms that would fix a dysfunctional disability system that traps Americans in dependency.

The Trump budget proposes to reduce spending by $72 billion over 10 years on federal disability programs, the largest of which is Social Security Disability Insurance (SSDI). The cuts would be achieved by testing and adopting incentives for individuals to return to the workforce; reducing retroactive payments; tweaking the appeals process for denied claims; holding swindlers liable for overpayments; and other measures to make sure applicants are genuinely disabled.

The 1956 disability-insurance program offers payments to those who become disabled before retiring, and the cash transfer is financed by payroll taxes. Disability insurance pays out about $150 billion a year to nearly nine million Americans, who after two years of benefits are also eligible for Medicare. That runs another $80 billion.  

The number of disability-insurance recipients has tripled since the 1980s, when Congress relaxed requirements. (See nearby.) A worker can cite several smaller ailments, such as back pain, to illustrate an inability to work, as opposed to one debilitating condition. An applicant can appeal a denial up to four times, and most cases reach administrative-law judges, who are slammed with hearings and have an incentive to award benefits and move on.

Mark Warshawsky and Ross Marchand of the Mercatus Center report that administrative-law judges approved 70% of appeals on average in 2008. About 9% of judges approved more than 90%. The authors estimate that a decade of judicial failures will lead to lifetime mispayments of $72 billion. As it happens, that is the ballpark for Mr. Trump’s supposedly shocking 10-year cut. The budget proposes a probationary period on judges who currently enjoy lifetime appointments.

The disability program is among the most susceptible to fraud in the federal government, which is an achievement. In 2015 more than 100 New York City police officers were charged with defrauding the program by faking anxiety attacks and other maladies to receive up to 75% of their salary. A Senate report from 2013 detailed how trial lawyers in Kentucky colluded with doctors and steered appeals to one munificent judge.

The less-noticed harm is that a mere 1% of beneficiaries return to work every year, as Andrew Biggs has noted in these pages. Most benefits are terminated only when a person dies or is transferred to a retiree program. But by one study’s estimate, half of applicants age 30 to 44 will find a job again if they aren’t approved for benefits.

One reason so few return to the labor force is that payments are essentially a tax on work. A 55-year-old who previously earned about $30,000 a year at work could receive more than $15,000 a year in disability payments, plus health-care benefits and perhaps other cash transfers such as food stamps. That means any job would have to pay more than what he loses in subsidies, which typically phase out as income rises. These “inframarginal” tax rates that trap people in poverty are never mentioned in moralizing about the necessity of helping the disabled and the poor.

A dark irony is that disability insurance has expanded to cover mental-health issues, which may aggravate the ailments. The literature on mental health suggests that anxiety and depression can be alleviated in part by healthy routines like work and maintaining social connections. Members of Congress like to fret about mental-health policy, but permanent-disability payments contribute to cultural problems like the opioid crisis.

By the way, if you think the Trump budget cuts are heartless, wait until the fund becomes insolvent and can’t pay anyone, which will happen sooner than you might think. The disability trust fund was set to go bankrupt in 2016, but Congress raided another pot to delay the reckoning for a few more years. That gimmick won’t last, and Mr. Trump deserves credit for noticing that $1 trillion in automatic entitlement spending is bankrupting the federal fisc."

The American Health Care Act is a major fiscal dividend with only a 17% drop in medicaid enrollment after the ObamaCare expansion

See How to Read an ObamaCare Prediction. A WSJ editorial. Excerpts: 
"average premiums in the individual market have increased 105% since 2013 in the 39 states where the ObamaCare exchanges are federally run. That translates into about $3,000 more a year for the average family. There are limitations to the data, such as separating ObamaCare artifacts from underlying medical cost movements, but the trend doesn’t reflect well on whoever called it the Affordable Care Act."

"HHS says premiums have increased by 145% on average in Missouri over four years."

"Nonetheless CBO says 14 million fewer people on net would be insured in 2018 relative to the ObamaCare status quo, rising to 23 million in 2026. The political left has defined this as “losing coverage.” But 14 million would roll off Medicaid as the program shifted to block grants, which is a mere 17% drop in enrollment after the ObamaCare expansion. The safety net would work better if it prioritized the poor and disabled with a somewhat lower number of able-bodied, working-age adults.

The balance of beneficiaries “losing coverage” would not enroll in insurance, CBO says, “because the penalty for not having insurance would be eliminated.” In other words, without the threat of government to buy insurance or else pay a penalty, some people will conclude that ObamaCare coverage isn’t worth the price even with subsidies. CBO adds that “a few million” people would use the new tax credits to buy insurance that the CBO doesn’t consider adequate."

Monday, May 29, 2017

Two Recent Articles That Show Some Of The Problems With Organics

Organic food is great business, but a bad investment by Bjorn Lomborg. Excerpts:
"Back in 2012, Stanford University’s Center for Health Policy did the largest comparison of four decades worth of research comparing organic and regular food. They expected to find evidence that organics were nutritionally superior. Their conclusion: “Despite the widespread perception that organically produced foods are more nutritious than conventional alternatives, we did not find robust evidence to support this perception.”

A brand new review this year shows the same thing: “Results of scientific studies do not show that organic products are more nutritious and safer than conventional foods.” (that is from an article that was published in the journal Cogent Food & Agriculture with some of the authors being professors of food science)."

"Yes, organic farming will mean that in one field, a farmer will use less energy, create fewer greenhouse gases and have less nitrogen leaking.

But consider the bigger picture. Organic farming is much, much less efficient than regular old farming. Our farmer needs more fields to grow the same amount of produce. Not just because going organic means less fertilizer and more bugs and pests, but also because the land needs to lie empty or be planted with legumes to rebuild fertility between crop cycles.

A big study in Europe found that to produce the same gallon of milk organically, you need 59% more land. To produce meat, you need 82% more land, and for crops, it is more than 200%. That adds up to a lot of forest and nature being turned into farms for people in Portland, Ore., or Providence, R.I., to feel better about their choices at the supermarket.

If U.S. agricultural production were entirely organic, it would mean we'd need to convert an area bigger than the size of California to farmland. It is the same as eradicating all parklands and wild lands in the lower 48 states.

Moreover, by eating something organic, you are actually responsible for about as many greenhouse gas emissions as if you had chosen a regular product. Those are the gases that cause global warming. And organic products mean more of some other bad environmental things: about 10% more nitrous oxide, ammonia and acidification, while contributing almost 50% more to nitrogen leaching.

At least going organic means that we avoid nasty pesticides, right? Wrong. Organic farming can use any so-called natural pesticide. This even includes copper sulfate, which Cornell University describes as “highly toxic to fish” even at recommended rates, and which has caused liver disease in France. Or Pyrethrin, which is “extremely toxic to fish," “highly toxic to bees”, and has been linked to an increase in leukemia among farmers.

Of course, conventional, non-organic foods carry a higher risk of pesticide contamination. Rough calculations suggest that all the pesticides used in America could cause about 20 extra cancer deaths per year. You have a similar chance each year of being mauled to death by a cow.

Compare this with the deaths from going organic. If the entire USA were fed on organic produce, it would cost $200 billion more annually. This is money we couldn’t spend on things that matter. When a nation becomes $15 million poorer, research shows that it costs one statistical life. For example, people who are worse off are less likely to pay for a doctor’s visit. What this means is that going fully organic would kill more than 13,000 people each year."

See Your organic cotton t-shirt might be worse for the environment than regular cotton by Marc Bain of qz. Excerpt:
"One major reason, as various speakers pointed out at a May 23 panel held by Cotton Inc., a research group that serves the cotton industry, is that conventional cotton varieties have a higher yield, meaning a single plant will produce more fiber than its organic counterpart. That’s because conventional cotton has been genetically engineered for that purpose. In the past 35 years, cotton yields have risen 42% (pdf), largely due to biotechnology and better irrigation techniques.

Organic cotton, by definition, comes from plants that have not been genetically modified. Because of that difference, to get the same amount of fiber from an organic crop and a conventional crop, you’ll have to plant more organic plants, which means using more land. That land, of course, has to be tended and irrigated.

It will take you about 290 gallons of water to grow enough conventional, high-yield cotton to produce a t-shirt, according to Cotton Inc. To grow the same amount of organic cotton for a t-shirt, however, requires about 660 gallons of water. The disparity is similar for a pair of jeans. (It’s worth noting that Cotton Inc., a not-for-profit group, works to help boost the industry’s demand and profitability—though it insists any claim it makes must be vetted by its legal department and the US Department of Agriculture.)

It’s common to see the claim that organic cotton actually requires less water over time, in large part because soil with more carbon from organic matter stores water better. But generally a cotton plant requires the same amount of water whether it’s organic or not, and non-organic farmers also use plenty of methods to keep their soil healthy.

The main environmental concern with water use relates to irrigation, especially in countries such as India, struggling with water scarcity. But about half of cotton crops globally—organic and conventional—get their water from rainfall, according to Cotton Inc. The most water-efficient option is that rain-fed cotton, but there’s no way to know whether the cotton in the t-shirt you’re buying was that variety, or whether it required additional water.

What’s most important, according to Dr. Jesse Daystar, director of the center for sustainability and commerce at Duke University, is efficiency. “Organic, all-natural is not always better,” he said at the Cotton Inc. event. “It’s really about maximizing your product per amount of inputs.”

The lower yields of organic crops have even been linked to higher greenhouse-gas emissions on the industrial farms producing them. And how far cotton travels before it winds up in your closet should factor into the environmental equation too. India grows the great majority (pdf) of the world’s organic cotton, and the US is probably (pdf) the biggest organic-cotton consumer. Meanwhile, Sweden’s H&M, which manufactures much of its clothing in Asia, has been labeled its top user. (Of course, conventional cotton also can be—and often is—sold far from where it was grown.)

Where organic cotton may have an advantage is in using fewer chemicals. It still uses chemicals, just naturally derived ones, which advocates say are less harmful—though there’s some evidence to suggest that certain organic pesticides can be worse for the environment than conventional ones. But particular chemicals used in conventional farming have raised serious concerns, such as glyphosate, a widely used herbicide that’s the key ingredient in Monsanto’s Roundup weedkiller brand, which the World Health Organization has deemed a “probable carcinogen” based on studies of workers who used the product. (There’s no evidence to suggest that wearing clothing made from cotton grown with the chemical is harmful.)"

America's highways and bridges aren't exactly 'crumbling'

By Robert Krol of Mercatus. He is also a professor of economics at California State University, Northridge. Excerpts:
"Where exactly do our highways stand? The Department of Transportation provides annual state-level data on highway and road conditions across the country. This data allows for a measurement on those conditions using the objective International Roughness Index.

It turns out things aren't nearly as bad as Americans tend to think. Only about 8.5 percent of all urban interstates were in poor condition in 2014, along with 2 percent of rural interstates. The higher urban figure reflects higher traffic volume. Figures for the entire highway and road system have changed very little over the last decade.

"Turning to bridges, the percent in need of attention declined over the last 10 years. In 2014, about 7.5 percent were structurally deficient (requiring reduced carrying loads). A little over 18 percent were functionally deficient (for example, too narrow). Both types are considered safe but need maintenance to improve performance.

These figures mask wide differences across states. For example, 25 states have improved their urban interstates over the past 10 years. Diverse states like Arizona, Florida, Ohio and Illinois have only about 1 percent of urban interstates in poor shape. Hawaii and California had the highest percentage of poor quality urban interstate highways in 2014, at 22 and 15 percent, respectively. A similar story can be told for rural interstate highways, freeways, arterials and bridges.

Because the condition of highways and bridges varies across states, expanding Washington's traditional funding approach would be a mistake. Our system does a poor job of getting funds to areas of the country most in need of investment.

More than 90 percent of federal transportation money allocated to states is determined by an inflexible, politically driven formula. Under 2015's Fixing America's Surface Transportation Act, each state's future share of federal dollars is tied to the share of funds it received in that year. So past fund allocations drive the process rather than the current condition of a state's transportation system.

And since each senator or representative wants their state's "fair" share, it is nearly impossible to reallocate funds away from their districts toward other highways and bridges more in need of work. It would make more sense to reduce Washington's role by lowering the federal fuel tax and letting states adjust their own fuel taxes to make up the difference. The smaller federal tax should only fund important national projects — for example focusing solely on maintaining the Interstate Highway System.

With a lower federal fuel tax, states would then be in a position to set their fuel taxes at a level to fund the maintenance and construction of non-interstate highways, roads and bridges that affect their own residents. Because states would cover the full cost of these projects, it would result in better decision making and ultimately more productive infrastructure projects at a lower cost to taxpayers."

Sunday, May 28, 2017

Some Briefs On Occupation & Gender And Examples Of Unintended Consequences

See Science, Engineering Studies Are Still a Hard Sell to Women: Data show women earned just 21% of undergraduate engineering degrees and fewer in computer science, a trend that could exacerbate a gender-based earnings gap by Melissa Korn of the WSJ. Excerpt:
"Nearly half of all bachelor’s degrees earned in the sciences and engineering in the 2015-2016 academic year went to women, according to new data from the National Student Clearinghouse Research Center. That is due in large part to the popularity of psychology, biology and social-science programs. Women still earned just 21% of undergraduate engineering degrees and an even smaller share in computer science.

More than twice as many women received bachelor’s degrees in psychology last year as they did undergraduate degrees in computer science, engineering and the physical sciences combined. Women accounted for 77.6% of all bachelor’s degrees in psychology last year, and earned 57.6% of all undergraduate degrees across disciplines in the 2015-16 academic year."
Mao had a pest extermination policy turn bad. See Have a Banana. On Second Thought, Don’t. by Raj Patel in the NY Times.
"Biological battle rarely makes headlines, though when it does it’s usually a story of spectacular failure involving bad biology and worse economics. Mao Zedong commanded a 1958 war on the vermin afflicting Chinese granaries, encouraging the extermination, over a two-day period, of all fleas, flies, rats and sparrows. The government recorded “48,695.49 kilos of flies, 930,486 rats and 1,367,440 individual sparrows.” Unfortunately, tree sparrows don’t eat just grain — they also consume a range of pests. With their predators removed, the pests feasted on the harvest — crowning an economic policy that resulted in the death of millions by starvation."
What about government making water prices higher to encourage conversation? See  The Source of Life and Death by Bill Streever in the WSJ.

"There are homeowners who stop watering lawns with the hope of lowering water bills, only to watch their shade trees die and their air-conditioning bills skyrocket"

Ways In Which Passenger Air Travel Is Better Than It Used To Be

See There Was No ‘Golden Age’ of Air Travel in the NY Times by PATRICK SMITH, airline pilot. Excerpts:
"One of the reasons that flying has become such a melee is because so many people now have the means to partake in it. It wasn’t always this way. Adjusted for inflation, the average cost of a ticket has declined about 50 percent over the past 35 years. This isn’t true in every market, but on the whole fares are far cheaper than they were 30 years ago. (And yes, this is after factoring in all of those add-on “unbundling” fees that airlines love and passengers so despise.)

For my parents’ generation, it cost several thousand dollars in today’s money to travel to Europe. Even coast-to-coast trips were something relatively few could afford. As recently as the 1970s, an economy ticket from New York to Hawaii cost nearly $3,000, adjusted for inflation.

Not only are tickets cheaper, but we have got a wider range of options. There are planes going everywhere, all the time. Pretty much any two major cities in the world are now connected through at most one stop: Los Angeles to Delhi; New York to Fuzhou, China; Toronto to Nairobi. Overall journey times used to be much longer, and flying from the United States to points overseas meant having to connect at one of only a handful of gateway airports, with additional stops beyond.

Even well into the jet age, what today would be a simple nonstop or one-stop itinerary could include multiple stopovers. Not just internationally, but domestically, too: Three stops in a DC-9 to reach St. Louis from Albany, then another two stops on the trunk route over to Seattle or San Francisco.

Sure, you had more legroom and a hot meal. It also took you 14 hours to fly coast-to-coast, or two-and-a-half days to reach Karachi, Pakistan. Miss your flight? The next one didn’t leave in 90 minutes; it left the following day — or the following week.

I could mention, too, that the airplanes of decades past were louder — few things were more deafening than a 707 at takeoff thrust — and more gas-guzzling and polluting. And if, in 2017, you’re put off by a lack of legroom or having to pay for a sandwich, how would you feel about sitting for eight hours in a cabin filled with tobacco smoke? As recently as the 1990s, smoking was still permitted on airplanes.

As for legroom, there’s that conventional wisdom again, contending that airlines are forever cramming more rows into their aircraft. Except it’s not necessarily true. The spacing between rows, called “pitch” in the business, is, on average, less than it was 20 or 30 years ago — and yes, passengers themselves have become larger on average — but only slightly. Remember Laker Airways, whose “Skytrain” service ran between the United States and London in the 1970s and early ’80s? Sir Freddie Laker, the airline’s flamboyant founder, configured his DC-10s with a bone-crunching 345 seats — about a hundred more than the typical DC-10 at the time.

And what’s that in front of you? It’s a personal video screen with hundreds of on-demand movies and TV shows. No, not every carrier has these, but on longer flights it’s a standard amenity, along with USB and power ports. Onboard Wi-Fi is widespread. Remember when the “in-flight movie” was projected onto a blurry bulkhead screen, and you listened through one of those stethoscope-style headsets with jagged plastic cups that scratched into your ear?"

"Globally — catastrophes like those involving Malaysia Airlines Flights 17 and 370 included — the last 10 years have been the safest in the history of commercial aviation. Here in North America the stats are even more astonishing: There has not been a major crash involving an American legacy carrier in more than 15 years. By comparison, in 1985, 27 air disasters killed almost 2,500 people worldwide. During the 1960s, the United States saw an average of four major crashes every year. United alone had seven major accidents in a five-year span."

"For a number of reasons — technological, regulatory and infrastructural — aviation accidents have become a lot fewer and farther between. There are twice as many planes in the air as there were just 25 years ago, yet the rate of fatal accidents per miles flown has been steadily falling. The International Civil Aviation Organization reports that for every million flights the chance of a crash is one-sixth what it was in 1980."

Saturday, May 27, 2017

You Ought to Have a Look: Time for a New “Hiatus” in Warming, or Time for an Accelerated Warming Trend?

By Ryan Maue Ryan Maue of Cato. Excerpt:

"Except there was something fundamentally wrong with the climate models: they missed the pause! The IPCC was caught flat footed and their dodgy explanations were woefully inadequate and fueled continued questions about the credibility of future warming forecasts based exactly on those deficient climate models. What’s going on with this hiatus? A cacophony of explanations has filled the literature and media with several dominant themes: do not believe your lyin’ eyes – the data is wrong – and even if it is not, you are using it wrong. Karl et al. 2015 fixed the SST and buoy data, and (erroneously) claimed to have gotten rid of it. Cherry picking! The heat is sequestered in the depths of the ocean or the aerosols covered up the greenhouse gas signal. It’s enough to make you think climate “science” might not know what it is talking about! 

Only a few years since the last (2013) UN climate report, there is now a strong scientific consensus on the cause of the recent global warming hiatus as well as the previous “big hiatus” from 1950s-1970s: a mode of natural variability called the Interdecadal Pacific Oscillation (IPO) which could be colloquially called El Niño’s uncle. The mode operates on longer time scales than El Niño but it is intimately related as a driver of Pacific Ocean heat exchange with the atmosphere and therefore a dominant modulator of global temperature. In a March 2016 Nature Climate Change commentary (Fyfe et al.), eleven authors including climate scientists Benjamin Santer and Michael Mann persuasively “make sense of the early-2000s warming slowdown.” Their article provides evidence that directly contradicts claims that the hiatus was a conspiracy, or scientifically unfounded fiction. Several important points are made that deserve mentioning:

The recent hiatus occurred during a period of much higher greenhouse gas [GHG] forcing e.g. CO2 almost 100 ppm higher than the previous “big hiatus” slowdown in the 1950s-1970s. The authors rightly raise the question if the climate system is less sensitive to GHG forcing that previously thought or global temperatures will undergo a major warming “surge” once internal natural variability (e.g. IPO) flips sign.

The observed trends in global surface temperature warming were not consistent with climate modeling simulations. Indeed, using a baseline of 1972-2001, climate models failed to reproduce the slowdown during the early twenty-first century even as GHG forcing increased. The hiatus was neither an artifact of faulty data nor statistical cherry-picking – it was a physical change in the climate system that was measured across multiple independent observation types.

Climate scientists still need to know how variability (natural and anthropogenic) in the climate system works to attempt to model its changes through time regardless of political inconvenience.

Now back to the Henley and King (2017) piece that predicts a flip in the Interdecadal Pacific Oscillation to a positive phase will lead to almost 0.5°C increase in global temperature by 2030. Based upon the RCP8.5 high emission scenarios (which are likely to be too high themselves), those same climate models that did not adequately predict the early 21st century hiatus are used to generate so-called warming trajectories.

Image adapted from Henley and King (2017)

Image adapted from Henley and King (2017) 

How plausible is this extreme warming scenario? Regardless of the phase of the IPO, the model projections suggest an acceleration in the warming rates considerably above the hiatus period of the last 15-years. The authors allow for 0.1°C of warming from the recent strong El Niño as the offset for the “new” starting period, but that estimate is probably too low. We calculated the daily temperature anomaly from the JRA-55 reanalysis product—a new and probably more reliable temperature record–and apply a 30-day centered mean to highlight the enormous warming step with the 2015-2016 El Niño. Only an eyeball is necessary to see at least a 0.30°C upward step now into May 2017. Note that this is not carbon dioxide warming, and if we had a strong La Niña (the cold opposite of El Niño), we would expect a step down.

Is this warming now baked in (double entendre intended) to the climate system or will we descend to a lower level during the next year or two thanks to a La Niña? In other words, will the hiatus return, another one begin, or will the upward trajectory accelerate? Oh, and did we mention that we know of no climate model that warms the earth in jump-steps followed by long “hiatuses” after big El Niños?

"

Friday, May 26, 2017

David Henderson Corrects Larry Summers On Trade (gains to consumers matter)

See Larry Summers Trumps Trump at EconLog.
"On agriculture, China reiterated a promise that it has broken in the past to let in more beef. Previously, we, as reciprocity, had been withholding publication of a permissive rule on Chinese poultry, but we have now relented. Advantage China.
This is from Larry Summers, "Trump's 'China Deal' is only a good deal for China," May 24.

HT2 Mark Thoma.

In estimating "advantage," what factor is Larry missing? U.S. consumers who like poultry. There are a lot of us. When you see someone forgetting even to point out that our consumers gain when foreign producers send us cheaper products, what prominent U.S. politician does that sound like? That's right: Trump. Thus the titled of this post: Larry Summers, in his rhetoric, is starting to imitate Donald Trump.

Back in May 2000, I wrote an article in Fortune titled "What Clinton and Gore Don't Say." In it, I pointed out that U.S. trade negotiators rarely point out the benefits to consumers from free trade. I ended by writing:

In the negotiation process, the U.S. treats cuts in its trade restrictions as concessions rather than as the benefits they are. That's why the consumers' gains get lost in the shuffle. Economists like U.S. Treasury Secretary Lawrence Summers understand that. But U.S. Trade Negotiator Charlene Barshefsky and Vice President Gore? I'm not so sure.

Now, I'm no longer sure about Larry. And, in a way, he's even worse than Trump. He writes:

In addition to the leverage we sacrificed by committing to issue the poultry rule, we made other meaningful concessions. First, we agreed to allow exports of liquefied natural gas from the US to China. To at least a small extent that would mean higher heating costs for U.S. consumers and higher energy costs for U.S. producers.

Get it? Normally, even the Trumps and Summers of the world will at least regard as a gain an increase in U.S. exports due to declines in trade barriers. But because this particular gain in U.S. exports is due to a decline in a U.S. trade barrier, Larry counts it as a loss. It is a loss for U.S. consumers, but it's not hard to show that it's a net gain to the United States when we include the gains to LNG producers."

Who’d a-thunk it? Like most central planning, public transit systems are very costly and often don’t serve the public very well?

From Mark Perry.
"Some recent news reports on the declines in the use of mass transit systems across America:

Example 1: L.A. bus ridership continues to fall; officials now looking to overhaul the system
Example 2: CARTA’s (Chattanooga, TN) Main Route Suffers Another Blow As Overall Ridership Continues To Drop
Example 3: Miami-Dade shrinking Metrorail hours as ridership dips
Example 4: Subway Ridership Declines in New York. Is Uber to Blame?
Example 5: City Colleges (Chicago) has paid $3 million for a bus shuttle with few riders
======================

A few related items here……

Related 1: “Does America Need More Urban Rail Transit?” is the title of a recent Manhattan Institute report, and I think the answer is “No.” Here’s an excerpt from the abstract:
Low-density U.S. cities with new rail-transit systems have experienced limited ridership and single-digit transportation market share. Federal funds should be directed to rebuilding aging rail transit in cities where it already exists and where it serves a critical transportation function. In most cases, state and local governments should focus on providing transit service via traditional buses, not building new rail lines.
Related 2: Transit Crime Is on the Rise, here’s an excerpt:
Is there an upsurge in crime on and around transit, and if so, why? A few days ago, a Portland woman was stabbed at a light-rail stop, supposedly by a complete stranger. The very next day, a remarkably similar report came out of Tempe, Arizona, except in this case police said the victim and alleged perpetrator were acquaintances.
A month ago, a gang of at least 40 teenagers boarded a BART train and, while some held the doors to prevent the train from leaving the station, robbed seven passengers and beat up two or more who refused to cooperate. A few days before that, someone shot and killed a passenger and wounded three more on board a MARTA train in Atlanta. After arresting a suspect, police called it an “isolated incident,” but it doesn’t sound so isolated anymore. New York City is enjoying a drop in crime–except on board transit vehicles, where crime is up 26 percent.
… The numerous reports of transit crimes in the last few weeks are only going to depress ridership even further.
Related 3: From the new report “A Canadian town wanted a transit system. It hired Uber,”:
Uber, the global car-hailing service, has fought its way into resistant cities around the world, despite being hit by raw eggs and rush-hour roadblocks in Montreal and Toronto, fires in Paris and smashed windshields in Mexico City. But in Innisfil, a small yet sprawling Canadian town north of Toronto, the company has met a somewhat different reception. Town leaders have embraced the service as an alternative to costly public transportation, causing local taxi companies to worry about the effect on their business.
Innisfil is a rural quadrilateral-shaped town of about 104 square miles, on the southwestern shore of Ontario’s Lake Simcoe. It has no public transportation other than stops on a regional bus line. This week, the town inaugurated a pilot program for what Uber says is its first full ridesharing-transit partnership, providing subsidized transportation for the town’s 36,000 people.
Update…..
Related 4: “10 Reasons to Stop Subsidizing Urban Transit” by Cato’s Randall O’Toole."

Thursday, May 25, 2017

A 2016 report from the Pentagon claims that 22% of the military’s infrastructure is unnecessary

See Trump's Cost Cutting May Involve Military Closures, But Cities Shouldn't Worry by Adam Millsap of Mercatus.
"Yet there is little evidence that base closures have significant adverse effects on local economies. One study examining base closures from 1970 to 1994 found that the effect of a closure on local (county-level) employment was limited to the actual number of military jobs lost and that there was no negative employment effect on other sectors of the economy. In fact, it actually found evidence of indirect job creation rather than job destruction, though the effect was small. The study also found that, on average, local per capita income was unaffected by a closure.

Another study that explicitly takes into account reutilization of military infrastructure after a closure found that the long-run effects of a closure on local employment were positive overall. In addition to the reutilization of valuable infrastructure, the authors attribute the positive effect to increased federal education assistance that often accompanies a base closure, increased spending by military retirees on non-military-base retailers (instead of the BX and PX) and an increase in optimism as people adjusted to the new circumstances. The authors note that while base closures are never appealing to the workers and communities directly impacted, “the overall picture is most certainly not one of doom and gloom.”"

"But as the research shows, many of the places affected by base closures adapt and turn out just fine: The infrastructure can be refurbished and reused by private companies .

Reutilization is especially important when considering the economic impact of military facilities. Since the products and services provided by the military are not sold on a market and subject to the signals of profit and loss, we have little knowledge about how much people actually value them. This makes it hard to know whether the military’s inputs, including land and infrastructure, are being put to their highest-valued use. And if the land and infrastructure are not being put to their highest-valued use, the economy is not operating as efficiently as it could be.

A former military facility in Key West, the Truman Annex, was developed after being relinquished by the military, and today its hotels and rental homes contribute to the area’s robust tourism industry."

ACA Medicaid Expansion: A Lot of Spending of Little Value

By Brian Blase of Mercatus
"In new research published by the Mercatus Center, I analyze the causes and impact of the much higher-than-expected enrollment and spending associated with the Affordable Care Act (ACA) Medicaid expansion. Though unpredicted by Washington experts, the results were predictable. The federal government’s 100% financing of state spending on expansion enrollees has led states to boost enrollment and create high payment rates. (See this 2-minute Mercatus video for additional information on this significant development.)

In states that have expanded, enrollment and per enrollee spending are nearly 50% higher than predicted. While interest groups within the states—particularly hospitals and insurers—benefit from the higher spending being charged to federal taxpayers, substantial evidence suggests much of this new spending is wasted or provides little value for its intended recipients.

An important 2015 study showed that Medicaid expansion enrollees obtain low value through the program. Moreover, an increasing amount of spending on the program is lost to waste, fraud, and abuse. The Wall Street Journal highlighted a new government report showing that improper Medicaid spending exploded between 2013 and 2016. Improper payments amounted to about $67 billion in 2016, a $41 billion increase from the estimated $26 billion in 2013. The large increase in improper Medicaid payments has occurred while the ACA Medicaid expansion took effect, suggesting that the expansion is the main cause of the stunning rise. (Interestingly, the Department of Health and Human Services has pulled the report from the Internet.)

Perverse Incentives Produce Lots of Waste

Under the ACA, the federal government reimburses 100% of state spending on expansion enrollees—non-disabled, working-age adults with income between the state’s previous eligibility thresholds and 138% of the federal poverty level ($16,394 in 2016). After this year, the federal share gradually phases down until 2020 when it reaches 90%, where it is scheduled to remain.

Common sense suggests that a jurisdiction is more likely to increase spending on an area when the costs can largely be passed to other jurisdictions. This type of financing structure also lessens a jurisdiction’s incentive to ensure that the spending provides high value with low amounts of waste.

ACA Medicaid Explosion

Medicaid, already on an unsustainable cost-growth trajectory before the ACA, has experienced unprecedented enrollment and spending growth since 2013. Medicaid spending in 2015 was nearly $100 billion above the 2013 amount.

Medicaid expansion enrollment and spending is higher than projected even though not as many states as expected have adopted the expansion. My research shows the difference in the Congressional Budget Office’s (CBO) Medicaid expansion enrollment and spending projections over time. The first figure shows CBO’s most recent estimate of expansion enrollment along with CBO’s estimates from 2010, 2014, and 2015.


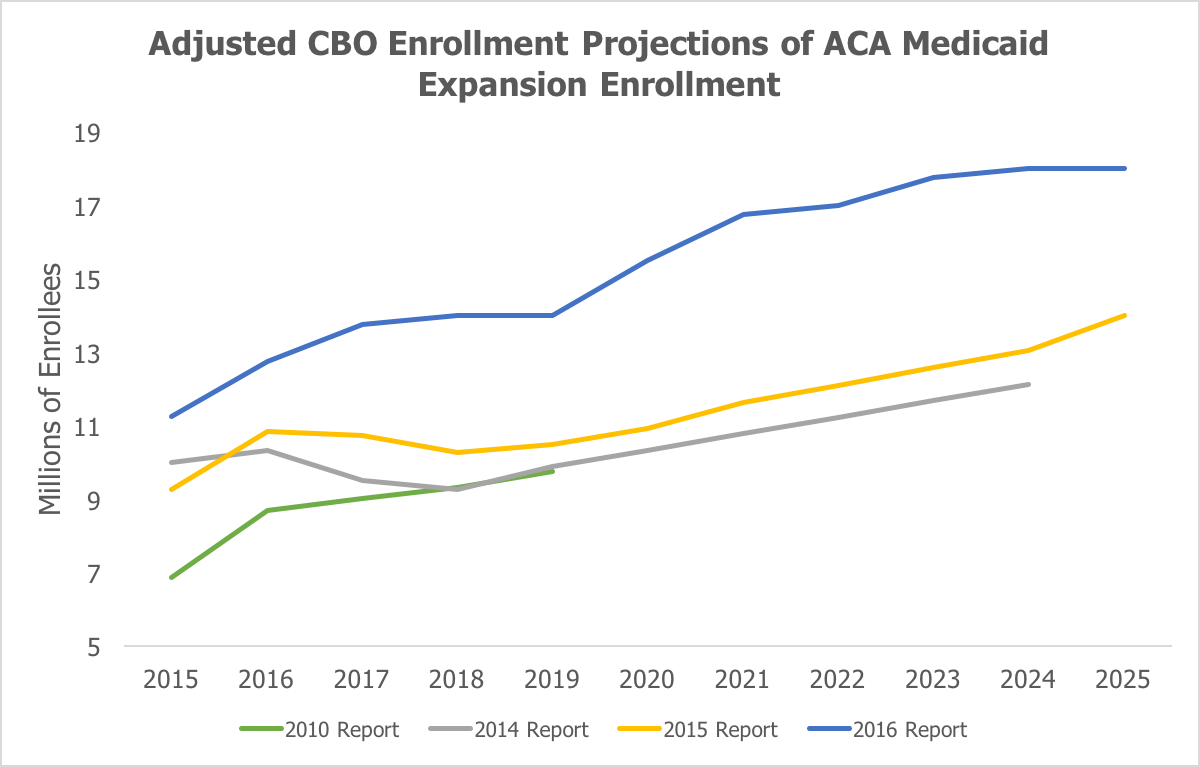
Enrollment is much higher than CBO expected when the ACA passed in 2010, and it is also significantly higher, particularly in 2017 and beyond, than estimated in both CBO’s 2014 and 2015 reports. Essentially, this means that far more people—roughly 50% more—have enrolled and are projected to enroll in Medicaid in the states that expanded than was expected by CBO previously. In addition to higher-than-expected enrollment, spending per newly eligible Medicaid enrollee is much greater than expected. As I wrote in July when the Obama administration released the 2015 Medicaid actuarial report, government spending on newly eligible enrollees equaled about $6,366 in 2015—an amount 49% higher than its projection of $4,281 from just one year earlier.

Both higher-than-expected enrollment and spending per enrollee has resulted in the Medicaid expansion being much more costly than projected. For example, in April 2014, CBO projected that the Medicaid expansion would cost $42 billion in 2015. The actual cost was $68 billion, about 62% higher.

The second figure shows CBO’s projections of federal spending on the Medicaid expansion and how CBO’s most recent projection of the cost are substantially above previous expectations.
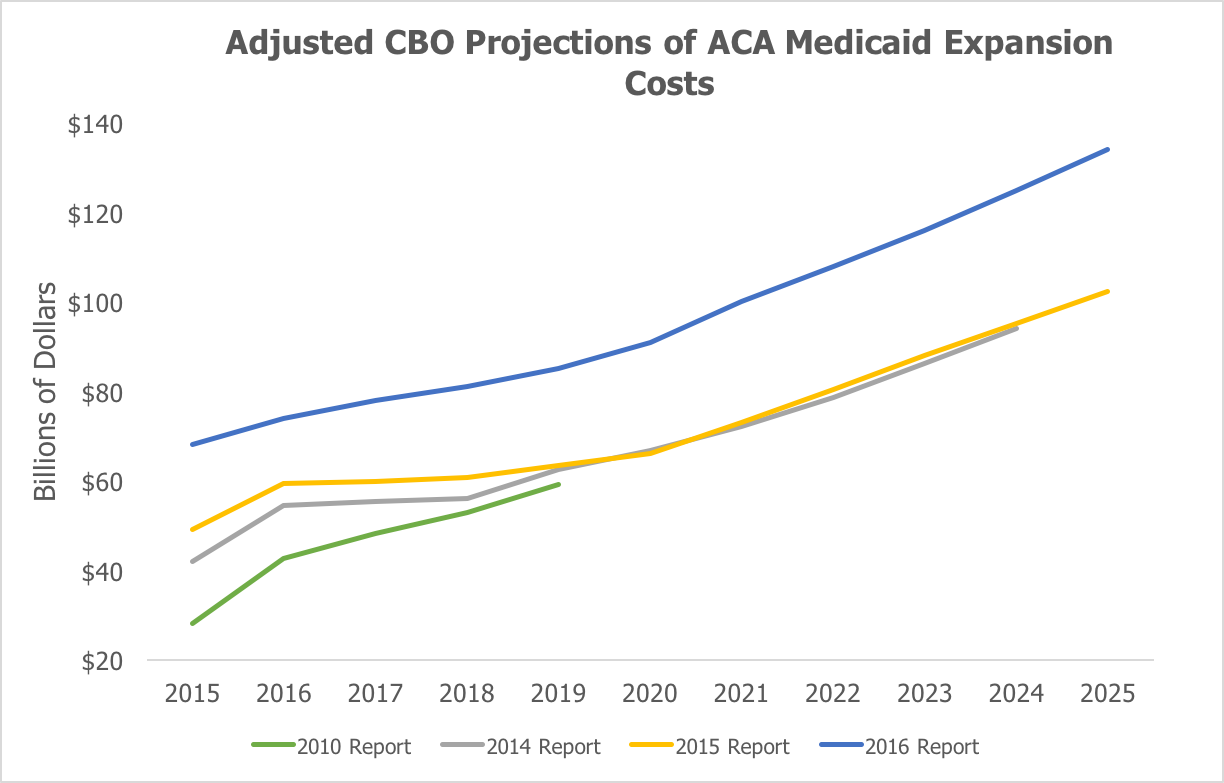


Using CBO’s current projections of state adoption of the expansion for its previous estimates shows that federal Medicaid spending between 2016 and 2024 is $232 billion in excess of its April 2014 estimates.

Both figures adjust CBO’s previous year estimates for its current assumptions about state adoption of the expansion. CBO now expects states to adopt the expansion at a slower rate than it has previously projected. In 2010, before the Supreme Court made Medicaid expansion optional for states, CBO expected all states would adopt the expansion. This adjustment allows for a better comparison of enrollment and spending because it holds constant CBO’s assumptions about the percentage of the newly eligible Medicaid population residing in expansionary states.

Too Little Value from Medicaid Expansion

Prior to the ACA, when states shouldered their traditional share of Medicaid spending (an average of 43%), only Vermont and the District of Columbia concluded that the tradeoffs—higher state taxes and reduced spending elsewhere—justified expanding Medicaid to the ACA expansion population. It turns out that states that did not expand Medicaid prior to the ACA almost certainly made a wise cost-benefit calculation.

A 2015 study from economists at Harvard, MIT, and Dartmouth, assessing an earlier Medicaid expansion in Oregon to a similar population to the ACA expansion, found that “[a]cross a variety of alternative specifications … Medicaid’s value to recipients is lower than the government’s costs of the program, and usually substantially below.” They estimated that the “welfare benefit to recipients from Medicaid per dollar of government spending range from about $0.2 to $0.4.” Oregon Medicaid expansion enrollees did not have significant improvements in blood pressure, cholesterol, or blood sugar relative to people who did not enroll in Medicaid.

Reform Medicaid, Stop Viewing Program as Economic Stimulus

In order to increase the value that enrollees receive from Medicaid and lessen the amount lost to waste, fraud, and abuse, it is necessary to change the central incentives underlying the federal-state partnership. In particular, the incentives of the ACA’s elevated reimbursement rate lead policymakers to view Medicaid as an engine for economic stimulus instead of as a welfare program. For example, according to the White House:

“By expanding Medicaid, States can pull billions in additional Federal funding into their economies every year, with no State contribution over the next three years and only a modest one thereafter for coverage of newly eligible people.”

A study by Deloitte Consulting and the University of Louisville projects that the ACA’s Medicaid expansion will add 40,000 jobs and $30 billion to Kentucky’s economy through 2021. The problem with this and similar studies is that they assess the decision of a state in isolation without factoring in other states’ decisions regarding expansion. For example, Kentucky is worse off when other states expand, because her citizens pay federal taxes to finance health benefits that accrue only to individuals in those other states.

Economist Robert Book points out that the American economy is worse from the ACA expansion “because taxation itself has a negative effect on economic activity, over and above the amount of tax collected.” Book estimates a reduction of $174 billion in economic activity over a 10-year period if all states expand Medicaid. He also estimated a total job loss of more than 200,000 positions from 2014 to 2017 if all states expanded Medicaid.

Sensible Medicaid reform has two central goals: reduce the unsustainable trajectory of spending and produce better outcomes for people most in need. The ACA Medicaid expansion significantly adds to the unsustainable spending trajectory of the program, likely fails to produce health outcomes or value to recipients worth the corresponding cost, and creates a large federal government bias toward nondisabled, working-age adults at the expense of traditional Medicaid enrollees. Moving Medicaid back in the right direction requires ending the ACA’s elevated federal reimbursement rate that has given rise to these problems."

Wednesday, May 24, 2017

Allan Meltzer Meltzer’s history book found that the Fed had rarely come up with just the right medicine for the economy

See Allan Meltzer Made a Career as the Chief Scourge of Financial Regulators: Professor wrote 2,100 pages on Fed history and found little to admire. Obituary from the WSJ. By James R. Hagerty. Excerpts:
"Allan Meltzer devoted a large share of his scholarly life to telling the Federal Reserve and other financial regulators, politely but firmly, that they were falling down on the job.

Dr. Meltzer’s two-volume history of the U.S. central bank, stretching beyond 2,100 pages, found that the Fed had rarely come up with just the right medicine for the economy. He chastised Fed officials for paying too much heed to the “daily yammering” of financial markets and too little to the long-term health of the economy.

The Carnegie Mellon University economist also was a co-founder of the Shadow Open Market Committee, a gathering of monetarists and mavericks who since 1973 have advised and second-guessed the Fed.

Through his books and articles, Dr. Meltzer became an influential opponent of what he saw as excessive regulation of banks and of bailouts for those that misbehaved. If banks were allowed to fail, he argued, shareholders and executives would learn to be more prudent. “Capitalism without failure is like religion without sin,” he often said.

Dr. Meltzer died May 8 of pneumonia at a hospital in Pittsburgh. He was 89."

"He evolved into a libertarian. Capitalism, he wrote in one essay, “works well with people as they are, not as someone would like to make them.”"

"At the University of California, Los Angeles, he earned master’s and doctoral degrees in economics."
"In 1957, he joined the faculty of what is now Carnegie Mellon in Pittsburgh."
"He was on the President’s Economic Policy Advisory Board during the Reagan administration and served as a consultant to congressional committees, the U.S. Treasury and foreign central banks. In 1999 and 2000, he headed a congressional panel seeking to improve the performance of the World Bank and International Monetary Fund.

His astoundingly deep dive into Fed history began in 1963 when U.S. Rep. Wright Patman, a Texas Democrat, asked him to do a study of the institution. His original studies “were hastily written to meet congressional deadlines,” he wrote. He kept digging and spent 14 years writing a history of the Fed. In 2003, The Wall Street Journal declared his first volume “masterly.” Former Fed Chairman Alan Greenspan wrote in the preface that the history was “fascinating and valuable.”

During the Depression of the 1930s, the Fed failed to prevent a steep fall in the money supply, missing a chance to alleviate the crisis, Dr. Meltzer found. Later errors by the central bank made inflation worse and contributed to the housing market collapse that helped precipitate the 2008-09 recession, he wrote.

Though he thought the Fed was usually too concerned with the short term, he said one exception was the fight led by Fed Chairman Paul Volcker against inflation in the early 1980s. Mr. Volcker “pursued a long-term strategy…knowing that it wasn’t going to happen in the next quarter,” Dr. Meltzer said during a panel discussion in 2010."

"Dr. Meltzer loathed the proliferation of regulations. Financial firms would sneak around them, and market changes would soon render the rules obsolete, he wrote. A wiser approach, he said, would be to require higher capital ratios for larger banks. That would deter banks from growing into behemoths deemed too big to fail, Dr. Meltzer said. If bankers “make the wrong calls,” he said in one interview, they and their shareholders “must be made to pay the price themselves.”

He worried about U.S. budget deficits and unfunded obligations. “At the city, state and federal government, we’ve promised people things that we aren’t going to be able to do,” he said in a presentation on one of his books. “We’re going to have to take away things that have been promised….We’re going to have higher tax rates and we’re going to have less spending.”

He deplored the congressional habit of leaving details to regulatory agencies. “Much regulation has the effect of replacing the rule of law with arbitrary decisions by lawyers and bureaucrats,” he wrote in a 2012 book, “Why Capitalism.”

Regulators were gaining too many powers to regulate as they saw fit, undermining the rule of law, he warned."

America’s trade deficit isn’t nearly as large as the official figures suggest because of where companies report their profits

See The True Trade Deficit: Halving the official figure gets closer to the truth, as the iPhone example shows by Martin Neil Baily and Adam Looney in the WSJ. They both are senior fellows at the Brookings Institution. Excerpts:
"Protectionists like to cite the U.S. trade deficit—last year imports of goods and services exceeded exports by $501 billion—as evidence that unfair trade agreements have hurt American competitiveness. But a new working paper from the Bureau of Economic Analysis, published in March, challenges this narrative: Turns out, America’s trade deficit isn’t nearly as large as the official figures suggest.

To illustrate this finding, the economists Fatih Guvenen, Raymond Mataloni, Dylan Rassier and Kim Ruhl examine the iPhone. The device is said to be “Designed by Apple in California. Assembled in China.” Yet to lower its tax bill, Apple reports that its iPhone profits were earned in neither place, but were instead accrued in some other country.

Assume an iPhone is assembled in China for $250 and sells in Europe and the U.S. for $750. Apple’s profit is $500. Often that economic value gets attributed to an Apple subsidiary set up in a low-tax nation like Ireland or Luxembourg.

If most iPhone development is actually done in California, most of the $500 represents American production and should be included in U.S. gross domestic product. Then, when an iPhone is sold in Europe, that value should count as an export from the U.S. When a phone is instead sold in the U.S., the net amount of the import should only be the $250 cost of manufacturing in Asia, since the rest is produced by Californians.

With this in mind, the study’s authors estimate how much American trade is mismeasured. Although the official trade deficit in 2012 was $537 billion, they conclude that U.S. exports were undercounted and imports overstated by a combined $280 billion. With this adjustment, the real trade deficit that year shrinks to $257 billion—or about 1.6% of GDP. Trade still isn’t balanced, but the deficit appears to be less than half the size everyone thought.

In other words, more than half the goods and services that were counted in the U.S. trade deficit actually were produced right here in America. This makes it harder to argue that an outsize trade deficit is responsible for American manufacturing’s woes. It’s true that traditional blue-collar workers have had trouble competing globally. But high-skilled American workers and the companies that employ them have been competing just fine."

Tuesday, May 23, 2017

Between 1960 and 2015, the population grew by 142%, from 3.035 billion to 7.35 billion. Yet commodity prices fell.

See Why the human brain is our most precious commodity by Marian L. Tupy of HumanProgress.org.
"Between 1960 and 2015, world population increased by 142 per cent, rising from 3.035 billion to 7.35 billion. During that time, average income per capita adjusted for inflation increased by 177 per cent, rising from $3,680 to $10,194. Moreover, after 56 years of human use and exploration, the vast majority of the commodities tracked by the World Bank are cheaper than they used to be – either absolutely or relative to income. That was not supposed to have happened.

According to conventional wisdom, population growth was to be a harbinger of poverty and famine. Yet, human beings, unlike other animals, innovate their way out of scarcity by increasing the supply of natural resources or developing substitutes for overused resources. Human ingenuity, in other words, is “the ultimate resource” that makes all other resources more plentiful.

Earlier this year, the World Bank updated its Pink Sheet, which tracks the prices of 72 commodities going back (in most cases) to 1960. I have eliminated some repetitive datasets and some datasets that contained data for only very short periods of time. I was left with 42 commodity prices, which are included in the chart below.


As can be seen, out of the 42 distinct commodity prices measured by the World Bank, 19 have declined in absolute terms. In other words, adjusted for inflation, they were cheaper in 2016 than in 1960. Twenty-three commodities have increased in price over the last 56 years. However, of those 23 commodities, only three (crude oil, gold and silver) appreciated more than income. In a vast majority of cases, therefore, commodities became cheaper either absolutely or relatively.

Figure 1: Worldwide Commodity Prices, Population and Income, 1960-2016

It is often assumed that population growth must inevitably result in the exhaustion of natural resources, environmental destruction and even mass starvation. Take, for example, The Limits to Growth report, which was published by the Club of Rome in 1972.  Based on MIT computer projections, the report looked at the interplay between industrial development, population growth, malnutrition, the availability of nonrenewable resources and the quality of the environment. It concluded:
 “If present growth trends in world population, industrialization, pollution, food production, and resource depletion continue unchanged, the limits to growth on this planet will be reached sometime within the next 100 years… The most probable result will be a rather sudden and uncontrollable decline in both population and industrial capacity… Given present resource consumption rates and the projected increase in these rates, the great majority of currently nonrenewable resources will be extremely expensive 100 years from now.”
It has been 45 years since the publication of The Limits to Growth. So far, the dire predictions of the Club of Rome have not come to pass. On the contrary, we have seen an overall decline of commodity prices relative to income – in spite of a growing global population.

Can this happy trend continue for another 55 years and beyond? To get a glimpse of the future, we must first understand the concept of scarcity.

Scarcity or “the gap between limited – that is, scarce – resources and theoretically limitless wants”, is best ascertained by looking at prices. A scarce commodity goes up in price, while a plentiful commodity becomes cheaper. That was the premise of a famous bet between Stanford University Professor Paul Ehrlich and University of Maryland Professor Julian Simon. Ehrlich shared the gloomy predictions of the Club of Rome.

In his best-selling 1968 book The Population Bomb, Ehrlich reasoned that over-population would lead to exhaustion of natural resources and mega-famines. “The battle to feed all of humanity is over. In the 1970s hundreds of millions of people will starve to death in spite of any crash programs embarked upon now. At this late date nothing can prevent a substantial increase in the world death rate,” he wrote.

Simon, in contrast, was much more optimistic. In his 1981 book The Ultimate Resource, Simon used empirical data to show that humanity has always gotten around the problem of scarcity by increasing the supply of natural resources or developing substitutes for overused resources. Human ingenuity, he argued, was “the ultimate resource” that would make all other resources more plentiful.

In 1980, the two thinkers agreed to put their ideas to a test. As Ronald Bailey wrote in his 2015 book The End of Doom: Environmental Renewal in the 2lst Century:
 “In October 1980, Ehrlich and Simon drew up a futures contract obligating Simon to sell Ehrlich the same quantities that could be purchased for $1,000 of five metals (copper, chromium, nickel, tin, and tungsten) ten years later at inflation-adjusted 1980 prices. If the combined prices rose above $1,000, Simon would pay the difference. If they fell below $1,000, Ehrlich would pay Simon the difference. Ehrlich mailed Simon a check for $576.07 in October 1990. There was no note in the letter. The price of the basket of metals chosen by Ehrlich and his cohorts had fallen by more than 50 percent. The cornucopian Simon won.”
Simon’s critics, Ehrlich included, have since argued that Simon got lucky. Had his bet with Ehrlich taken place over a different decade, the outcome might have been different. Between 2001 and 2008, for example, the world had experienced an unprecedented economic expansion that dramatically increased the price of commodities.

True, but Simon’s thesis does not have to account for price fluctuations that are heavily influenced by the ups and downs of the global economy as well as disruptive government policies (e.g., oil crises in 1973 and 1979). Rather, Simon posited that as a particular resource becomes scarcer, its price will increase and that will incentivize people to discover more of the resource, ration it, recycle it, or develop a substitute.

Commodity prices, academic research suggests, move in so-called “super-cycles,” lasting between 30 and 40 years. During periods of high economic growth, demand for commodities increases. When that happens, commodities go up in price. It is during this period that high commodity prices encourage the discovery of new supplies and the invention of new technologies. Once economic growth slows down, prices of “now copiously supplied commodities fall”.

Accordingly, the current commodity cycle seems to have peaked in 2008. In June 2008, for example, the price of West Texas Intermediate crude oil peaked at $154 per barrel. By January 2016 it stood at $29 (both figures are in inflation adjusted 2016 US dollars). The once-high price of oil has led to hydraulic fracturing, which has revolutionized the oil industry. Today, “fracking” continues to enable us to access previously inaccessible oil reserves in record volumes. In fact, humanity is yet to run out of a single “non-renewable” resource.

Unfortunately, many people, including Paul Ehrlich, and many organizations, including the Club of Rome, believe that the answer to scarcity is to limit consumption of natural resources. In reality, consumption limits are unpopular and difficult to enforce. More often than not, their effects fall hardest on the most vulnerable. A switch from fossil fuels to “renewable” sources of energy, for example, has increased the price of gas and electricity in many European countries to such extent that a new term – energy poverty – had to be coined.

According to the German magazine Der Spiegel, “Germany’s aggressive and reckless expansion of wind and solar power has come with a hefty price tag for consumers, and the costs often fall disproportionately on the poor.”  In democracies, such policies are, in the long run, unsustainable. More important is the fact that they are unnecessary, because real solutions to future scarcity are more likely to come from innovation and technological change.

I do not mean to trivialize the challenges that humanity faces or imply that we will be able to solve all of the problems ahead. Instead, I want to suggest that human brain, the ultimate resource, is capable of solving complex challenges. We have done so with disease, hunger and extreme poverty, which have all fallen to historical lows, and we can do so with respect to the use of natural resources as well."

How British Columbia cut regulations by almost 30 percent & turned its economy around

See Using Regulatory Reform to Boost Growth by James Broughel of Mercatus. Excerpts:
"Regulatory reform could be a form of low-hanging fruit to boost growth at a time when state and federal budgets are pinched. The experience of the Canadian province of British Columbia offers a model for how this can be done. In 2001, the province began a red tape cutting effort, with a goal of reducing regulatory requirements by a third within three years. In June of 2001, the province had 382,139 requirements in place. By March of 2004, that number had fallen to 268,699—a decline of almost exactly 30 percent.

As the first chart illustrates, in the years leading up to the reform, British Columbia was experiencing a “dismal decade”—a phrase used to describe the sluggish economy in the province around that time. Real GDP in the province grew, on average, 1.9 percent less than Canada’s between 1994 and 2001. Meanwhile, growth shot up in the years after the reform began. British Columbia experienced a rebound, and growth was 1.1 percent higher per year, on average, than Canada’s between 2002 and 2006.

The absolute numbers make British Columbia’s improvement in economic performance more clear, as the second chart shows. In the 1994–2001 period, real GDP grew on average by 2.6 percent per year; this jumped to 3.8 percent in the 2002–2006 period. This difference is statistically significant (p=.08). A difference of just over one percentage point in growth might not sound like a lot, but consider the following: An economy that grows at 1 percent per year will double in size roughly every 70 years, but an economy growing at 2 percent takes half the time to double—just 35 years. An economy growing at 4 percent will double GDP in a mere 18 years."

Monday, May 22, 2017

Wind Power Is Providing Very Little Of The World's Energy With Some Serious Uwnanted And Unintended Consequences

"The Global Wind Energy Council recently released its latest report, excitedly boasting that ‘the proliferation of wind energy into the global power market continues at a furious pace, after it was revealed that more than 54 gigawatts of clean renewable wind power was installed across the global market last year’.
You may have got the impression from announcements like that, and from the obligatory pictures of wind turbines in any BBC story or airport advert about energy, that wind power is making a big contribution to world energy today. You would be wrong. Its contribution is still, after decades — nay centuries — of development, trivial to the point of irrelevance.

Even put together, wind and photovoltaic solar are supplying less than 1 per cent of global energy demand. From the International Energy Agency’s 2016 Key Renewables Trends, we can see that wind provided 0.46 per cent of global energy consumption in 2014, and solar and tide combined provided 0.35 per cent. Remember this is total energy, not just electricity, which is less than a fifth of all final energy, the rest being the solid, gaseous, and liquid fuels that do the heavy lifting for heat, transport and industry.

[One critic suggested I should have used the BP numbers instead, which show wind achieving 1.2% in 2014 rather than 0.46%. I chose not to do so mainly because that number is arrived at by falsely exaggerating the actual output of wind farms threefold in order to take into account that wind farms do not waste two-thirds of their energy as heat; also the source is an oil company, which would have given green blobbers a excuse to dismiss it, whereas the IEA is unimpleachable But it's still a very small number, so it makes little difference.]

Such numbers are not hard to find, but they don’t figure prominently in reports on energy derived from the unreliables lobby (solar and wind). Their trick is to hide behind the statement that close to 14 per cent of the world’s energy is renewable, with the implication that this is wind and solar. In fact the vast majority — three quarters — is biomass (mainly wood), and a very large part of that is ‘traditional biomass’; sticks and logs and dung burned by the poor in their homes to cook with. Those people need that energy, but they pay a big price in health problems caused by smoke inhalation.

Even in rich countries playing with subsidised wind and solar, a huge slug of their renewable energy comes from wood and hydro, the reliable renewables. Meanwhile, world energy demand has been growing at about 2 per cent a year for nearly 40 years. Between 2013 and 2014, again using International Energy Agency data, it grew by just under 2,000 terawatt-hours.

If wind turbines were to supply all of that growth but no more, how many would need to be built each year? The answer is nearly 350,000, since a two-megawatt turbine can produce about 0.005 terawatt-hours per annum. That’s one-and-a-half times as many as have been built in the world since governments started pouring consumer funds into this so-called industry in the early 2000s.

At a density of, very roughly, 50 acres per megawatt, typical for wind farms, that many turbines would require a land area [half the size of] the British Isles, including Ireland. Every year. If we kept this up for 50 years, we would have covered every square mile of a land area [half] the size of Russia with wind farms. Remember, this would be just to fulfil the new demand for energy, not to displace the vast existing supply of energy from fossil fuels, which currently supply 80 per cent of global energy needs. [para corrected from original.]

Do not take refuge in the idea that wind turbines could become more efficient. There is a limit to how much energy you can extract from a moving fluid, the Betz limit, and wind turbines are already close to it. Their effectiveness (the load factor, to use the engineering term) is determined by the wind that is available, and that varies at its own sweet will from second to second, day to day, year to year.

As machines, wind turbines are pretty good already; the problem is the wind resource itself, and we cannot change that. It’s a fluctuating stream of low–density energy. Mankind stopped using it for mission-critical transport and mechanical power long ago, for sound reasons. It’s just not very good.
As for resource consumption and environmental impacts, the direct effects of wind turbines — killing birds and bats, sinking concrete foundations deep into wild lands — is bad enough. But out of sight and out of mind is the dirty pollution generated in Inner Mongolia by the mining of rare-earth metals for the magnets in the turbines. This generates toxic and radioactive waste on an epic scale, which is why the phrase ‘clean energy’ is such a sick joke and ministers should be ashamed every time it passes their lips.

It gets worse. Wind turbines, apart from the fibreglass blades, are made mostly of steel, with concrete bases. They need about 200 times as much material per unit of capacity as a modern combined cycle gas turbine. Steel is made with coal, not just to provide the heat for smelting ore, but to supply the carbon in the alloy. Cement is also often made using coal. The machinery of ‘clean’ renewables is the output of the fossil fuel economy, and largely the coal economy.

A two-megawatt wind turbine weighs about 250 tonnes, including the tower, nacelle, rotor and blades. Globally, it takes about half a tonne of coal to make a tonne of steel. Add another 25 tonnes of coal for making the cement and you’re talking 150 tonnes of coal per turbine. Now if we are to build 350,000 wind turbines a year (or a smaller number of bigger ones), just to keep up with increasing energy demand, that will require 50 million tonnes of coal a year. That’s about half the EU’s hard coal–mining output.

Forgive me if you have heard this before, but I have a commercial interest in coal. Now it appears that the black stuff also gives me a commercial interest in ‘clean’, green wind power.

The point of running through these numbers is to demonstrate that it is utterly futile, on a priori grounds, even to think that wind power can make any significant contribution to world energy supply, let alone to emissions reductions, without ruining the planet. As the late David MacKay pointed out years back, the arithmetic is against such unreliable renewables.

MacKay, former chief scientific adviser to the Department of Energy and Climate Change, said in the final interview before his tragic death last year that the idea that renewable energy could power the UK is an “appalling delusion” -- for this reason, that there is not enough land.

The truth is, if you want to power civilisation with fewer greenhouse gas emissions, then you should focus on shifting power generation, heat and transport to natural gas, the economically recoverable reserves of which — thanks to horizontal drilling and hydraulic fracturing — are much more abundant than we dreamed they ever could be. It is also the lowest-emitting of the fossil fuels, so the emissions intensity of our wealth creation can actually fall while our wealth continues to increase. Good.

And let’s put some of that burgeoning wealth in nuclear, fission and fusion, so that it can take over from gas in the second half of this century. That is an engineerable, clean future. Everything else is a political displacement activity, one that is actually counterproductive as a climate policy and, worst of all, shamefully robs the poor to make the rich even richer."