Wednesday, July 31, 2019

World Bank Study Finds That Deregulation Reduces Extreme Poverty

By Craig Eyermann of the Independent Institute.
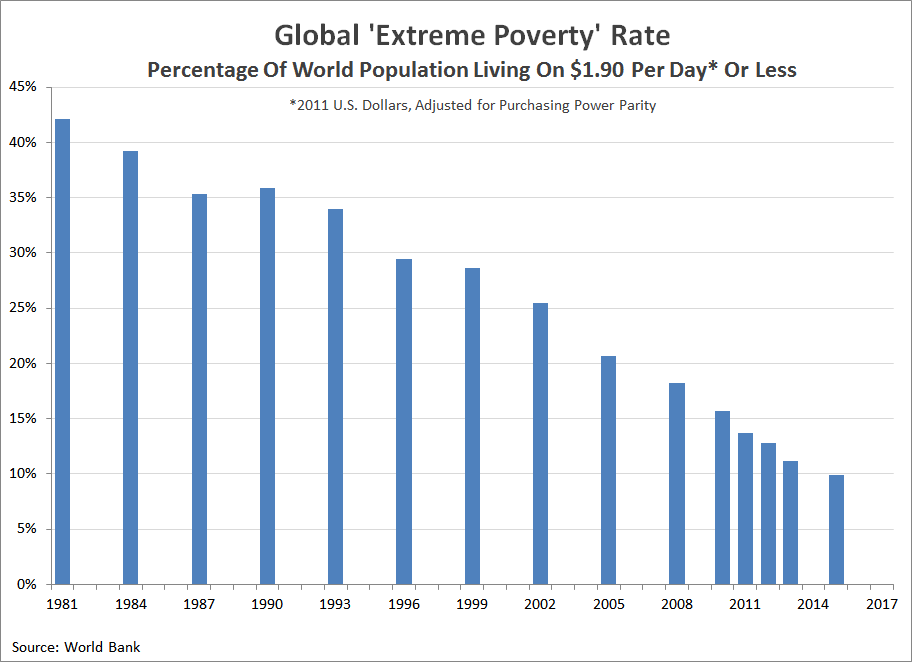
"Regardless of where you might live around the world, if you live on less than $2 a day, you would be considered to be living in extreme poverty.

According to the World Bank, in 2015 about 736 million people around the world, or just under 10 percent of the world’s population, had incomes that put them below this international poverty line. Believe it or not, that is extraordinarily good news because poverty rates around the world have fallen dramatically since 1981 when 42 percent of the world’s population lived on an inflation-adjusted $1.90 or less per day.


Global 'Extreme Poverty' Rate, 1981-2015

World Bank economists studying a portion of this decline in the nine years from 2005 through 2013, when the extreme poverty rate was cut nearly in half from 21 percent to 11 percent, have discovered that much of this reduction in global poverty came about because of deregulation, as governments around the world have been reducing the regulatory burdens they impose on their citizens.
Using panel data for 189 economies from 2005 to 2013, this paper shows that business-friendly regulations are correlated with the poverty headcount at the country level. This association is significant using the World Bank’s Doing Business indicators on getting credit and contract enforcement. The findings suggest that the conduit for poverty reduction is business creation, as a source of new jobs and a manifestation of thriving entrepreneurship.
Regulations can restrict the ability of individuals to find jobs or start businesses because politicians and bureaucrats often write them to benefit the interests of large, established interests, who would rather not have to compete for business in a free market.

This crony socialism benefits these special interests in two ways. First, by using the power of government to impose disproportionately large costs upon their smaller, less politically connected competition, they can keep their smaller competitors from being able to effectively challenge their interests.

Second, in the reduced competition environment that government regulation fosters, they can charge higher prices than they otherwise could, where they only need to provide the politicians and bureaucrats who write the rules a small cut of the action so they can fund their political campaigns to stay in power. Never mind the effect that has on the cost of living in the regimes where the regulations hold sway or the trust that people have in their political and economic institutions.

Historically in much of the world, the yoke of regulatory burden has contributed to the impoverishment of billions. Reducing that burden by lifting the heavy hand of government regulation has successfully diminished extreme poverty around the world in recent decades. It’s a lesson that everyone should learn."

Renewables and austerity can't decarbonise

See A pledge to abolish sin by Matt Ridley. Excerpt:
"In Britain last year, generously using the Final Energy Consumption metric, 4 per cent of energy came from wind and solar, 3 per cent from nuclear and less than 1 per cent from hydro, the three zero-carbon sources. The common misconception that wind and solar are bigger contributors comes from forgetting that electricity is just 20 per cent of energy: the rest is heat, transport and industry.

So eliminating carbon dioxide from the energy sector has hardly begun, yet the cost is already huge and bearing down especially on poorer people, while, as Professor Dieter Helm of Oxford University has pointed out, industry is voting with its feet and taking its emissions to China and elsewhere. It was not true that Britain did without coal recently: a grid interconnector was bringing electricity from Dutch coal-fired power stations, and industry was burning coal imported from Russia. (I hereby declare my indirect interest in a Northumberland coal mine.)

Even if we could figure out a way to run aeroplanes on electricity, or to use less coal to make steel (it takes a heap of coal to make a wind turbine), and even if we were to find a way to make solar and wind power available on demand, there just is not enough space either on land or sea to power and heat the British economy from these low-density sources, not without ruining the entire countryside: a point frequently made by the late Sir David MacKay, chief scientist at the Department of Energy.

The “extinction” protesters say we can do without meat, or foreign holidays. To Tories flirting with this kind of energy rationing policy, good luck at the ballot box – look what has happened recently in Australia, France and America to politicians who promised to push up energy prices to save the climate.

The people in denial in this debate are the ones who think we could reach a 2050 net-zero target with a mixture of renewable energy and hair-shirt austerity. Nor is nuclear ready to help without massive public subsidy. Fortunately, there may be another way, one that Boris Johnson should seize to put clear turquoise water between himself and green dreamers.

For the foreseeable future, fossil fuels will be crucial to sustaining civilisation. A way must be found to use oil and gas, but capture their carbon dioxide emissions – and have the industry do something more than signal its regret; to be part of the solution, rather than most of the problem. The technology for sequestering carbon dioxide, still hopeless a few years ago, is now progressing in Norway, Canada and Texas. Britain has a golden opportunity because the North Sea oil industry has left a network of pipes and wells ideal for injecting carbon dioxide into rocks, where it slowly dissolves. Government is on the hook for some of the decommissioning cost anyway.

What is needed, though, is not some taxpayer-funded boondoggle to pick a winner in carbon capture – because that approach usually picks the most politically well-connected loser instead – but the setting up of a market mechanism to discover innovative technologies.

Professors Stuart Haszeldine of Edinburgh University and Myles Allen of Oxford University argue that government should make all fossil energy producers and importers pay a small but increasing fee per tonne of carbon dioxide, not into the insatiable maw of the Treasury, nor into vague tree-planting scams, but into actual carbon-capture projects that work. Fierce competition would ensue to deliver technologies that capture and, crucially, store carbon for the least cost."

Tuesday, July 30, 2019

U.S. Air Quality Continues to Improve (criteria pollutants decreased by 74 percent between 1970 and 2018)

From Institute For Energy Research
"The Environmental Protection Agency (EPA) released its 2019 report on Our Nation’s Air that details the levels of criteria pollutants that exist in our air, which have decreased by 74 percent between 1970 and 2018. Criteria pollutants are precursors of acid rain and are a cause of detrimental diseases such as asthma. During this period, the U.S. economy increased 275 percent, energy consumption increased almost 50 percent, Americans drove more miles, and population increased.

Pollutants Over Time
Source: Environmental Protection Agency
Criteria Pollutants

The Clean Air Act requires EPA to set national ambient air quality standards (NAAQS) for specific pollutants to safeguard human health and the environment. EPA established standards for six common air pollutants, which are referred to as “criteria” pollutants. They are called “criteria” pollutants because the EPA sets the criteria for permissible levels. The six criteria pollutants are:
  • Carbon monoxide (CO)
  • Lead (Pb)
  • Nitrogen dioxide (NOx)
  • Ozone (O3)
  • Particulate matter (PM2.5 and PM10)
  • Sulfur dioxide (SO2)
Between 1970 and 2018, the combined emissions of the six common declined by 74 percent, while the economy increased by 275 percent, energy consumption increased by 49 percent, vehicles miles traveled increased by 191 percent, and population increased by 60 percent—a noteworthy achievement.

America’s improving air quality is an untold success story. Even before Congress passed the Clean Air Act Extension of 1970, air quality had been improving for decades. And since 1970, that improvement has continued with the six criteria pollutants declining significantly, even though the generation of electricity from coal-fired plants has increased by 63 percent and the generation of electricity from natural gas-fired plants has increased by almost 300 percent.

According to the Energy Information Administration, sulfur dioxide emissions from U.S. power plants were reduced by 82 percent between 2007 and 2017, and nitrogen oxide emissions were reduced by 58 percent. These pollutants are the principal pollutants that cause acid precipitation (colloquially known as acid rain). Their emissions react with water vapor and other chemicals in the air to form acids that fall back to earth. Prior to controlling for these emissions, power plants produced most (about two-thirds) of the sulfur dioxide emissions in the United States. About 50 percent of nitrogen oxide emissions came from cars, buses, trucks, and other forms of transportation, with power plants contributing about 25 percent. The remainder came from other sources, such as industrial and commercial boilers.

According to the EPA, between 1990 and 2018, the criteria pollutants in the United States declined significantly as follows:
  • Carbon Monoxide (CO) 8-Hour, 74 percent
  • Lead (Pb) 3-Month Average, 82 percent (from 2010)
  • Nitrogen Dioxide (NO2) Annual, 57 percent
  • Nitrogen Dioxide (NO2) 1-Hour, 50 percent
  • Ozone (O3) 8-Hour, 21 percent
  • Particulate Matter 10 microns (PM10) 24-Hour, 26 percent
  • Particulate Matter 2.5 microns (PM5) Annual, 39 percent (from 2000)
  • Particulate Matter 2.5 microns (PM5) 24-Hour, 34 percent (from 2000)
  • Sulfur Dioxide (SO2) 1-Hour, 89 percent
Technology Matters

The huge reductions in criteria pollutants have come about mainly because technology was developed at reasonable cost to reduce these elements from fossil-fired generating plants. Flue gas desulfurization units (scrubbers), electrostatic precipitators, fabric filters (baghouses), select catalytic reduction systems, advanced carbon injection systems, and direct sorbent injection systems have reduced sulfur dioxide and nitrogen dioxide emissions.

Furthermore, new generating technologies such as supercritical coal-fired power plants being built in China and in other countries substantially reduce these pollutants. China has been building cleaner coal plants for a decade or so, at a time when government policies such as the Obama administration’s “War on Coal” precluded the effective construction of new and cleaner coal plants in the United States. As a consequence, China, and not the United States, is building the lion’s share of new supercritical coal-fired plants around the world.

Conclusion

The United States has cleaner air now than in the past. Legislation (e.g., the Clean Air Act and its amendments) has contributed to longstanding pollutant reductions trends. In the power sector, technology has made this possible, reducing pollutant levels at a reasonable cost that has enabled electricity to remain affordable."

AP FACT CHECK: Some inconvenient truths for 2020 Democrats

By CALVIN WOODWARD, AMANDA SEITZ AND HOPE YEN.

"The Democratic presidential contenders have some inconvenient truths to grapple with.

It's not easy, for example, to summon foreboding words on the economy — accurately — when the U.S. has been having its longest expansion in history.

Health care for all raises questions of costs to average taxpayers that the candidates are loath to confront head on.

And in slamming President Donald Trump relentlessly for his treatment of migrants, the Democrats gloss over the record of President Barack Obama (and his vice president, Joe Biden), whose administration deported them by the millions and housed many children in the border "cages" they assail Trump for using now.

The candidates will be pressed on the economy, health care, immigration and much more in their second round of debates, this week in Detroit.

A sampling of the campaign rhetoric on a variety of subjects and how it compares with the facts:

THE CAGES

KAMALA HARRIS: "You look at the fact that this is a president who has pushed policies that's been about putting babies in cages at the border in the name of security when in fact what it is, is a human rights abuse being committed by the United States government." — remarks at NAACP forum Wednesday in Detroit.

PETE BUTTIGIEG: "We should call out hypocrisy when we see it. For a party that associates itself with Christianity to say it is OK to suggest that God would smile on the division of families at the hands of federal agents, that God would condone putting children in cages," that party "has lost all claim to ever use religious language." — June debate .

THE FACTS: There is hypocrisy to be called out here.

By Buttigieg's standard, the Democratic Party has also lost its claim to invoke religion — because the "cages" were built and used by the Obama administration. Harris, a California senator, calls them a human rights abuse, but, like other Democrats, solely blames Trump.

The facilities are sectioned-off, chain-link indoor pens where children who come to the border without adults or who are separated from adults in detention are temporarily housed. The children are divided by age and sex.

A year ago, Associated Press photographs showing young people in such enclosures were misrepresented online as depicting child detentions by Trump and denounced by some Democrats and activists as illustrating Trump's cruelty. In fact, the photos were taken in 2014 during the Obama administration.

Many Democrats continue to exploit the imagery of "babies in cages" — as Harris put it — without acknowledging Obama used the facilities, too. His administration built the McAllen, Texas, center with chain-link holding areas in 2014.

Under Trump, journalists have witnessed migrants crowded into fetid chain-link quarters. The maltreatment of migrants is the responsibility of the Trump administration — and arguably Congress, for not approving more money for better care.

But the facilities are standard fare through administrations and the caged-babies accusations stand as one of the most persistent distortions by the 2020 Democrats.
___
JOE BIDEN: "Under Trump, there have been horrifying scenes at the border of kids being kept in cages, tear-gassing asylum seekers, ripping children from their mothers' arms." — June 24 opinion piece in the Miami Herald about his Latin America policy.

THE FACTS: Again, the scenes of kids in cages go back to the administration Biden served.

He is correct that U.S. authorities have fired tear gas to repel migrants trying to get across the border. Biden and other Democrats are also correct in identifying widespread family separations as a consequence of Trump's policy. His now-suspended zero-tolerance policy resulted in thousands of children being removed from their parents in holding centers, something the Obama administration did not do routinely.

Another form of family separation was seen, however, in the Obama years. The record deportation of 3 million migrants during Obama's presidency drove many families apart as some members were forced out of the U.S. while loved ones weren't.

IMMIGRATION

BIDEN: "There's 11 million undocumented (people), they've increased the solvency of the Social Security system by 12 years, because they're all paying in." — candidate forum in Iowa, July 16.

THE FACTS: He's wrong that "all" people in the country illegally are paying into Social Security and that they've extended the program's solvency by a dozen years.

He's right, though, that they help the nation's retirement program because millions do contribute to it and they are not permitted to draw benefits.

According to a 2013 Social Security Administration report , the most recent of its kind, roughly 3 million immigrants living in the U.S. illegally were contributing to Social Security through their work. Others were not working or were employed in the underground economy.

Biden is correct in suggesting that illegal immigration has significantly boosted the program. His campaign clarified to The Associated Press that he misspoke when he said people in the country illegally increased Social Security's solvency by 12 years. He meant to say they've added $12 billion to Social Security's finances.

They've actually supported the Social Security system by even more than that. The agency's 2013 report estimated the system gained $12 billion from immigrants and their employers over just one year, 2010. Employers and workers evenly split the 12.4 percent contribution to the system.

Another government estimate says "half of undocumented immigrants are working on the books" but that may be outdated; it's from 2005.

HEALTH CARE

BERNIE SANDERS: "'Medicare for All' would reduce overall health care spending in our country." — July 17 speech on his health plan.

THE FACTS: That remains to be seen. Savings from Medicare for All are not a slam dunk.

The nonpartisan Congressional Budget Office said in a report this year that total spending under a single-payer system, such as the one proposed by the Vermont senator, "might be higher or lower than under the current system depending on the key features of the new system."

Those features involve payment rates for hospitals and doctors, which are not fully spelled out by Sanders, as well as the estimated cost of generous benefits that include long-term care services and no copays and deductibles.

Sanders' figure of $5 trillion over 10 years in health cost savings comes from a study by the Political Economy Research Institute at the University of Massachusetts-Amherst. The lead author has been a Sanders political supporter.

Sanders also cites a savings estimate of $2 trillion over 10 years taken from a study from the libertarian Mercatus Center at George Mason University in Virginia. But the author of that study says that Medicare for All advocates are mischaracterizing his conclusions.

A report this year by the nonprofit Rand think tank estimated that Medicare for All would do the opposite of what Sanders is promising, modestly raising national health spending.

Part of the reason is the generous benefits. Virtually free comprehensive medical care would lead to big increases in demand.

The Rand study modeled a hypothetical scenario in which a plan similar to Sanders' legislation had taken effect this year.
___
SANDERS, on the effects of his health plan and other expensive proposals on the public: "Yes, they will pay more in taxes but less in health care." — June debate.

THE FACTS: This is almost surely true.

Although he had to be pressed on the question, Sanders is almost alone among the candidates who support Medicare for All in acknowledging that broadly higher taxes would be needed to pay for it. He would consider — and probably not be able to avoid — a tax increase on the middle class in exchange for health care without copayments, deductibles and the like. It's a given that consumers will pay less for health care if the government is picking up the bills.

Several of Sanders' rivals have dodged the tough financing questions, speaking only of taxing rich people and "Wall Street." Analysts say that's not going to cover the costs of government-financed universal care.
___
ECONOMY

ELIZABETH WARREN: "When I look at the economy today, I see a lot to worry about. ... I see a manufacturing sector in recession. ... A generation of stagnant wages and rising costs for basics like housing, child care, and education (has) forced American families to take on more debt than ever before.... Whether it's this year or next year, the odds of another economic downturn are high — and growing." — Medium blog Monday.

THE FACTS: The Massachusetts senator is exaggerating some of these threats. It's true that U.S. manufacturers are struggling as a result of slower overseas growth and the Trump administration's trade wars, which have meant that many U.S. goods face retaliatory tariffs overseas. But U.S. factories have faced rough spots before during the current expansion, particularly in late 2015 and 2016, when their output actually declined. Yet economic growth continued. Manufacturing is no longer large enough to necessarily pull the rest of the economy into recession.

And Americans are in better financial shape than Warren suggests. While household debt has risen 6.8% in the past decade, that figure isn't adjusted for population growth or inflation. On a per capita basis, household debt levels have actually fallen.

Economists typically compare debt with income as a way of gauging Americans' ability to pay off their loans. Currently such household debt is equivalent to 101% of disposable income. While that number may seem high, it actually peaked at 136% in the fourth quarter of 2007, just as the recession began, and has fallen steadily since.

Also, interest rates are at historically low levels, making it easier for borrowers to manage their debts. Currently, households are devoting less than 10% of their incomes to debt service, down from roughly 13% a decade ago.

As for what she calls a manufacturing recession, that's a judgment call, not a clearly defined standard. Factory output actually has risen slightly over the past year. She defines a manufacturing recession as two straight declines in quarterly production as measured by the Federal Reserve, and that's what happened in the first half of this year.
___
HARRIS: "People are working, they're working two and three jobs. In our America people should only have to work one job to have a roof over their head and be able to put food on their table." — July 12 radio interview.

THE FACTS: Most Americans, by far, only work one job, and the numbers who juggle more than one have declined over a quarter century.

In the mid-1990s, the percentage of workers holding multiple jobs peaked at 6.5%. The rate dropped significantly , even through the Great Recession, and has been hovering for a nearly a decade at about 5% or a little lower. In the latest monthly figures , from June, 5.2% of workers were holding more than one job.

Hispanic and Asian workers are consistently less likely than white and black workers to be holding multiple jobs. Women are more likely to be doing so than men, though the gap narrowed slightly during Trump's first year.

Multiple jobholding rates in June 2019 : women, 5.6%; men, 4.6%; black, 5.1%; white, 5.2%; Hispanic, 3.7%; Asian, 3.0%.

Kirsten Allen, speaking for the Harris campaign, said the senator often hears from people who have to work more than one job to make ends meet, "teachers specifically," and has a plan for teachers to be paid more. But in her rhetoric about Americans "working two and three jobs," Harris does not make that distinction.
___
LAW ENFORCEMENT

BUTTIGIEG: "When I took office, we had no recognizable promotion or accountability system for promotions in the department. We couldn't even find and publish numbers on cases involving use of force. So we started doing that."— at the NAACP forum Wednesday in Detroit.

THE FACTS: Those changes at the South Bend, Indiana, Police Department, which Buttigieg oversees as the mayor, didn't happen swiftly or without prompting.

Buttigieg fired his police chief shortly after he became mayor in 2012 and installed a new one.
But it wasn't until September 2018 that the city established a promotion policy, following a 2015 complaint from a female officer who said she was passed over for a promotion and complaints in 2016 from two black officers who said they were held back from promotions at the police agency, according to local news reports.

The city didn't begin publishing use of force data — which shows how many times an officer used force on a civilian — until 2017, five years after Buttigieg got into office and after complaints about police brutality, including a federal lawsuit that was settled in 2018. The use of force data include the time, date, and type of force.
___
AUTO INDUSTRY

HARRIS: "Some estimate that as many as 700,000 autoworkers are going to lose their job before the end of the year." — remarks in July 12 radio interview.

THE FACTS: This isn't happening. Harris mischaracterized the findings of a study that is also outdated.

In July 2018 the Center for Automotive Research laid out a variety of scenarios for potential job losses across all U.S. industries touched by the auto business — not just autoworkers — if a number of new tariffs and policies that Trump threatened were enacted. The worst case was 750,000. But those hypothetical losses went well beyond autoworkers, to include workers at restaurants, retail stores and any business that benefits from the auto industry.

In any event, the center revised its study in February 2019, with a worst-case scenario down to 367,000 job losses across all industries. And since then, the administration lifted tariffs on steel and aluminum products coming from Canada and Mexico, further minimizing the impact on the auto industry.

The auto industry has grown under Obama and Trump both. Although it's facing a leveling off in demand, it still posts strong numbers. It is not at risk of the catastrophe Harris raises as a possibility — the loss of 3 in 4 autoworkers in the remainder of this year."

Monday, July 29, 2019

Monopoly power is NOT increasing in the American economy in an economically significant manner

Two good posts from Tyler Cowen.

*The Great Reversal: How America Gave Up on Free Markets*.

"That is the new book by Thomas Philippon, and perhaps the title is a bit misleading, as the book covers both regulatory barriers and natural economic forces behind higher concentration levels.  I am a big fan of Philippon’s work, but I am not so convinced by his arguments in this book.  Most of all, he is trying to argue for systematically greater monopoly power in the American economy, but he is reluctant to provide much evidence for output restriction, the sine qua non of market power.

First note that market power does not seem to be up at the level of actual market competition.  And capital’s share of income does not seem to be rising in a manner consistent with the monopoly theory, see here and here.

I agree with him about health care, and also (highly regulated) cable television and thus internet connections.  I agree with all of his suggestions for removing regulatory barriers to entry, for instance by allowing foreign airlines to serve domestic U.S. markets.  From a policy point of view, I am quite close to his perspective.

But when it comes to monopoly power too much of his evidence is circumstantial. OK, there is greater stability for market leaders in many sectors, and weak investment aggregates, but all the time antitrust suits find evidence for output restrictions — so why doesn’t this book offer more of such evidence?  Here is one passage (p.39) that caught my attention:
…we see a sharp increase in concentration in the airline industry after 2010.  That is enough to trigger our interest, but not enough to conclude that competition has weakened.  We must first check that concentration has also increased at the route level.  We find that it has.  We can further show that it came together with higher prices and higher profits.
I have only a pre-publication copy, and perhaps some of the book is missing in my edition, but I don’t see the cited evidence presented, nor is it in the airlines section starting on p.137 (which does document increasing concentration at the national level).  To consider the contrary evidence, here is an excerpt from an earlier MR post:
As for output restrictions, here is the DOT series on aggregate miles flown.  No doubt, there are problems around the time of 9/11 and also the Great Recession, with 2008-2012 being a period of slight quantity contraction.  But in 1985 there were 275,864 [million] total miles flown, in 2006 it was 588,471, and 641, 905 in 2015.  I’ll ask again: if there is so much extra monopoly, where are the output restrictions?
Or look at the price index.  Overall prices are down considerably since 2008, and from about 2000 to 2016 they run from about 250 (eyeballing) to about 270, noting 1998-2010 saw a huge run-up in oil prices.
Since I wrote that post there is clearer evidence for a steady price decline since 2012 (he is claiming higher concentration since 2010), just look at the price index, which is FRED channeling BLS.  Now maybe those are the wrong numbers for some reason, but I don’t see anything in the Philipson book to counter them.  I don’t see output restriction considered at all.  I don’t see a price series presented at all.

That is only one sector, but it reflects my deeper worries about the book.  I just don’t see the evidence for output restrictions, or, in many cases I don’t see the evidence for higher prices.

The most sustained discussion of prices comes on pp.114-122, where it is shown that PPP-adjusted prices are higher in America than in Europe, and furthermore the gap is growing.  That is far too much aggregation for my tastes (“Europe”), PPP adjustments are not exactly scientific, it is not very direct evidence for market concentration being the culprit, and furthermore if I understand him correctly, the Big Mac index also has the United States becoming relatively more expensive, even though McDonald’s clearly has faced massive competition in recent years.

To be sure, if you believe in a productivity slowdown, as I do, you also have to feel that America’s economic sectors, in some counterfactual sense, could be much more dynamic, more prone to disruption, and yes more competitive.  It is a great disappointment to me that is not the case.  But that is far from the view that monopoly power is increasing in the American economy in an economically significant manner, across a wide variety of sectors (health care caveat noted, and even that is selective, as there has been a significant cost slowdown).

So I remain skeptical about the main claims in this book."

How hard is it to stimulate demand?
"Recent studies have shown prices in some sectors—such as housing—do indeed rise faster when growth is in full swing, unemployment low and markets frothy. But a large chunk of the economy, from health care to durable goods, appears insensitive to rising or falling demand.
paper published last month by economists James Stock of Harvard University and Mark Watson of Princeton University found prices accounting for nearly half of the Fed’s preferred inflation gauge, the personal-consumption-expenditures price index, don’t respond to changes in economic activity. In 2017 economists at the Federal Reserve Bank of San Francisco found such “acyclical” goods and services made up a whopping 58% of that index.
And:
The cyclically sensitive components of core inflation, which excludes food and energy, have accelerated to 2.33% in the 12 months through May from 0.41% in mid-2010, according to the San Francisco Fed, just as falling unemployment would predict. But that has been offset by falling inflation in acyclical categories—such as health care, financial services and most goods—which has slowed to 1.04% from 2.26% in the same period.
Of course, this also casts doubt on the whole meaning of a single “real” interest rate.  And it seems to imply that monopoly power in the American economy is not so universal.

Here is the whole story from Paul Kiernan at the WSJ."

Tariffs on Chinese products will not create a million jobs

See I’m Still Not Certain that It’s Not from The Onion: An Open Letter to Michael Stumo by Don Boudreaux.
"Mr. Michael Stumo, President
Coalition for a Prosperous America

Mr. Stumo:

Richard Rahn forwarded to me a recent study done by your organization – a study co-authored by Jeff Ferry and Steven Byers – purporting to find that a permanent, across-the-board tariff of 25 percent on all U.S. imports from China would, after five years, “result in a “$167 billion boost to GDP and 1.05 million additional jobs” (“Update: Across-the-Board Tariffs on China with Retaliation and Federal Spending Create Over 1 Million Jobs in Five Years”).

Quite honestly, after reading your study I had some trouble coming to the realization that it’s not a spoof by “The Onion.” Here are only some of the many flaws of your study, any one of which is fatal to its veracity.

– You present as a scientific, objective claim that over the course of five years the tariffs you propose will increase U.S. employment by 1.05 million jobs. Yet there’s no plausible way that your researchers can have detected any such effect; this number is simply too tiny given the massive job churn that is a regular part of the U.S. economy.

Over the past ten years, the average number of jobs destroyed each month in America has been about 1.75 million, or 105 million jobs over the course of five years. Your figure of a total of 1.05 million jobs over five years is, literally, just one percent of this number; it’s a rounding error. Given the dynamism, churn, and enormous (and growing) size of the U.S. economy, it’s impossible to take this empirical finding seriously.

– You allege that a significant source of gain to Americans from your proposed tariff on Chinese imports will arise from “the relocation of US bound production from China to other nations [which] would lead to a reduction in the average cost of imports because many alternative production locations, such as those in Southeast Asia, today have lower costs of production than China.”

Well now, answer me this: If producers in Vietnam and other Southeast Asian countries can produce for the U.S. market more goods at lower costs than can producers in China, why aren’t producers in those other countries already producing for export to the U.S. the amounts that you allege they would be led to produce only when Uncle Sam imposes higher tariffs to artificially raise Americans’ costs of importing these goods from China? Do you know more about global prices than is known by American importers? Or do you suppose that American importers are simply so uninterested in keeping their costs as low as possible that they must be compelled by tariffs to seek out the lowest-cost sources of supplies? Your implicit assumption about the behavior of American importers is nothing short of preposterous.

– Among the sources that you claim to identify of tariff-induced economic growth is U.S. government expenditure of the revenues that it reaps from the tariffs. You assert that this expenditure will expand the U.S. economy because part of the tariff is paid by foreigners. You then treat Uncle Sam’s expenditure of this part of the tariff revenue as a net increase in spending in the U.S. But you’re mistaken.

That part of the tariff that is paid by foreigners is made up of dollars that foreigners otherwise would have cleared on their sales to Americans but that, because of the tariff, they do not clear. And so while, with the tariff, these dollars will be spent in the U.S. by Uncle Sam, absent the tariff these dollars would have instead been spent (or invested) in the U.S. by foreigners. It’s astonishing that you overlook this tariff-induced reduction in foreign spending and investment in the U.S.

– Nowhere in your study is there any indication of the reality of opportunity costs. The unemployment rate in America today is at a generational low. (Don’t dismiss this reality by asserting that today’s labor-force participation rate is also low. It’s true that the labor-force participation rate today is lower than it was for much of the past 40 years. But it’s higher today than it was at any time during the years generally regarded by protectionists as a golden age for the U.S. economy, namely, from January 1948 – when these data start – through April 1978.) You write as if tariffs will miraculously cause the workers and resources necessary to perform all this new production to materialize out of thin air – a proposition that causes one to laugh as one does when reading The Onion."

Sunday, July 28, 2019

Giving venture-capital partnerships favorable tax rates might be counter-productive

See ‘VC: An American History’ Review: The Seed Spreaders. Marc Levinson reviews VC: An American History by Tom Nicholas in The WSJ. Excerpt:
"the venture-capital industry in its modern incarnation is a creation of the U.S. government. The Small Business Investment Act of 1958 led to the creation of hundreds of venture-investment companies, which were entitled to federal loans and extremely favorable tax treatment. Although some were frauds, others seeded such consequential startups as Intel. A 1979 law allowed pension funds to invest in venture capital. And reductions of tax rates on capital gains since the 1970s have allowed venture capitalists to collect their pay mainly through capital gains rather than more highly taxed wages, minimizing their tax bills. At the same time, the federal government has been a major customer of VC-funded startups in computing, software and semiconductors. As Mr. Nicholas puts it: “Government policy had powerful supply- and demand-side effects.”

How successful have these policies been? If investors’ returns are an indication of whether money has been spent well, venture-capital investing is not a particularly beneficial activity. While venture funds outperformed public equities in the 1990s, in both the 1980s and the early 2000s investors would have been better off putting their money into an index fund. Venrock Associates, which managed the investments of pioneer venture capitalist Laurance Rockefeller, turned an initial $288,000 investment in Apple into a storied $116.6 million gain in 31/2 years. But excluding Apple, its portfolio showed an annual return of 3.4% on investments made between 1969 and 1978.  Rockefeller’s “stunning success with Apple . . . was close to accidental,” Mr. Nicholas observes, but it made up for money-losing investments in a number of long-forgotten companies.

It is an article of faith that ready access to venture capital makes an economy more dynamic. Mr. Nicholas frames the case historically, contending that “the spillovers into the real economy generated by venture investing during the 1990s were powerful and pervasive.” But he focuses entirely on the U.S. and offers no information about how high-risk startups are funded in other countries.

By some measures, other countries may have more dynamic economies than the U.S. The Bloomberg Innovation Index has ranked the U.S. eighth among the most innovative countries in 2019 after leaving it out of the top-10 last year; the leaders for this year are South Korea and Germany, which don’t provide venture capital the American way. Startups are flourishing in countries such as Israel, Estonia and even Norway, according to European Union statistics, while data from the U.S. Census Bureau puts the number of new American businesses expecting to hire employees at less than half the level of 2004. And the World Intellectual Property Organization reports that South Korea, China and Japan, among other countries, outpace the U.S. in patent filings per $100 billion of gross domestic product.

So perhaps the history of U.S. venture-capital investing is not quite the triumph that Mr. Nicholas would have us believe. It might be the case that, by gracing venture-capital partnerships with favorable tax rates, we encourage investors to put resources into dogs like Pets.com."

More home buyers getting down payment help from the government, like that which contributed to the Great Recession

See Home Buyers Get Government Help With Down Payments: Share of purchasers drawing on assistance programs across U.S. doubled from 2013 to 2016. Excerpts:
"Those who use down-payment assistance start out with little or no skin in the game. As a result, some economists and analysts worry that buyers have less incentive to keep making payments if times get tough. In recent years, those who used government down-payment assistance for FHA loans were delinquent at a higher rate than those who didn’t, government data show.

“Someone who can’t come up with a down payment is far more likely to be living paycheck to paycheck,” said John Burns, founder of John Burns Real Estate Consulting in Irvine, Calif."

"Many federal, state and local programs operate through housing finance agencies and nonprofits. They vary by region, but typically offer some amount of cash to buyers who qualify and structure it as a second loan. Some forgive it after a period of time while others require repayment. Sometimes, the program provider charges an above-market interest rate on the mortgage to recoup the money put toward the down payment."

"Down-payment assistance funded by sellers became fertile ground for abuse before the housing market collapsed. Sellers routed money to buyers through nonprofits and then tacked the cost onto the purchase price. The federal government has since prohibited the practice.

Still, FHA Commissioner Brian Montgomery, who had the same job during the financial crisis, has been closely watching risks associated with FHA loans. In a report last year, the FHA said it was concerned about government programs that operate on a national level “in ways that generate benefits for the provider,” and “increase costs, but not benefits, to the borrower.”"

Saturday, July 27, 2019

Bogus E-cigarette Panic Literally Killing People

By Michelle Minton of CEI. Excerpt:
"Justified by the need to scare teenagers away from e-cigarettes, government health agencies and preeminent health bodies have relentlessly engaged in a campaign of misinformation, exaggeration, and outright lying about e-cigarettes. Their hope was to make vaping seem far more dangerous than the evidence indicates. And they’ve succeeded.

“Scientists have been working hard to debunk the belief that e-cigarettes are less harmful than traditional cigarettes,” the American Lung Association (ALA) noted in a recent post. Yet, despite this hard work by ostensibly objective scientists, they haven’t yet been able to refute the large and growing body of evidence that vaping is less harmful than smoking. Failing to verify their alternative facts, they have instead turned to baseless fear-mongering.

Perhaps the most egregious example of anti-vaping advocates’ willingness to set facts aside is their repeated claim that vaping causes “popcorn lung” (bronchiolitis obliterans), a rare and debilitating lung disorder. The claim is based on the fact that some e-cigarettes contain the flavoring agent diacetyl. Diacetyl has been linked to popcorn lung, but primarily in factory workers at microwave popcorn plants (hence the name) exposed to massive amounts of the chemical. It might seem acceptable, based on that, to say there’s a chance the diacetyl in e-cigarette vapor could possibly cause popcorn lung in people who vape. But what the stalwart defenders of public health never point out is that cigarettes contain hundreds of times more diacetyl than e-cigarettes, and research finds no link between smoking and popcorn lung. Thus it is ludicrous—one might even say irresponsible—to suggest that popcorn lung is a risk faced by those who vape. But that hasn’t stopped groups like the ALA from doing exactly that."

The Average Profit Margin for a Restaurant

By Patrick Gleeson, Ph. D.,; Reviewed by Michelle Seidel, B.Sc., LL.B., MBA.
"There are two profit margins widely used by accounting professionals: gross profit margin and net profit margin. Confusingly, some restaurant journalists write about profit margins without specifying which. Worse, when you read these articles carefully, you see that some use "profit margin" to refer to the gross profit margin and some use the same phrase to refer to net profit margin. There's a huge difference!

Gross Profit Margin

Gross profit, is what is left after you deduct the direct costs of goods sold – such as food costs and labor costs directly associated with preparation and serving. It's a useful statistic for professionals evaluating a restaurant's efficiency and profitability, but it's not at all the same thing as net profit – which includes all costs – among them are administrative expenses, building costs, taxes and interest. Net profit is what you put in your pocket.

Difference Between Gross Profit Margin and Net Profit Margin

Gross profit margin equals the revenue minus the cost of goods sold divided by revenue. Net profit margin equals revenue minus all costs, direct and indirect, divided by revenue.

When you want to know whether a restaurant is likely to succeed or go under, the best first place to look is at its net profit margin. If the net profit margin is 10 percent – this means that out of every dollar the customer spends – the restaurant pays 90 cents for all expenses, and retains ten cents in profit – which, incidentally, isn't at all bad. The average net profit margin for all S&P 500 companies is a little over 8 percent.

Fast Food Margins

The range of net margins in the fast food industry are quite wide. A few chains, especially McDonald's, have very healthy net margins. In 2017 , the average net profit margin for all McDonald's restaurants was over 22 percent. Among all franchises, however, net margins are drastically lower.

In 2012, for example, when McDonald's had a net profit margin of just under 20 percent; Burger King's net margin was less than a third of that and another big chain; Wendy's, had a scary thin 0.3 percent. This is very bad, but the fast food industry average for 2012 was only somewhat better, at 2.4 percent, a very thin margin that leaves little room for error.

Fast Casual and Casual

Casual dining, as it used to be called, is now commonly divided into two categories: fast casual and casual, sometimes called "family style."

Fast Casual restaurants include Chipotle, Shake Shack and similar chains where you order at the counter, sometimes having the food brought to the table, sometimes carrying at least part of your meal to the table yourself. It's often said that fast casual restaurants are distinguished from fast food chains by their healthier menus, but that may be more an aspiration than an actual difference.
In 2013, the fast casual segment of the restaurant industry had an average net profit margin of 6 percent. Overall, the fast-casual and casual segments together also averaged 6 percent net profit margins. To put this in context, this is a little more than 2 percent worse than the average of all S&P 500 companies, but nearly three times better than the fast food segment.

Full-Service Margins

Full-service restaurants are basically what's left after you subtract fast food, fast casual and casual restaurants. This market segment includes fine-dining restaurants, but it also includes less elegant places where, as in the fine dining segment of the industry, you're ushered to a table and handed a menu. The difference between fine-dining and other full-service restaurants isn't that the approaches are entirely different – both are "full-service" – but in the degree of refinement and, yes, how much it costs. The Houston's restaurant chain is probably right at about the dividing line between "full-service" and "fine-dining.

In 2017, full-service restaurants had average profit margins of 6.1 percent, essentially the same margin as fast-casual and casual restaurants."

Friday, July 26, 2019

Adjusting inequality for taxes and number of workers per household

A Different Look at After-Tax Income Inequality by Alan Reynolds.
"Every presidential candidate promises to “reduce income inequality” by raising tax rates on the rich and increasing transfer payments (including tax credits and in-kind benefits) for the middle class.  Yet the widely-used flawed data from Thomas Piketty and Emmanuel Saez exclude both taxes and transfers.  Income measures that exclude taxes and transfers cannot tell us whether taxes or transfers are high or low, and cannot be directly affected by higher taxes on some or higher transfers to others (because such policies are ignored in the data).

A simple table adapted from the 2017 Consumer Expenditure Survey, from the Bureau of Labor Statistics, may be sufficient to show how crucial it is to take account of taxes (including refundable tax credits), and also to adjust average income for the different number of people and workers per household.

After Tax Income by Quintile

Incomes are shown by fifths (“quintiles”), with the lowest 20% on the left and highest on the right.

The second row shows the “lower limit” of pretax income needed to counted be in each quintile.

The next two rows show mean (average) income before and after taxes.

The column at the far right shows a ratio of highest to lowest income, called the 80/20 ratio, which a common gauge of inequality.    It shows that the highest 20% earned 16.5 times as much as the lowest 20% before taxes, but only 12.5 times as much after taxes. 

But simply adjusting household income for taxes is not enough.  Average incomes cannot be properly compared between the highest and lowest quintiles because there are three times as many people per consumer unit (household) in the highest 20% as there are in the lowest.   And there are four times as many workers in the highest 20% as there are in the lowest.

By adjusting for different household size, we find the highest 20% earned only 6.5 times as much after-tax income per person as the lowest 20%.
 
But income is likely to be higher in households with two or more workers than it is in households with no workers or only one.  So, that last row measures average after-tax income per worker in the highest and lowest quintiles (and those in between).

By further adjusting for the different number of earners, the highest 20% earned only 3 times per worker as much as the lowest 20%, after taxes.  

Properly understood, the facts about U.S. after-tax income distribution and growth are insufficiently alarming to justify the political misuse of questionable pretax, pretransfer income statistics as a false argument for redistributing after-tax income."

A rather standard program of fiscal and monetary stability, opening to international trade and foreign investment, and growing integration with international economic organizations led Spain to surpass Latin American countries in per capita GDP

By Jesus Fernandez-Villaverde (via Bryan Caplan).
"Last week I asked:
Why is Spain so much richer now than almost any country in Spanish America?  Before you answer with great confidence, ponder this: According to Angus Maddison’s data on per-capita GDP in 1950, Spain was poorer than Argentina, Chile, Mexico, Peru, Uruguay, and Venezuela, and roughly equal to Colombia, Bolivia, Costa Rica, Cuba, Ecuador, Guatemala, and Panama.  This is 11 years after the end of the Spanish Civil War, and Spain of course stayed out of World War II.
Via email, Penn’s Jesus Fernandez-Villaverde replied.  The following is kindly reprinted with his permission.


By luck, the question is posted close to the 60th anniversary of the day that gives you a rather compelling answer (and one that is well accepted by most Spanish economic historians): July 21, 1959. I have an op-ed in El País, the largest Spanish newspaper. about this anniversary this Sunday (in my “other life,” I do Spanish Economic History).

On July 21, 1959, Franco’s government approved an executive order that implemented the “Plan de Estabilización” (the “Stabilization Plan”). The result of a memorandum of understanding with the IMF, the World Bank, and the OECD, the “stability plan” committed Spain to a rather standard program of fiscal and monetary stability, opening to international trade and foreign investment, and growing integration with international economic organizations. Simultaneously, the government had undertaken, in 1957, an administrative reform that enhanced state capability and an extremely efficient top civil service was established. Forget about the guy giving you a driving license at the local DMV; what matters is the quality of the senior permanent secretary of the Treasury, which has been outstanding since 1957 without interruption. 
 
The “stability plan” broke an inward-looking development model with growing barriers to trade that had been followed since 1874. By 1959 Spain was poor for much deeper reasons than the 1936-1939 Civil War. Most recent releases of Maddison’s NIPA data for Spain, helped by the work of top researchers such as Leandro Prado de la Escosura show, that by 1929, Spain had fallen dramatically behind its European peers except Portugal and Greece. The combination of macroeconomic stability, freer flow of goods and capital, and stronger state capability triggered several decades of fast economic growth. Most people would naively mention tourism. These observers forget that Spain became a magnet for the European car industry. In 2017, Spain produced more passenger cars than France or the U.K. and nearly as many as the U.S. (although the U.S. number is biased by the importance of pickup trucks in the U.S. production mix). Even more importantly, Spain is one of leading world producers of car parts.

Why did Spain become a magnet for the car industry? Good legal environment (the “Decretos Ford” or “Ford Executive Order” are so-called because they were designed to convince Ford to open a gigantic factory in Valencia), macro stability, and access to the rest of the European market.

Spain’s exports are rather diversified. Spain, for example, exports more airplanes and airplane parts than olive oil. Many of your readers probably fly in Airbus planes (American Airlines has plenty of them!): well, a big chunk of them are made in Spain.

A similar history can be told about the petrochemical industry. Today Spain exports more, as a percentage of GDP, than France or Italy.

To a considerable extent, the economic history of Spain since 1959 is a textbook example of modern economic growth: get a few institutions right and ride them into prosperity. European transfers after Spain joined the E.U. in 1985 are a rounding error. And joining the E.U. was the consequence of growth, not the cause.

Of course, there is the issue of high unemployment, but most foreigners forget that a 15% rate of unemployment in Spain is very different from a 15% rate of unemployment in the U.S. Roughly, and skipping some details, we are talking about many young people living at home with their parents that take 2-3 years after college before they find a job instead of a few weeks as in the U.S. due to our screwed labor market institutions. Not good, but not the end of the world.

Interestingly enough, Cuba had the same income per capita than Spain in 1959 and better literacy, education, and many other indicators. A few decades of ignoring markets and see what happens.

The critical question is, therefore, why did Spanish political-economic elites committed themselves to a market-oriented reform in 1959 and stick with it even during the transition to democracy in 1975, the arrival of the Socialist Party to government to 1982 (a surprisingly pro-market government), and the Euro crisis of 2008-2014 while most Latin American countries did not? Even today, a quick conversation with the political-economic elites of Madrid (the ones running the country) reveals a full conviction that this path has served Spain well (Bryan: the libertarians in Madrid are somewhat peripheral to that conversation, so their opinions are, to a very large extent irrelevant). 

A full answer would require a long explanation, but the lack of a colonial inheritance (with all the racial and class divisions it creates) and the proximity to the core of Europe (France and Germany) are determinant factors."

"Spain was, indeed, quite poorer in real GDP per capita at chained PPP than Venezuela, Mexico, or Uruguay in 1950 (and well- behind its European peers except for Portugal and Greece). In fact, nearly every single Spanish family has relatives that migrated to the Americas at that time due to the differences in income. Many of my own relatives moved to Cuba and Argentina (in the interest of full disclosure: Argentina’s numbers for 1950 real GDP per capita at chained PPP at the PWT are oddly low; I need to find out why).

Of course, Latin America is an extremely diverse region and comparing, for instance, Guatemala with Chile, is not very informative, as their ethnic background, colonial experience, and history since independence have been extremely different. Even Brazil is a world in itself, with Minas Gerais being a very different economy than Bahia (that is why Brazil’s real GDP per capita at chained PPP is not terribly informative). Nevertheless, you could safely argue that the most advanced economies in Latin America were ahead of Spain in 1950.

In 2017, the situation has dramatically reversed. Just to take Uruguay: an example of a country of mainly European origin, well-educated, and with excellent tourist attractions. While Uruguay’s real GDP per capita at chained PPP in 1950 was $6,258 vs. $3479 for Spain, today Uruguay’s real GDP per capita at chained PPP is $20608 vs. $37233 for Spain. In other words, Spain’s real GDP per capita at chained PPP multiplied by 10.7 while Uruguay’s multiplied by 3.29.

Venezuela’s case is even more dramatic (being the country with the largest oil reserves in the world). Its real GDP per capita at chained PPP in 1950 was $5869. Today is $7925. Even if you decide to ignore the last 10 years of Venezuela’s history and look at its real GDP per capita at chained PPP circa 2008, one still sees the dramatic underperformance of its economy. As a quick anecdote I always tell in class to my undergrads: in the 007 novels (not the movies), Ian Fleming explain in detail SPECTRE’s inner workings (which make some of the stuff in the movies easier to understand). In one of the novels (Thunderball, I believe, from 1961), it is explained that SPECTRE only deals with a small set of extremely sound currencies, including the Swiss Franc and the Venezuelan Bolivar. What a difference a few decades make!

One can think that explaining the reversal of fortune between Spain and the most advanced Latin American economy from 1950 to 2018 is trivially easy or one can think that explaining it requires serious research, but it is hard to deny that, since 1959, Spain is one of the most remarkable cases of convergence to rich countries in the data."

"Cuba could always trade with Mexico, the rest of Latin America, Canada and, more importantly, the whole of the European Union. While trading with the U.S. would have been easier, it would also been easier for Japan to trade with China in the 1960 and 1970 than with the U.S. and that limitation did not hurt Japan that much. U.S. sanctions to Cuba were a self-defeating and misguided policy, but a rounding error in Cuba’s problems.

Cuba received, for decades, huge subsidies from the Soviet Union and more recently from Venezuela (the latter in terms of cheap oil). Those subsidies were, with near certainty, larger than the additional cost for Cuba to trade with the European Union than with the U.S.

Other Latin American countries (I use the example of Uruguay) have suffered from disappointing economic growth without the U.S. having much to do with it."

"“Good legal environment, macro stability, and access to the rest of the European market“ which ones are missing for the “poor” Cubans?

Well, to start with a good legal environment and a system of market prices. No entrepreneur with a minimum of common sense would ever open a car factory in Cuba, with or without U.S. sanctions."

Thursday, July 25, 2019

School choice is a winning policy, so why don't Democrats support it?

By Sen. Joseph Lieberman
"What if I told you that a policy proposal has a 73 percent approval rating? That includes 76 percent of Hispanics, 73 percent of whites, and 69 percent of African Americans. And 56 percent of those polled said they would be more likely to vote for a candidate who supported this policy. If you were a Democratic candidate for president, you would naturally think that supporting such a policy would be a smart thing to do.

What is this popular public policy?

Is it "Medicare-for-all"? Is it the "Green New Deal"?

No. It’s school choice.

In a June nationwide poll from Mason-Dixon Polling on behalf of the American Federation for Children, 73 percent of voters said they support school choice programs that give "parents the right to use the tax dollars designated for their child’s education to send their child to the public or private school which best serves their needs."

Support for school choice is strongest in the South (80 percent), West (77 percent), and Midwest (74 percent) including important battleground states in the electoral college. Republican support for school choice is stronger than Democrats. Still, more registered Democrats (45 percent) would support a candidate who backs school choice than would oppose one (43 percent).

Not only do core constituencies in the Democratic party, including African Americans and Hispanic Americans, overwhelmingly support choice, but 75 percent of Independents, who will likely determine the outcome of the elections in 2020, also support school choice.

So why do the two dozen Democrats vying to replace President Trump oppose this policy? Sadly, my suspicion is that it has something to do with securing the backing of teachers' unions, which are fervently against giving parents the choice of taking their children out of public schools that they believe are not educating their kids.

Parents naturally want to give their kids every opportunity they can to do better. Setting students up for success should be the first consideration not just for parents, but for the federal government when it decides how best to support education. We can do that by empowering low-income families with the ability to choose the best, individualized K-12 educational path for their child, which is something high-income parents do every day by paying to send their children to a private or religious school of their choice.

Instead, today’s system is largely based on one model, one path, and that path unfortunately doesn’t work for millions of American children. That’s why we need to support choices for parents and their children that they otherwise couldn’t afford.

The Democratic Party that I joined a long time ago was on the side of the average American with dreams of rising higher and higher, rather than the elites who have already made it. Supporting school choice is a good way for my fellow Democrats to show they still embrace that priority.

Polling shows school choice is a winning position, and a growing body of research shows its greater effectiveness in educating children. Supporting school choice takes courage for a Democratic presidential candidate, but it is the right thing to do for America’s low-income children. It’s even the smart thing to do politically."

The economic consequences of Hugo Chavez: A synthetic control analysis

By Kevin Grier and Norman Maynard.
"Journal of Economic Behavior & Organization, 2016, vol. 125, issue C, 1-21

Abstract: We use the synthetic control method to perform a case study of the impact of Hugo Chavez on the Venezuelan economy. We compare outcomes under Chavez's leadership and polices against a counterfactual of “business as usual” in similar countries. We find that, relative to our control, per capita income fell dramatically. While poverty, health, and inequality outcomes all improved during the Chavez administration, these outcomes also improved in each of the corresponding control cases and thus we cannot attribute the improvements to Chavismo. We conclude that the overall economic consequences of the Chavez administration were bleak."

How central planning hurt Venezuela

See Under Venezuelan Socialism, There Is No Beer. (And No Democracy.) Attempts to centrally plan an economy ruin both civic life and life's pleasures. By Robert Lawson and Benjamin Powell in Reason. Excerpt:
"Three years ago, the two of us traveled to the Venezuelan border to better understand the causes of the country's economic strife. We traveled to the bridges near Cúcuta, Colombia, where—unlike in Venezuela, just across the river—there were no government-enforced wholesaler monopolies, no arbitrary price controls, no limits on profits. What a difference a river and a border made: On the Colombia side, freer markets were providing what the Venezuelan government could not.

The stores in Colombia were well stocked. Three or four pharmacies near the bridge sold a wide variety of medicines and supplies. Bulk food was everywhere, and pallets heaped with bags of rice were constantly offloaded from trucks and into storefronts. Phone cards, cooking oil, diapers, pre-packaged snacks, juice drinks, and many other basic goods were all widely available. Roadside stands sold food and ice cream. According to Julian, a reporter traveling with us, prices were cheap, even by local standards. A pound of rice went for less than a dollar.

The only thing we couldn't find was beer. It was available for takeaway from stores, but we were looking for a place to sit and people-watch. Eventually, we found a small, dusty joint with a few beat-up plastic chairs and a beer cooler. It wasn't on one of the main shopping alleys, but it was the only option around. We grabbed a couple of Bahias, which cost about 33 cents each.

Not only were the beers cheap, but we counted ourselves fortunate because, to Venezuelans, beer had become a rare luxury. In Venezuela, six months earlier, there was no beer at all. That's right—they ran out of beer. Empresas Polar, which produces 70 to 80 percent of Venezuela's beer, had closed all four of its breweries the previous April when they ran out of malted barley.

More accurately, the company ran out of the foreign exchange money necessary to buy imported barley. Barley isn't grown in Venezuela's tropical climate. In a market economy, Empresas Polar would have traded domestic currency in the foreign exchange market to buy whatever imported ingredients it needed. But Venezuela's planners control access to foreign exchange, and they didn't allocate enough to the company to import the needed barley.

The government prefers a different explanation: It says the problem is that Polar's CEO is a "thief and a traitor" who is trying to undermine the socialist regime.

As horrifying as a shortage of beer sounds, it's nowhere near the worst of Venezuela's problems. 

Venezuelans aren't just thirsty. They're hungry. Most of them don't have access to a market like the one we were at across the river. As a result, three-quarters of the country's adults lost an average of 19 pounds during 2016. Caritas, a Catholic humanitarian organization, found that among children under 5 years old, more than 11 percent suffered from moderate or severe malnutrition. The situation has only become worse since our visit. Venezuelans lost an average of 24 pounds in 2017. Venezuela's socialist policies are literally starving the country.

Two months after our visit, the Ministry of Health released statistics showing that infant mortality rates had shot up 30 percent in 2016. The minister who released the statistics was promptly fired. So much for Article 83 of Venezuela's constitution, which declares, "Health is a fundamental social right and the responsibility of the State, which shall guarantee it as part of the right to life." Apparently, writing down a "right" to something on a piece of paper doesn't magically make it materialize.

Many observers believed Maduro's predecessor, President Hugo Chávez, had created prosperity with socialist economic policies. What these observers missed was that high oil prices disguised how his policies were destroying the country's economy. Venezuelans were sitting on the world's largest known oil reserves, yet oil production was at a 23-year low. Nationalized oil companies hadn't maintained their pipelines and refineries, because they had no profit motive to do so.

Kevin Grier, an economist at Texas Tech, co-authored a study that compared the performance of Venezuela's economy during the oil boom against the economies of similar but non-socialist countries. He found that Venezuela's economy improved, but by less than that of the other countries; in fact, if Venezuela had not followed socialist policies, Venezuelan incomes would likely have been 20 to 30 percent higher. High oil prices hid the fact that Venezuela was falling behind its neighbors economically and merely keeping pace when it came to poverty and infant mortality. Once oil prices fell, the mask was off.

So with production cratering and oil revenues drying up, where is the Venezuelan government getting its money? That's easy: They're running a printing press, and you don't have to be an economist to know that results in inflation. Prices are rising faster and faster every year—the inflation rate was more than 30 percent in 2008, and more recently hit an estimated 18,000 percent in March and April 2018. It's almost impossible to measure inflation properly in a country with such massive shortages and controlled prices.

Hyperinflation is one of the most destructive things a government can do to an economy. It devastates the balance sheets of banks and other lenders, which causes borrowing and lending to grind to a halt. Virtually every house, factory, and business you've ever seen was created with borrowed funds, and failing banks mean no new houses, factories, or businesses. Inflation erodes savings, destroys people's ability to make long-term plans, and turns the entire economy into a race to spend money as fast as possible before it loses its value.

For much of 2017, Chávez's successor, President Nicolás Maduro, had an approval rating that hovered between 20 and 30 percent; anti-government protests abounded. But Maduro was reelected in 2018 amid, as The New York Times put it, "widespread disillusionment," with "more than half of voters not casting ballots" and critics alleging that the election was "heavily rigged."

This shouldn't surprise you. Political freedom cannot survive without a large degree of economic freedom. In his 1944 book The Road to Serfdom, Friedrich Hayek argued that a competitive capitalist economy is necessary to sustain democracy, and that once a country becomes "dominated by a collectivist creed, democracy will inevitably destroy itself."

Centrally planned economic systems necessarily concentrate economic power in the hands of government planners, who can punish dissent through their economic edicts. This is exactly what has happened in Venezuela, where state employees were fired for signing a petition demanding that Maduro be recalled. In 2017, Maduro ordered a special election for a Constituent Assembly that could rewrite the constitution and give him even greater power."

Wednesday, July 24, 2019

E.U. Regulators Can't Detect the Gene-Edited Crops They Banned

The difference between two identical genes—one edited and the other a natural mutation—is entirely metaphysical

By Ronald Bailey of Reason.
"The European Court of Justice ruled last summer that the European Union's absurd regulatory scheme for genetically modified organisms (GMOs) must be applied to gene-edited crops. Such regulations, however, are scientifically nonsensical. GMO crops (typically modified by adding genes from other organisms)and gene-edited crops (using techniques like CRISPR to modify genes already in the crop variety) are safe for people and for the environment. Such crops need no more regulation than do crops created via conventional techniques such as crossbreeding or random mutation by blasting them with ionizing radiation and harsh chemicals.

Now foods labs are telling would-be E.U. regulators that there are no tests that can reliably distinguish between gene-edited and conventional crop varieties. Why? Because many of the edited genes are indistinguishable from those in naturally occurring organisms. Consequently, E.U. regulators are worried that gene-edited horrors from the U.S., such as Calyxt's healthy high-oleic-acid oil or Intrexon's non-browning lettuce, might sneak into European supermarkets undetected.

Before gene-editing, plant breeders would first identify a useful gene in a landrace variety, e.g., mildew resistance, and then onerously crossbreed generation after generation to transfer the gene into a more productive commercial variety. Biotechnologists can now induce mildew resistance by simply editing a few DNA pairs in the corresponding gene in the commercial variety to match the ones found naturally in the landrace.

In contrast to the bioluddites in Europe, regulators in the U.S., Brazil, Argentina, and Australia have sensibly declared that they do not intend to regulate edited crops with mutations that could have occurred in nature.

Hermann Broll, a researcher in the Department of Food Safety at the German Federal Institute for Risk Assessment in Berlin, according to Nature, noted that even if food testing labs could find the edits, regulators would still struggle to prove that the DNA variant they've identified is the result of gene editing, rather than a natural mutation. "I do not have a clue as to the solution—and I have not seen anywhere any clue yet," said Broll.

Here's a suggestion: Go back to the European Court of Justice and urge the judges to overturn their metaphysical ruling, which found that one of two identical genes must be regulated if it happens as a result of editing, while the other escapes administrative scrutiny if it is a natural or radiation-induced mutation."

How Women Are Disadvantaged by the Tax Code and Social Security System

By Dan Mitchell.
"I’m not a big fan of the current tax system. I’m also not supportive of America’s bankrupt Social Security system.

The country would be much better off with fundamental reform of both the tax system and Social Security.

Some groups will be reap especially large rewards if that happens.

For instance, a new report from the National Bureau of Economic Research examines the impact of taxes and Social Security on female labor supply.
…we ask to what extent the fact that taxes and old age Social Security benefits depend on one’s marital status discourages female labor supply and affect welfare. …as couples  file taxes jointly, the secondary earner in the married couple faces a higher marginal tax rate, which tends to discourage their labor supply. …reduced labor supply does not necessarily imply lower Social Security benefits. Since women have historically been the secondary earners, both provisions tend to discourage female labor supply… to what extent are these disincentives holding it back? …We estimate our dynamic structural model using…data from the Panel Study of Income Dynamics (PSID) and from the Health and Retirement Study (HRS) for the cohort born in 1941-1945 (the “1945” cohort). …we also estimate our model for the 1951-1955 cohort (the “1955” cohort),
This chart from the study shows that married women face a tax penalty – i.e., higher marginal tax rates – compared to single women.


The main takeaway is that this marriage penalty, combined with discriminatory features of Social Security, discourages women from working.

How big is the effect?

The report, authored by Margherita Borella, Mariacristina De Nardi, and Fang Yang, finds that government policies have a significant adverse impact on labor-force participation.
For the 1945 cohort, we find that Social Security spousal and survivor benefits and the current structure of joint income taxation provide strong disincentives to work to married women and single women who expect to get married… For instance, the elimination of all of these marriage-based rules raises participation at age 25 by over 20 percentage points for married women and by five percentage points for single women. At age 45, participation for these groups is, respectively, still 15 and 3 percentage point higher without these marital benefits provisions. In addition, these marriage-based rules reduce the participation of married men starting at age 55, resulting in a participation that is 8 percentage points lower by age 65. Finally, for these cohorts, these marital provisions decrease the savings of married couples by 20.3% at age 66.1 In terms of welfare, abolishing these marital provisions would benefit…over ninety percent of the people in this cohort. …We find that the effects for the 1955 cohort on participation, wages, earnings, and savings are large and similar to those in the 1945 cohort, thus indicating that the effects of marriage-related provisions are large also for cohorts in which the labor participation of married women is higher.
What if these discriminatory policies were fixed?

It depends, of course, on how the problems are addressed.

The report finds that a budget-neutral approach (i.e., returning any budgetary windfall to taxpayers) would be a significant net plus.
…there would also be large aggregate gains from removing marriage related provisions and reducing the income tax… Overall our policy experiments thus indicate that removing marriage related taxes and Social Security benefits would increase female labor supply and the welfare of the majority of the populations.
Here are a couple of charts from the study, showing both an increase in labor supply and an increase in labor income.


I’ll close with a final point about family structure.

Some people will argue that the current penalties in the tax code and Social Security system are desirable because they don’t punish stay-at-home moms as much as working women.

That’s a very strange argument. Sort of like the folks on the left, including the IMF, who advocate policies that hurt the poor if rich people suffer even more.

P.S. If there’s reform, older people also will enjoy significant gains."