Evaluating the free market by comparing it to the alternatives (We don't need more regulations, We don't need more price controls, No Socialism in the courtroom, Hey, White House, leave us all alone)
Monday, July 22, 2019
The New York Times Says Heat Waves Are Getting Worse. The National Climate Assessment Disagrees.
"Americans east of the Rockies are sweltering
as daytime temperatures soar toward 100 degrees or more. It is now
customary for journalists covering big weather events to speculate on
how man-made climate change may be affecting them, and the current heat
wave is no exception. Take this headline in The New York Times: "Heat Waves in the Age of Climate Change: Longer, More Frequent and More Dangerous."
As evidence, the Times cites the U.S. Global Change Research Program,
reporting that "since the 1960s the average number of heat
waves—defined as two or more consecutive days where daily lows exceeded
historical July and August temperatures—in 50 major American cities has
tripled." That is indeed what the numbers show. But it seems odd to
highlight the trend in daily low temperatures rather than daily high temperatures.
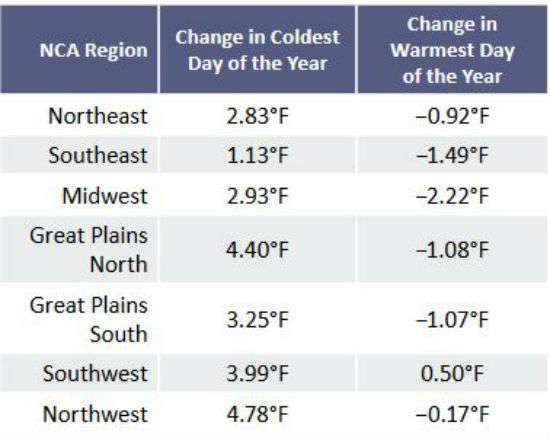
As it happens, chapter six of 2017's Fourth National Climate Assessmentreports that heat waves measured as high daily temperatures are becoming less common in the contiguous U.S., not more frequent.
Here, from the report, are the "observed changes in the coldest and
warmest daily temperatures (°F) of the year for each National Climate
Assessment region in the contiguous United States." The "changes," it
explains, "are the difference between the average for present-day
(1986–2016) and the average for the first half of the last century
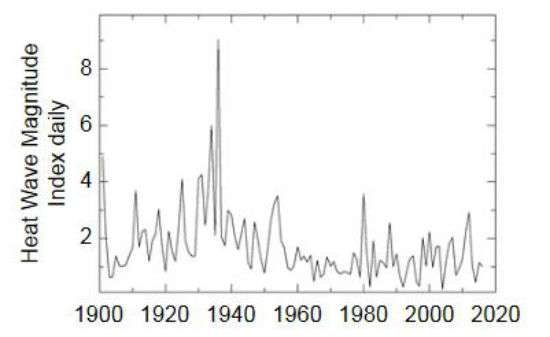
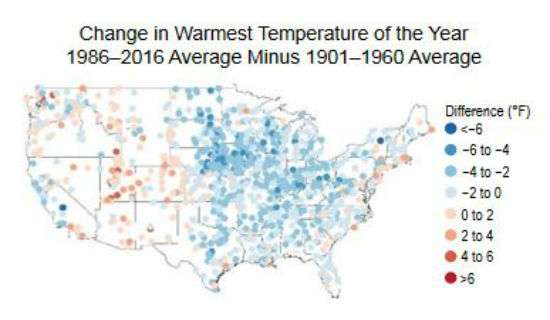
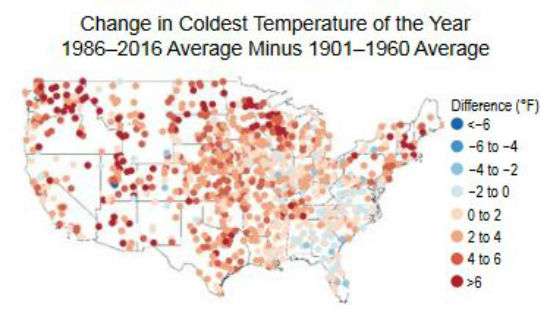
(1901–1960)." 4th NCAAnd here is the Heat Wave Magnitude Index, which shows the maximum magnitude of a year's heat waves. (The report defines a heat wave as a period of at least three consecutive days where the maximum temperature is above the appropriate threshold.) 4th NCAThe maps below, from the Fourth Assessment, illustrate the trends in
the warmest (generally daytime) and coldest (generally nighttime)
temperatures in the contiguous U.S.: 4th NCA 4th NCAAccording to the Intergovernmental Panel on Climate Change, climate models tend to significantly underestimate
the decrease in the diurnal temperature range—that is, the difference
between minimum and maximum daily temperatures—over the last 50 years.
The panel's latest report notes that there is "medium confidence" that "the length and frequency of warm spells, including heat waves, has increased since the middle of the 20th century" around the world. Medium confidence
means there is about a 50 percent chance of the finding being correct.
(The report does deem it "likely that heatwave frequency has increased
during this period in large parts of Europe, Asia and Australia.")
Heat wave trends aside, the Fourth National Climate Assessment
reports that "the annual average temperature over the contiguous United
States has increased by 1.2°F" if you compare the period of 1986–2016 to
that of 1901–1960. Outside the lower 48 states, Alaska's average winter and summer temperatures have increased since 1950 by 7°F and 2.6°F, respectively."
No comments:
Post a Comment
Note: Only a member of this blog may post a comment.
No comments:
Post a Comment
Note: Only a member of this blog may post a comment.