Showing posts with label Income mobility. Show all posts

Friday, June 5, 2026

The Myth of a Permanently Poor Underclass

The bottom income quintile is not a static social class but a temporary snapshot of lives in motion. Most Americans do not remain poor for life, and removing policy barriers can help more people move up.

By Vance Ginn.

"One of the most misleading ideas in American politics is that the United States has a large, fixed class of permanently poor people stuck at the bottom year after year, while everyone else moves on without them.

That story is emotionally powerful. It also happens to be a poor guide for serious policy.

Poverty is real. Hardship is real. Some people do remain trapped for long periods, and that deserves serious attention. But the popular picture of a vast, permanent underclass does not describe most Americans who show up in the bottom income quintile in any given year. As economist Anthony Davies has put it, many are there because of “retirement, homework, and diaper rash.” That line works because it captures something basic: a snapshot of income is not the same thing as a life story.

Students often have very low current earnings. So do many retirees living on savings or Social Security instead of wages. So do young parents working fewer hours, people between jobs, and entrepreneurs in low-cash-flow years. Treating all of them as members of a permanent poor class is not compassion. It is a category mistake.

The data back that up. The Federal Reserve’s Survey of Consumer Finances distinguishes between “actual” and “usual” income precisely because current-year income can be temporarily depressed. In 2010, about a quarter of families reported that their actual income was unusually low relative to normal. That matters because it means many households classified as poor in a given year are experiencing a temporary dip, not living permanently at the bottom. 

In fact, the same survey found that a large share of households in the lowest quintile by actual income ranked higher when measured by usual income instead.

The tax data tell the same story. A Treasury study tracking taxpayers from 1996 to 2005 found that about 56 percent moved to a different income quintile over the decade. More important, roughly half of those in the bottom quintile moved up by 2005, depending on the measure used. About 29 percent moved up one quintile, another 29 percent moved up at least two quintiles, and roughly five percent moved all the way from the bottom quintile to the top quintile. That is not what a rigid caste system looks like. It is a dynamic picture in which many people pass through low-income years rather than remain stuck there permanently.


This is where so much bad policy begins. Politicians see a one-year income snapshot and talk as if they are looking at a permanent social class. They are not. They are often looking at transition.

This does not mean every measure of mobility is strong. A lot of the confusion comes from mixing together two different questions. The first is short-run income mobility: do people move up or down within their own lives? On that question, the evidence clearly shows substantial movement. The second is intergenerational mobility: do children rise above the economic position of their parents? That is a different question, and the answer there is more mixed.

The newer Census mobility data show that income mobility varies significantly by geography, age, race, and sex. And other work has shown that absolute mobility has weakened relative to earlier generations. Those are serious concerns. But uneven mobility is not the same as a large, fixed, poor class.

The latest Archbridge Institute report on social mobility in the 50 states broadens the analysis beyond annual income. Archbridge evaluates mobility through four pillars: entrepreneurship and growth, institutions and the rule of law, education and skills development, and social capital. It also distinguishes between natural barriers such as family instability or social networks and artificial barriers created by policy, such as excessive occupational licensing, weak school choice, or heavy regulation. That is a much better framework than casually conflating poverty, inequality, and mobility. 

The state rankings tell an important story. In Archbridge’s 2025 report, Utah ranked first, followed by Vermont, Montana, Wyoming, and Idaho. At the bottom were Louisiana, Mississippi, Alabama, New York, and Arkansas. That does not prove one policy explains everything. It does show that institutions matter.

Mobility is shaped by the rules, incentives, and social conditions people live under. The poor are not static, but the barriers they face can be.

This is where the free-market case becomes especially important. If you care about mobility, you should care about growth. The AEI “Land of Opportunity” project and its essay on the greatness of growth and the American Dream make the point clearly: growth is not a side issue. Growth is the oxygen of mobility. 

A faster-growing economy creates more businesses, more jobs, more opportunity, more room for incomes to rise, and more chances for people to accumulate wealth over time. A slower-growing economy makes class lines harder and mobility weaker.

That is why policies that burden growth hurt the poor most over time. Heavy regulation, bad schools, housing shortages, excessive licensing, and weak property rights do not just reduce efficiency in the abstract. They reduce mobility in practice.

A recent article highlights how land-use rules and housing constraints quietly kill mobility by making it harder for families to move to places with better labor-market opportunities. Another essay points to research showing that economic freedom, especially lighter regulation and stronger property rights, is associated with greater intergenerational mobility.

That is the key insight the static-poor narrative misses. If policymakers really want more upward mobility, the answer is not to freeze people into permanent income categories and redistribute more aggressively. The answer is to remove the barriers that keep people from climbing.

That means stronger growth, more entrepreneurship, more housing, better schools, more school choice, lower regulatory burdens, and institutions that reward work, saving, investment, and family stability. It also means respecting people’s freedom to vote with their feet toward states, cities, and communities with better opportunity. Mobility is not just something economists measure after the fact. It is something people actively pursue when they are free to move toward better institutions and opportunities.

The myth of the static poor survives because it is politically useful. It turns a moving picture into a still frame. It makes the government look like the only answer. But it misses the reality that most Americans who are poor at one point in time do not stay there forever, that incomes often rise over time, and that wealth accumulation frequently follows when people are free to work, save, invest, and build.

The real task is not to manage a permanently poor class. It is to build a freer society where more people can rise."

Thursday, May 28, 2026

Do Immigration Quotas Benefit Natives?

From Jeffrey Miron.

"In 1921 and 1924, Congress set nationality-based quotas for immigration.

Recent research looks at the impact

on the intergenerational mobility of US-born men. [The authors use] county-level measure[s] of exposure to the quotas … [and] census data … to link US-born sons to their adult outcomes and trace family background, geographic location, and occupational status over time.

Outcomes differed by race:

[T]he quotas slowed intergenerational mobility among US-born white men. … For [them] the negative effects of the quotas were smaller for sons of wealthier fathers. … US-born white men from more exposed counties [also] earned substantially lower wages in adulthood.

Alternatively,

[f]or black men, quota exposure was associated with increased intergenerational mobility, although [the results] … cannot rule out the possibility of no effect. [T]he quotas may have reduced competition for lower-skilled urban jobs, modestly improving occupational prospects for black men.

The most likely explanation for the quotas’ effects

is that immigrants complement native workers by raising their productivity and enabling them to specialize in higher-quality tasks. … [Indeed,] the negative mobility effects were nearly twice as large for white men living in counties with more reliance on non-English-speaking immigrant workers."

Wednesday, January 7, 2026

The Middle Class Is Shrinking Because of a Booming Upper-Middle Class

By Stephen J. Rose & Scott Winship of AEI.

"Abstract

Populists on both the political left and right routinely claim that the middle class has been hollowed out. These claims, to the extent they are based on evidence, rely on a relative definition of the middle class, such that if income doubles for every family, the middle class does not grow. Using an absolute definition of the middle class, we find that the “core” middle class has shrunk, but only because more families have become upper-middle class over time. The upper-middle class boomed from 10 percent of families in 1979 to 31 percent in 2024, and its share of income doubled. The share of families whose income left them short of the core middle class fell from 54 percent to 35 percent. Claims of a hollowed-out middle class wrongly reinterpret widespread (if unequal) gains across the income distribution as rising insecurity and declining living standards."

Wednesday, October 29, 2025

Economic Stagnation May Be Over (If We Can Avoid a Recession Soon)

By Jeremy Horpedahl. 

"The Census Bureau recently released a massive amount of new data on Americans and the US economy, as they do each year with their “Income, Poverty, and Health Insurance Coverage in the United States” release. The latest data cover the year 2024 and contain a lot of good news about how Americans are faring. In this post, I will focus on the income data that was released in this report. 

The most recent data show a convincing, optimistic story: contrary to the pessimistic, populist narrative that dominates our current political moment, the data show that last year, Americans of all stripes enjoyed record incomes and that gains appear to have accelerated since the mid-1990s. We should probably expect more gains in the years ahead—unless another recession ruins them.

It will probably not surprise you that the past five years have been a rocky time in the US for household and family incomes. The brief but sharp recession in 2020 knocked down incomes, and then the inflation that ramped up in 2021 and peaked in 2022 made it hard for incomes to keep up. And we can see this in the data. Thankfully, real (inflation-adjusted) income growth resumed in 2023, and by 2024, most measures of income in this report had returned to or even exceeded their 2019 levels.

This first chart shows inflation-adjusted median incomes for US households and families (which are a subset of households that contain related people living together), but we can get into more detail than just the median with this data release, too. Here are the long-run outcomes: since 1967, real median family income has increased by 74 percent, household income has increased by 53 percent, and personal income has increased by 71 percent. That’s all adjusted for inflation.


For the wonks interested in different inflation adjustments, I am using the Census’s preferred measure of inflation, the chained CPI back to 2000 and the retroactive CPI before that. If we had used a chained inflation measure throughout the series, such as the Personal Consumption Expenditures price index, the gains would have been even larger (e.g., 88 percent for family income, rather than 74 percent).

Five years of no or slight growth in incomes might not seem like much to celebrate, unless you realize this was probably the most turbulent economic period in the living memory of most adults today. It’s also useful to put those 2019 and 2024 peaks in historical perspective. And the return to growth and recovery of pre-pandemic income levels happened rather swiftly, at least as compared to recent history. 

For example, if we were looking at this data a decade later in 2014, we would notice that there had been essentially no improvement in median incomes since the year 2000, thanks to the slow recovery from two recessions in the 2000s. We observe this pattern throughout the history of the income data: when recessions happen frequently, median income stagnates, never getting a chance to surpass its prior peak. That’s the cautionary tale of this history: if another recession hits the US soon, we could be returning to a long stagnation of staying near the 2019 peak in income.

The chart above shows median income, the middle of the distribution. But it is also useful to look across the distribution of income to see if all are benefiting from economic growth. As the chart below shows, real household income declined across the distribution, bottoming out in 2022, and then recovered to at least the level of 2019. It’s true that growth has been best at the top of the income distribution, but the recovery happened across the distribution. In other words, Americans at all income levels are now at record high incomes (as always, adjusted for inflation).


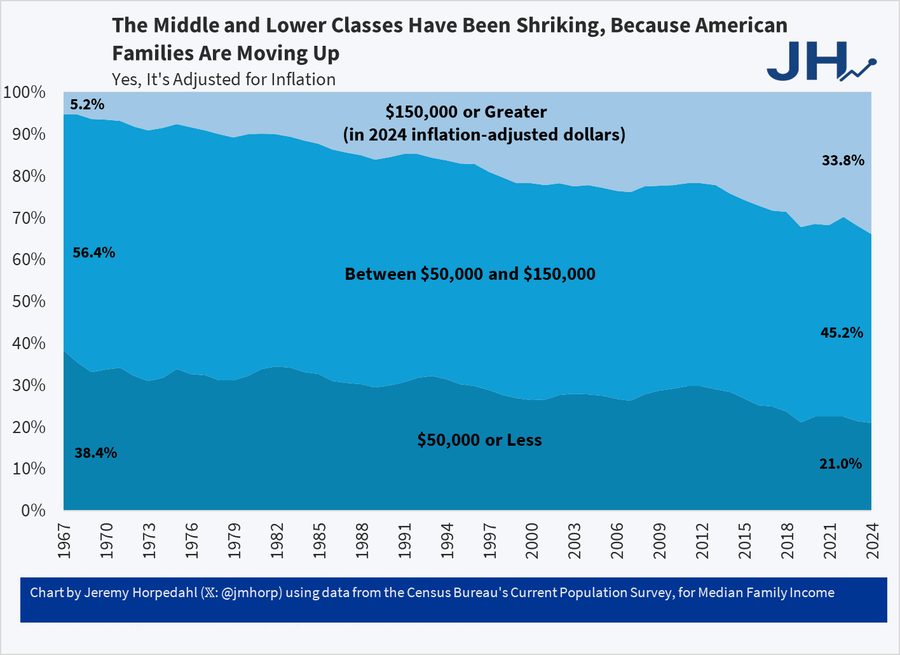
Another way we can examine income changes across the distribution is to take a longer historical perspective and look at the percent of families (here I am switching from households) that fall within certain income ranges. 


Where the breaks between groups should be isn’t an exact science, but I use about $50,000 above and below the median family income as reasonable cutoffs for the middle-income group. As we can see, the middle-income group was over half of the total in 1967, but this group’s size gradually shrank by about 10 percentage points over the next almost six decades. But notice that the lower-income groups shrank too. That’s because this chart shows one astonishing fact: the number of rich American families has skyrocketed, with over one-third now having at least $150,000 in income.

These trends are not sensitive to choosing different income cutoffs: if we use $200,000 as our definition of rich, the number has grown from 2 percent of families in 1967 to 21 percent in 2024. It also is not a trick of using families instead of households, as Mark Perry’s similar chart using households (and different income cutoffs than my chart) shows the same general trends.

What can we learn from these income trends?

The long-run positive trends show us that the American Dream is not dead, incomes are rising, more and more Americans are becoming quite wealthy, and the gains are spread across the distribution. While free markets in the US are infringed on by governments and special interests using government to tilt outcomes in their favor, the market continues to deliver the goods.

The decline of incomes through 2022 and the continued uncertainty equally show the folly of those government interventions. Government restrictions on business activity caused or, at the very least, contributed to the economic downturn in 2020. And the federal response through both monetary and fiscal policy in response to the downturn in many ways made things worse, especially the disastrous inflation of 2021–2023. The dramatic expansion of the money supply in 2020 was combined with multiple rounds of fiscal stimulus. Especially noteworthy is the 2021 American Rescue Plan, which was passed well after the initial crisis when the labor market had already been in recovery mode for almost a full year."