Evaluating the free market by comparing it to the alternatives (We don't need more regulations, We don't need more price controls, No Socialism in the courtroom, Hey, White House, leave us all alone)
Wednesday, September 7, 2022
Giving Thanks: Americans of all income levels are much wealthier today than we were only a few decades ago
"Thanksgiving
is my favorite holiday of the year. It has the gluttony and sloth of
Christmas, with little of the greed and envy. And it’s the only day of
the year for which it’s socially acceptable to spend three days making a
“side dish” that’s really your main course. Plus, of course, there’s family and football and parades and America(!) too. It’s great.
It’s also one of the few days where we Americans take
a moment to be expressly thankful for what we have. I remember as a dumb
teenager that this used to be my least favorite part of the
day—having to go around the table saying what we’re thankful for (“so
lame,” said Ungrateful Teen Scott)—but now it’s one of my favorites,
especially these last two pandemic years. So, in keeping with this
theme, today we’re going to spend some time being thankful for something
often overlooked in today’s economic policy circles: our historically
mind‐blowing age of material abundance.
Now, amid incessant news of inflation and supply chains and other
economic ripples, you may scoff at such “abundance” talk. But, in terms
of basic necessities like food, clothing, and home goods, it’s really
undeniable that Americans of all income levels are much wealthier today
than we were only a few decades ago. And this improving quality of life,
especially for lower‐ and middle‐income workers, hasn’t been fueled by
new debt but instead by a combination of higher incomes (which we
discussed at length last year) and lower prices (thanks, global competition!). Thus, everyday essentials’ “time prices”—i.e., the number of hours you’d need to work to afford something—have steadily (though unevenly) declined over the longer term.
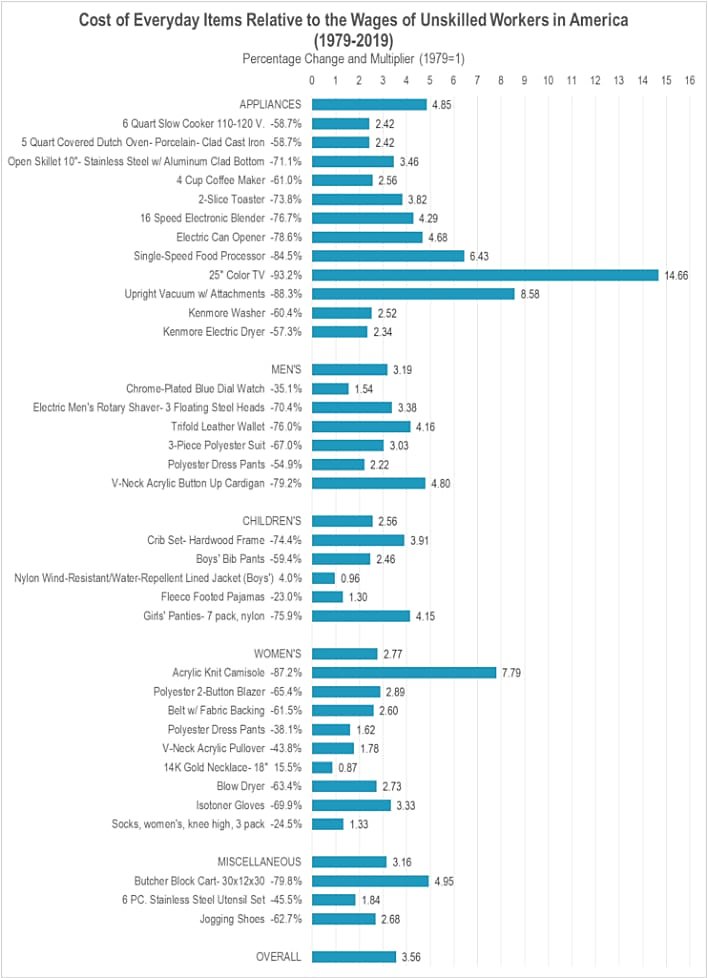
According to my Cato colleague Marian Tupy,
for example, the average amount of time that an unskilled American
worker had to work to earn enough money to buy a long list of everyday
items has dropped by 72 percent since the late 1970s (when, by
the way, U.S. manufacturing jobs were at their zenith). Put another way,
for the same amount of work that allowed a blue collar American worker
to purchase one item in 1979, he or she could buy 3.56 items in 2019 (on average).
Tupy (whose new book is a must‐have for your optimistic coffee table) and his colleagues have found
similarly impressive gains for American food consumption. Comparing the
prices of 42 items (proteins, grains, vegetables, and fruits) from the
early 1900s to the prices for the same items at Walmart today, and then
factoring in changes in wages over the same period for workers at the
bottom of the income ladder, they calculate that buying a basket of all
of these food items would have required 47 hours of unskilled work back
then but required only 10hours of that same work in
2019—a 79 percent decline. “Put differently,” they say, “an unskilled
laborer saw his or her purchasing power double every 34 years.” That’s
undeniably great.
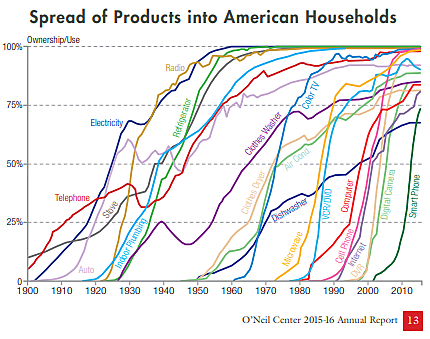
Americans’ increased long‐term purchasing power has unsurprisingly
translated to higher living standards. One of my favorite charts in this
regard comes from a 2016 Southern Methodist University report
showing the share of American households with access to telephones or
cell phones, electricity, air conditioning, home appliances, TVs,
computers, and other common household goods over time (data and sources
are noted on Page 16 of the report, if you’re interested):
As you can see, by 2015 the vast majority of American
households had these items, and many of these shares have increased even
further since then. According to Pew,
for example, now 97 percent of Americans have a cellphone (up from
91–92 percent in 2015), 85 percent have a smartphone (68–69 percent),
and 53 percent have a tablet (45 percent), while 77 percent have home
broadband (66–67 percent). The latest Census Bureau figures
(for 2019) further show that more than 91 percent of households have
AC, and about 85 percent have a washer/dryer. (By contrast, only about 5 percent of European households have AC—a share surely due in part to more temperate climates, but just as surely not all.)
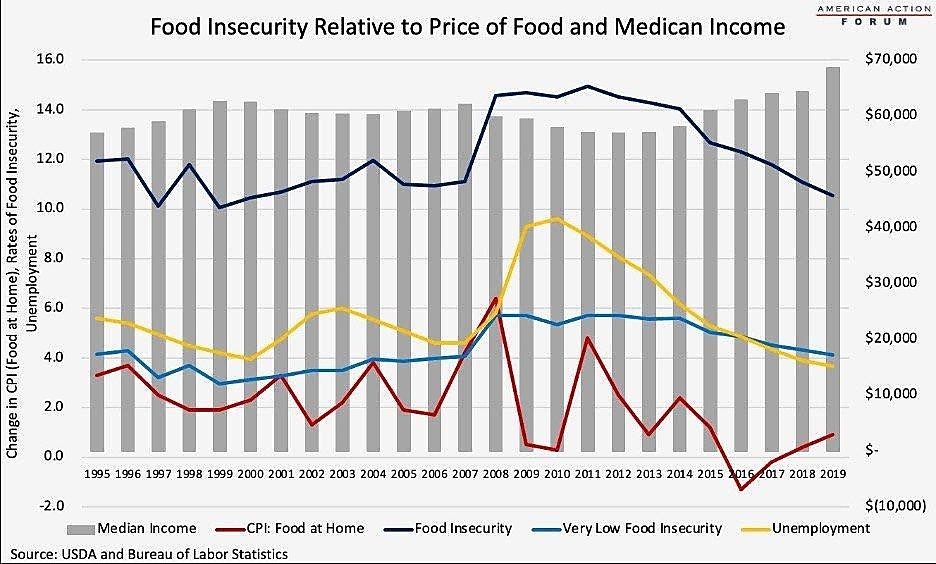
In terms of food consumption, we discussed earlier this year that Americans spent a historically low share of disposable income on food in 2019; “food insecurity,” meanwhile, reached an all‐time low before the COVID-19 pandemic hit:
Even in a time of relatively high inflation and higher
food prices, things are still better today than they were just a few
years ago—and much better than they were decades before that.
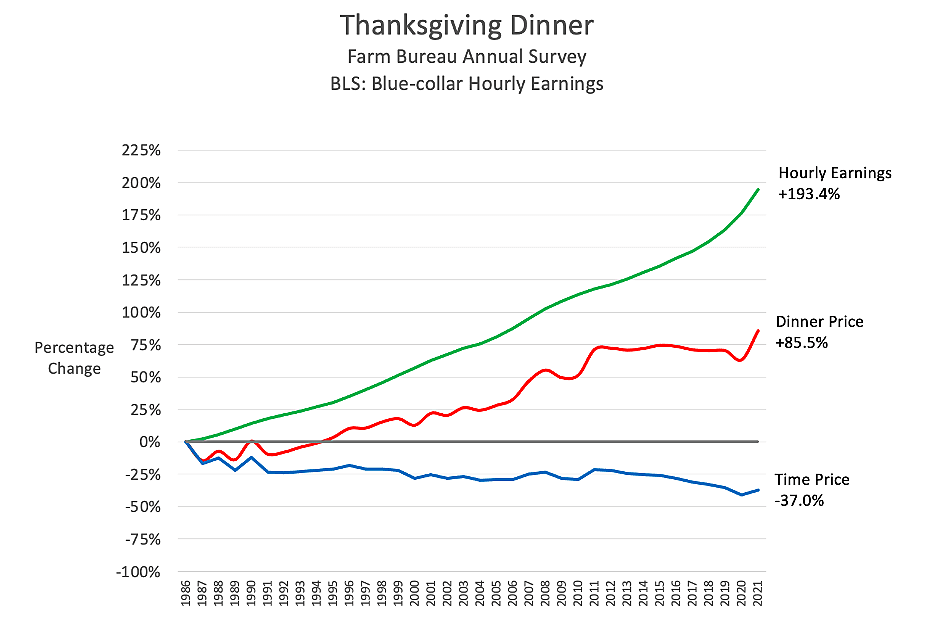
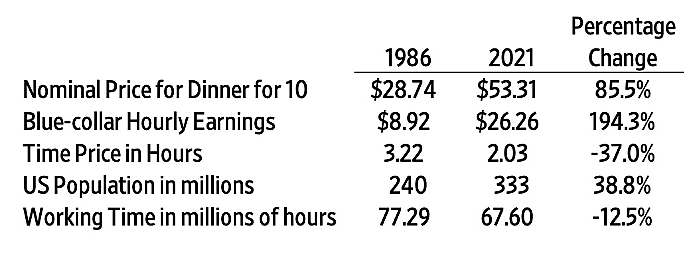
This includes Thanksgiving dinner, by the way. Responding to USDA figures showing a 14 percent increase in a traditional turkey dinner this year, Tupy last week recalculated the figures to account for blue‐collar earnings and to show the longer‐term trends:
Thus, that 14 percent price increase between 2020 and
2021 drops to 7 percent once you account for workers’ increased
earnings. And, even more importantly, this year’s “time price” is
actually a smidge lower than it was in 2019 (“the average American
worker will work 3 minutes less in 2021 than he or she did in 2019 to
pay for the meal”) and 37 percent lower than it was in the mid‐1980s:
These analyses hit on two things that are often
overlooked when we talk about prices and consumption: First, it’s
essential to consider not only the nominal (sticker) price of something
but also the incomes that pay for it. If the nominal price of a widget
remains flat, but you earn just a little bit more each year, then that
widget has, for you at least, actually gotten a little cheaper. The
second big thing is time (wow, deep): While short‐term price
(or, as we’ve discussed, income) changes tend to get all of the media
and policy attention, they often miss—unintentionally, one hopes—the realstory of long‐term, generational progress across a wide range of consumption metrics.
Gains in Americans’ purchasing power and material well‐being are
often pooh‐poohed by pessimistic folks in Washington, but they do matter—and far beyond just having another cheap T‑shirt or a sweet 4K TV. For example, research
from economist Bruce Sacrecdote finds that the consumption gains for
below‐median income families over the last six decades have been
incredibly impressive, even as income inequality has increased over the
same period. In particular, he finds that American households with lower
incomes not only have more cars and bigger houses than their
earlier‐era counterparts, but that their overall consumption
(adjusted for inflation) increased between 62 percent and 164 percent
between 1960 to 2015, not fully accounting for improvements in quality
(which for some items, such as cars and homes, have also been
substantial). In other words, poorer Americans today can consume about twice as many goods and services as did their 1960s counterparts.
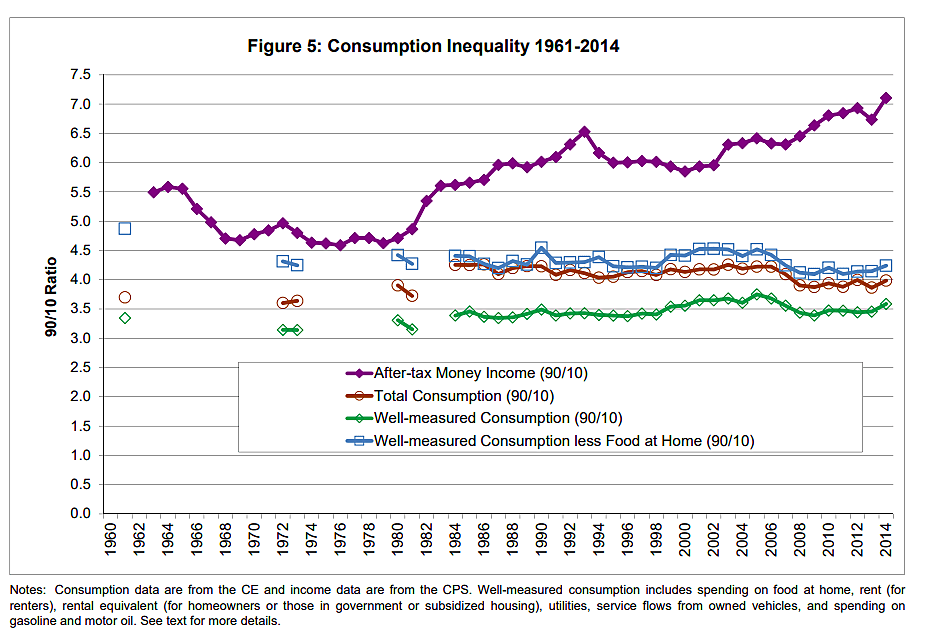
Accounting for consumption improvements also dramatically narrows inequality,
especially for single parents. As shown in the chart below, the rise in
income inequality as measured by the “90/10 ratio” (wealthy 90th
percentile Americans versus poor 10th percentile) far exceeded the 90/10
ratio change in consumption inequality (which was actually down in
recent years). So while wealthy Americans’ incomes may have outpaced
those of poor Americans in recent decades, there’s been little to no
change—and maybe even a little improvement—in terms of what we actually
consume (which is, you know, kinda the main point of those incomes).
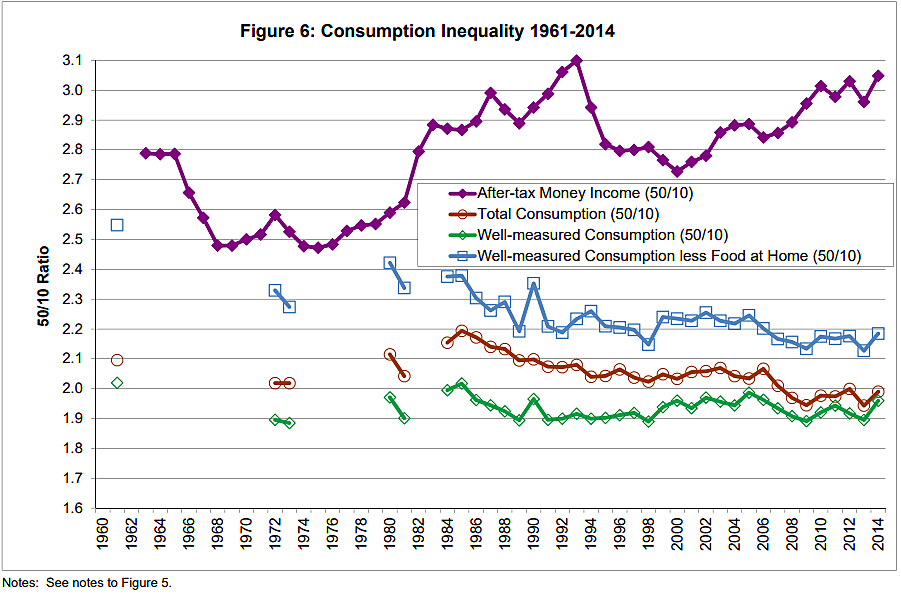
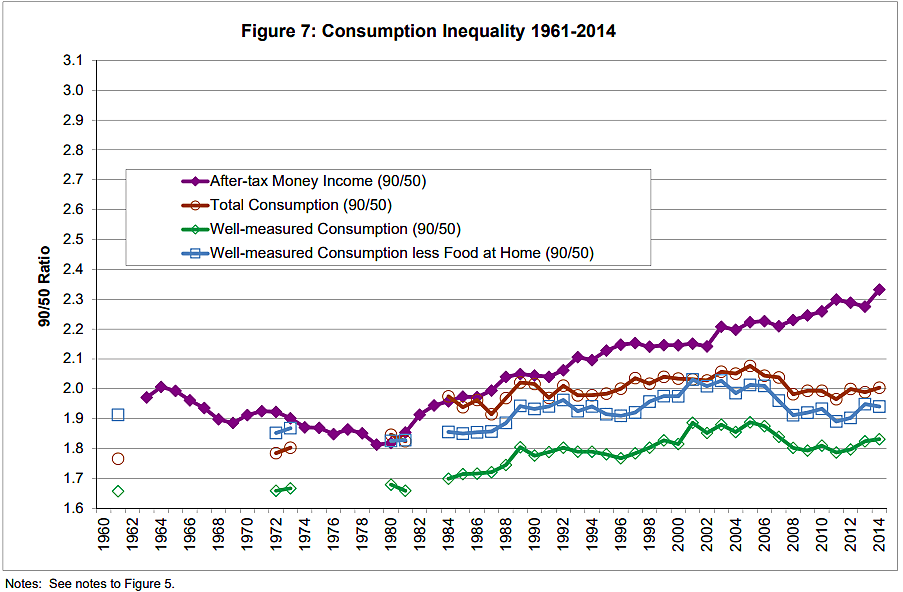
Similar divergence appears when you compare the middle class to the poor (50/10) or the wealthy to the middle class (90/50):
In fact, the middle class 50th percentile has made clear consumption gains on the rich 90th percentile.
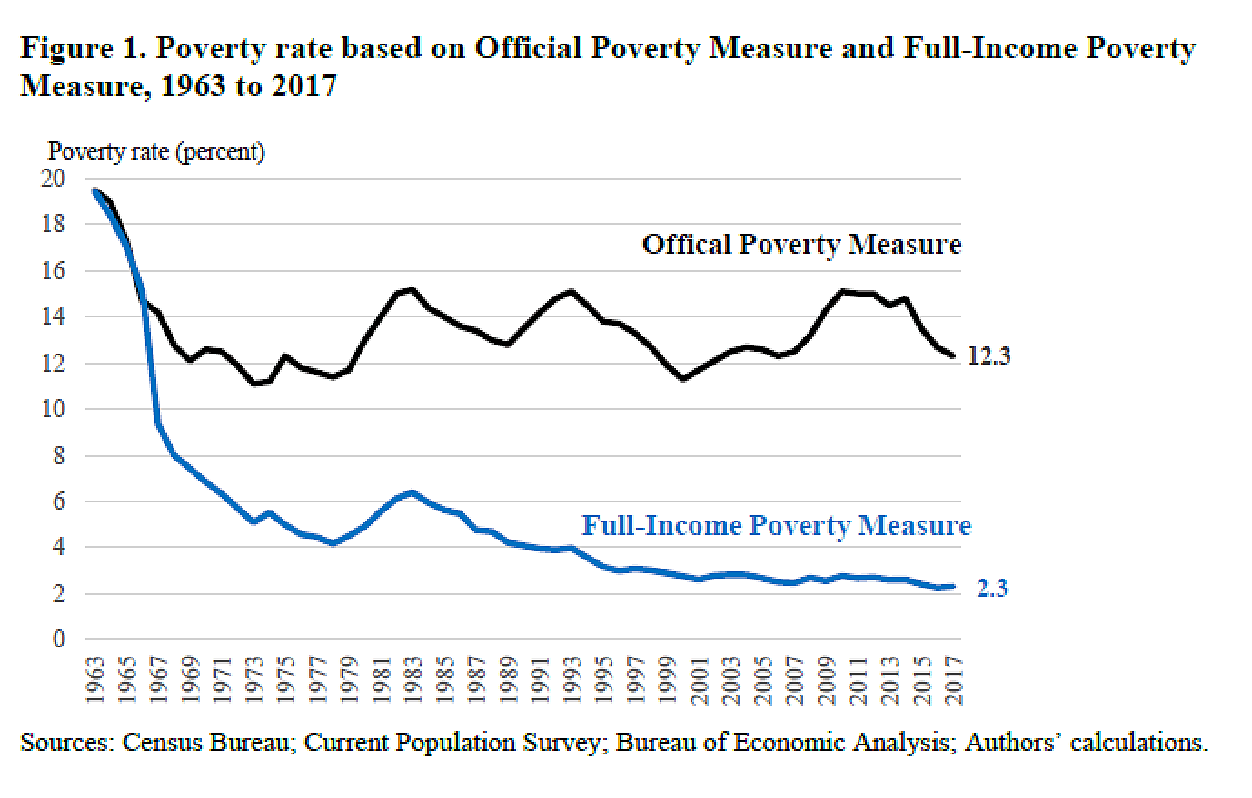
U.S. government definitions of poverty also consider both income and consumption needs (the “poverty threshold”), and both the standard and supplemental poverty rates hit all‐time lows in 2019 before the pandemic hit. The news is even better when you recalculate, as one recent paper did,
the figures using the same government poverty standard as established
in 1963 but more comprehensive and accurate measures of household income
and inflation:
Of course, getting even this small share of our fellow
Americans out of poverty is a worthwhile goal, and surely some
consumption challenges remain—particularly in health care, higher
education, and certain housing markets. However, we have more money to
spend on these services because of declining time‐prices elsewhere, and
these sectors are captured in the standard inflation metrics that have been outpaced by middle class wages over the last few decades. (More on these points here,
if you’re interested.) Some of these sectors, moreover, are regionally
concentrated or might be primarily a result of higher productivity
elsewhere in the economy (aka the “Baumol effect”—but
we’ll cover that in another newsletter). And, of course, each of these
sectors is already highly subsidized, protected, and regulated too.
Regardless, the general American consumption story over the last few
decades is undeniably great. Most Americans today enjoy living standards
that were reserved for billionaires a century ago and well above those of their 1960s counterparts.
Isolated swoons and challenges aside, the general direction of
America’s great prosperity machine is positive. And for that, we should
be thankful.
Now pass the stuffing."
No comments:
Post a Comment
Note: Only a member of this blog may post a comment.
No comments:
Post a Comment
Note: Only a member of this blog may post a comment.