"Americans are getting used to failures by government experts. Government economists have a dismal forecasting record. Government actions and advice during the pandemic were often misguided. And dozens of former government intelligence experts got the Hunter Biden laptop story wrong.
A less recognized but also important failure may be in nutrition. Federal experts appear to have issued faulty advice for decades, even as American obesity exploded from 15 percent in the 1970s to 42 percent today. Federal guidance on nutrition has a large influence on health practice across society. Some researchers argue that Americans have generally responded to the guidance, yet obesity has nonetheless soared.
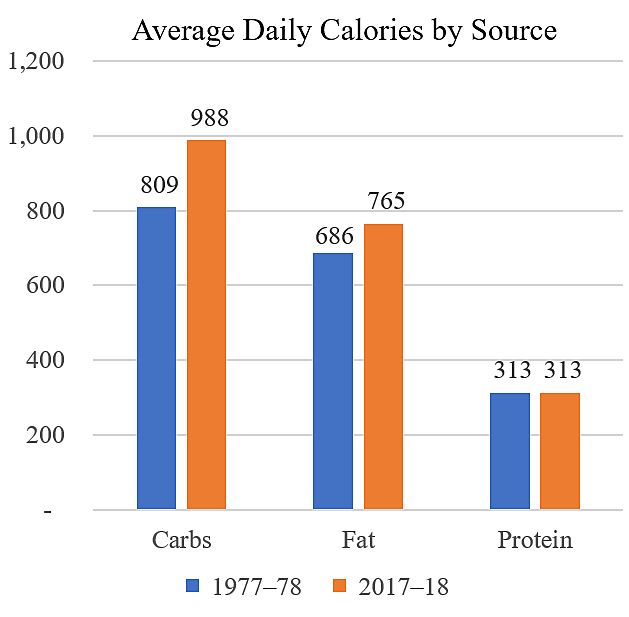
A clue to shortcomings in federal nutrition guidance comes from calorie data. A new U.S. Department of Agriculture (USDA) study shows that average daily calorie intake increased 21 percent from 1977–78 to 2003-04, and then started trending down. By 2017–18, calories were up 15 percent from the 1970s, but as the study notes, “the rise in obesity rate outpaced the increase in calorie intake.”
In a 2022 article, Professor of Nutrition Dariush Mozaffarian noted that “over the last 20 [years] we are not eating more calories, nor exercising less, but are still becoming more obese.” As average calories have dipped, the obesity rate rose from 31 percent in 2001–2002 to 42 percent today.
How can that be? Obesity is caused not just by the amount we eat but also what we eat. Generally, the government advised us to emphasize carbohydrates and deemphasize protein and fat, as shown in the food pyramid. But some nutritionists are now saying that was backwards. As a libertarian, I don’t want the government telling us what to eat, and our diets may have been better if that had been the case.
Like government experts, private‐sector experts get things wrong. But the government uses mandates and subsidies to impose its will, and its strong positions often displace other views. In a presentation at Cato, author and science journalist Nina Teicholz discussed the government’s flawed nutrition standards and the harm she believes they caused. She observed, “the level of certainty you need to have for public policy of an entire population ought to be very high,” and federal directives on nutrition fell far short of that level.
The chart shows average daily calorie intakes of Americans, based on the new USDA data. Carbohydrates are up 22 percent since the late 1970s, fat is up 12 percent, and protein is unchanged. It appears that we mainly want to look at carbs to explain the rise in obesity.
Below I excerpt from two studies that sync with Nina Teicholz’s views about the record of faulty government advice on protein, fats, and carbohydrates. I understand that other experts have conflicting views. Nutrition is a complex field and scientists have not figured it all out yet.
However, the costs of bad diets to individuals, the medical system, and society are huge, so we should pay close attention to government interventions. This is particularly true this year because Congress is set to consider another large farm and food subsidy bill, which may adversely influence American diets.
First, an excerpt from a 2015 study by Evan Cohen and colleagues in Nutrition. Note that the latest USDA data show fat calories up somewhat since this study was published.
Americans in general have been following the nutrition advice that the American Heart Association and the US Departments of Agriculture and Health and Human Services have been issuing for more than 40 [years]: Consumption of fats has dropped from 45% to 34% with a corresponding increase in carbohydrate consumption from 39% to 51% of total caloric intake. In addition, from 1971 to 2011, average weight and body mass index have increased dramatically, with the percentage of overweight or obese Americans increasing from 42% in 1971 to 66% in 2011.
… Since 1971, the shift in macronutrient share from fat to carbohydrate is primarily due to an increase in absolute consumption of carbohydrate as opposed to a change in total fat consumption. General adherence to recommendations to reduce fat consumption has coincided with a substantial increase in obesity.
… Since the late 1970s, the US government, following the American Heart Association (AHA) and much of academia, has consistently recommended lowering the dietary percentage of fat and saturated fat, as well as the absolute levels of dietary cholesterol, based on a theoretical link between those food components and higher risk for coronary heart disease. This government guidance suggested that the reduction of dietary fat would be accompanied by a concurrent increase in the dietary share of carbohydrate. Taken together, these recommendations were also considered to be beneficial for the prevention of overweight and obesity, along with diabetes, cancer, and other chronic diseases.
… In 1961, spurred by emerging medical and epidemiologic research, the AHA issued dietary recommendations to ‘reduce the intake of total fat, saturated fat, and cholesterol. In 1977, the US Senate Select Committee on Nutrition and Human Needs issued Dietary Goals for the United States, which recommended that fat consumption be reduced to 30% of energy intake, and that carbohydrate consumption be increased to account for 55% to 60% of energy intake.
Following this report, Dietary Guidelines for Americans, issued by the USDA and the US Department of Health, Education and Welfare (now the Department of Health and Human Services; DHHS) in 1980, recommended a reduction in the consumption of the share of total macronutrients attributable to fat and saturated fat, and a reduction in the absolute consumption of cholesterol. To compensate, the guidelines recommended increasing consumption of carbohydrate as a share of total calories because “carbohydrates contain less than half the number of calories per ounce than fats.”
During the 1980s, the federal government continued to issue reports and recommendations encouraging Americans to limit fat consumption. In 1982, the Committee on Diet, Nutrition, and Cancer of the National Research Council issued Interim Dietary guidelines that recommended fat intake be lowered from 40% to 30% of total calories in the diet, officially endorsing the AHA’s recommendations from 1961 and the Senate committee’s recommendations from 1977. The USDA and DHHS recommendations have remained largely unchanged since 1980. In 1992, the Food Guide Pyramid was released, urging Americans to use fats, oils and sweets “sparingly,” and to consume between 6 and 11 servings of bread, cereal, rice, and pasta.
… There is a strong relationship between the increase in carbohydrate share of total intake and obesity.
… this study demonstrated that general adherence to government dietary recommendations to decrease fat share of total dietary intake has been accompanied by a rapid increase in obesity rates.
Second, an excerpt from a 2022 study by Joyce Lee and colleagues in Frontiers of Nutrition:
[From 1800 to 2019] processed and ultra‐processed foods increased from <5 to >60% of foods. Large increases occurred for sugar, white and whole wheat flour, rice, poultry, eggs, vegetable oils, dairy products, and fresh vegetables. Saturated fats from animal sources declined while polyunsaturated fats from vegetable oils rose. Non‐communicable diseases (NCDs) rose over the twentieth century in parallel with increased consumption of processed foods, including sugar, refined flour and rice, and vegetable oils. Saturated fats from animal sources were inversely correlated with the prevalence of NCDs.
… Ancel Keys’ Diet‐Heart Hypothesis posited that the mid‐nineteenth century heart disease epidemic resulted from “a changing American diet”: increased consumption of fats, especially saturated fatty acids (SFAs), and decreased grain consumption.
… The unprocessed elements of our nineteenth century diet–animal fats, whole fat dairy, fresh vegetables, and fresh fruits—were progressively replaced with more processed elements, including industrial seed oils, HFCS, and ready‐to‐eat snacks and meals. The data do not support the widely publicized [Ancel Keys’] “changing American diet” of increasing animal‐derived SFAs over the first 60 years of the twentieth century.
Rather, polyunsaturated fats and partially hydrogenated fats from vegetable oils progressively replaced lard, butter, and other animal‐derived fats. Across the twentieth century, rising rates of obesity, diabetes, heart disease, and cancer were associated with stable SFA consumption. Yet, large increases in sugar and refined carbohydrate consumption and more modest increases in total calories make refined carbohydrates and total calories more likely factors than SFA in NCD pathogenesis.
… The increased consumption of red meat and SFAs as the cause of the heart disease epidemic was one foundation for Keys’ Diet‐Heart Hypothesis, strengthened by authoritative repetition, including McGovern’s Senate Select Committee’s Dietary Goals for America (1977), Science in the Public Interest’s (1978) monograph The Changing American Diet, the New York Times columnist Jane Brody’s (1985) Good Food Book, Surgeon General Koop’s Report on Nutrition and Health (1988), and the World Health Organization’s Diet, Nutrition, and the Prevention of Chronic Diseases (1990). However, neither the USDA nor other data supported this narrative.
… The alleged increase in American SFA consumption in the twentieth century was considered the cause of the dramatic rise of non‐communicable diseases (NCDs) … [But] our findings suggest that SFAs are unlikely to drive obesity, diabetes, or other NCDs.
… US and international agencies and medical associations strongly supported a low‐fat/low‐SFA, high‐carbohydrate diet for everyone over age 2 years, and through 2008, advocated sugar as healthy for diabetics and the general population.
… Evidence supports both the roles of energy balance and refined carbohydrates‐insulin mechanisms in obesity, with their relative roles likely varying based on genetics and other factors.
… our findings suggest that increased sugar and refined carbohydrate consumptions during the twentieth century in America may have played a larger role than total calories or physical activity, although this remains a speculation without accurate data on all variables.
Data Notes: The chart shows average daily calories for all Americans over age two. USDA data on grams were converted to calories using 4 grams per calorie for protein and carbohydrates and 9 grams per calorie for fat. Using this approach, the sum of calories in the chart matches the USDA total for 1977–78 but understates the total for 2017–18 of 2,093 calories. More on nutrition and the farm bill here and here. The Nutrition Coalition explores these issues here."
Thursday, April 27, 2023
Nutrition: Major Government Fail?
By Chris Edwards of Cato.
#/media/File:USDA_Food_Pyramid.gif)
Subscribe to:
Post Comments (Atom)
No comments:
Post a Comment
Note: Only a member of this blog may post a comment.