Sunday, October 25, 2026

Between 1900 and 1990, real consumption of house furnishings and apparel grew by a factor of 114

See Cataloging Growth: A Re-Evaluation of 1900–1990 by Veonica Backer-Peral & Benjamin Wittenbrink. 

"Measuring real GDP growth requires distinguishing changes in prices from changes in product quality and composition, yet systematic quality adjustment of price indexes is unavailable for much of the twentieth century. We construct a new quality-adjusted price index for U.S. house furnishings and apparel goods using 5.1 million product listings from Sears catalogs, 1900–1990. We use large language models to extract product information and estimate hedonic price schedules with detailed product characteristics, allowing us to infer annual changes in the cost of living. The resulting cost-of-living index implies substantially lower goods inflation than conventional deflators, and consequently implies much faster real economic growth: between 1900 and 1990, real consumption of house furnishings and apparel grew by a factor of 114 using our index, compared with a factor of 24 using standard goods deflators. The gap between our index and canonical ones is largest before World War II and suggests that productivity growth peaked earlier in the twentieth century than conventional estimates indicate."

Self-Destructive Class Warfare in the United Kingdom, Part II (high taxes sending the rich away)

By Dan Mitchell.

"Last year, in Part I in this series, I warned that the United Kingdom was pursuing a “sure-to-fail policy.”

More specifically, I explained that the class-warfare attacks on upper-income taxpayers were going to backfire for the simple reason that entrepreneurs, investors, and business owners could “vote with their feet” by moving to nations with better policy.

Which is exactly what’s been happening.

Today’s column will share fresh evidence on the consequences of the U.K.’s suicidal tax policy.

We’ll start with some excerpts from a new story in Bloomberg by Benjamin Stupples.

The exodus of the uber-rich from the UK has become a $160 billion problem. That figure, calculated using data from the Bloomberg Billionaires Index, lays out for the first time the vast amounts of money and assets behind those quitting Britain. It’s the total wealth represented by individuals tracked in the list who have loosened their ties with the UK — or cut them entirely — just in the past two years. …Tax changes targeting the wealthy since Labour came to office in 2024 are taking a growing toll…and near constant speculation that more measures are coming, has dramatically frayed the relationship between the well-heeled elite and the government. …The top 1% of UK earners account for about 27% all income tax revenue, according to government figures. When they leave, they also take their hefty spending power. …Half of the overall group finalized their departures from the UK — to territories spanning Monaco, Switzerland and the United Arab Emirates — in the weeks leading up to Labour bringing in sweeping tax reforms in April 2025.

Here’s a chart from Bloomberg listing the rich people who have escaped.

But that list is incomplete.

Today’s news adds even more evidence. As reported by Maira Butt for the Independent, another wealthy taxpayer has decided that the United Kingdom is no longer a good place to live.

Instead, he has decided that zero-income-tax Monaco is a good place to reside.

A billionaire who formerly topped the Sunday Times Rich list has become the latest wealthy businessman to leave the UK to take up residence in Monaco. David Reuben, 88, is a property tycoon and Newcastle United shareholder, who along with his younger brother Simon Reuben, has a combined estimated net worth of nearly £28bn. …A spokesperson confirmed to the publication that the property tycoon had moved to Monaco but declined to comment further. …Last week, billionaire Manchester United owner Sir Jim Ratcliffe complained that Britain’s billionaires were leaving as the country was “on the slide” and blamed high taxes and high immigration for the decline. The remarks followed the departure of several of the UK’s highest earners… More than 10 per cent of the total wealth identified in the Rich List is controlled by UK citizens who now reside in Monaco, a total of £77bn, according to The Times.

I’ll close with the depressing observation that the out-migration of successful taxpayers began when the so-called Conservative Party was in charge.

Because they were fiscally irresponsible, they imposed class-warfare taxes.

Once the Labour Party took over, they doubled down on that misguided approach.

The only silver lining to this dark cloud is that we’re getting more evidence for the Laffer Curve.

P.S. One takeaway from today’s column is that the U.K. desperately needs Milei-ism."

Saturday, October 24, 2026

Has Mexico’s “Canasta Básica” Policy Made Food More Affordable?

By Jeremy Horpedahl.

"A recent article in The Guardian profiles economist Isabella Weber. She doesn’t seem to like other economists very much, supposedly because we “obsess over ideological purity and are inflexible when searching for solutions.” Weber wants economists to come up with solutions that work even if… I guess, even if they don’t work well in theory? Maybe they will work well in practice?

Anyway, so far as I can tell, the article only gets into details on two concrete solutions to affordability. I’m sure she has more in her book, but let’s see what these are. The first for governments to create “publicly owned entities that can buy and sell grain into its market,” presumably to smooth out fluctuations in grain prices. The second is “the Mexican government’s canasta básica policy, through which retailers voluntarily cap the total price of a basket of two-dozen essential goods.”

Let’s look at the second one, since I think for developed countries like the US, fluctuating grain prices aren’t the primary source of affordability concerns. But perhaps American consumers would like a basket of grocery essentials to be cheaper.

Has this policy in Mexico worked? It was first implemented in 2022, and food inflation has certainly fallen in Mexico since then. But it has also fallen everywhere else in the world — 2022 was peak inflation not just in the US, but in most countries — so we can’t judge the success of the program based on that alone.

Instead, we can look at internationally comparable data on food spending, which comes from the USDA’s Economic Research Service. Our World in Data has a nice chart based on this data, and even though it is now two years out of date (I will provide 2025 data below), the 2023 data makes a case against the success of the “price controls” in Mexico (I put “price controls” in quotes because it is not a true price control, but an attempt to control prices via incentives):

Figure 1

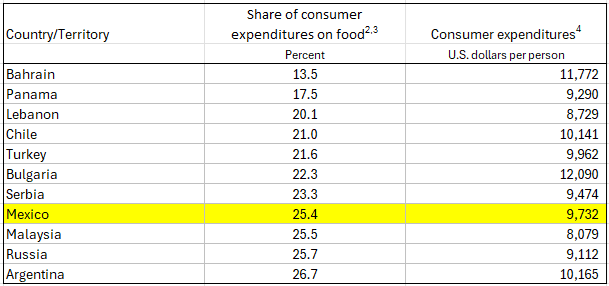
It will probably not surprise you that the US spends much less on food as a percent of total spending than Mexico, given that we are a high-income country. But it is still worth pointing out just how low food spending is in the US. However, this chart still paints Mexico in a very poor light: for countries with about the same income level in the Americas (as measured by consumer expenditures), Mexicans spend much more on food than Argentina, Chile, or Panama.

If we use the 2025 USDA data, and focus on the 10 countries with consumption expenditure closest to Mexico (between about $8,000 and $12,000 of consumption), we see that Mexico is very much on the high end: only Argentina was clearly higher:

Table 1

Finally, we can compare Mexico against itself in this data, looking at food spending going back to 2017:

Figure 2

Food spending actually peaked in 2020, though be cautious of any data from 2020 as the pandemic made data collection difficult. After declining in 2021 and then into 2022 (the policy seems to have been put in place in mid-2022), there haven’t been any further declines. And food spending is still well above pre-pandemic levels (unlike the US, where the 2025 figure of 6.4% is the same as 2017-18).

Ultimately, we would want a more sophisticated analysis than my simple tables and charts here. But it doesn’t appear that Mexico’s 2022 policy really made food much more affordable, either relative to peer countries with similar income levels, or relative to Mexico’s own recent history. And that’s even before we get into any unintended consequences of the “price controls.” Of course, the policy may have made that basic basket of two-dozen items more affordable than it otherwise might be — for that we would need to compare individual item prices to peer countries — but it hasn’t obviously made food overall more affordable in Mexico."

Asian females out earning white males

From Mark Perry. Excerpt:

"Asian women have out-earned White men in each of the last 12 quarters over the last three years. In the most recent quarter (2026:Q3), White men earned only 92.6 cents for every $1 earned by Asian women, a GENDER/RACE EARNINGS GAP of 7.4% favoring Asian women."  

May be an image of text 


Friday, October 23, 2026

Income-based Ginis exceed consumption-based ones by 4.7 points on average globally, and by as much as 10 points in some regions

Lidia Ceriani and Paolo Verme. 

Abstract: The Gini index remains the most important measure of economic inequality worldwide, and accurate estimates of this index are essential for effective public policies. Yet, Gini estimates for the same country and year vary considerably across data sources, a problem that remains largely unresolved. The paper reviews the largest global and regional databases providing Gini estimates, surveys the related literature, and constructs a unified dataset of 122,351 Gini observations spanning 222 countries and territories and 158 years, from 1867 to 2024. The analysis of this new dataset shows that income-based Ginis exceed consumption-based ones by 4.7 points on average globally, and by as much as 10 points in some regions, with these gaps widening over time. The gross--net income distinction and the use of alternative equivalence scales together with several other measurement choices add further systematic differences. Based on these findings, the paper provides correction factors that can be used to harmonise Ginis built on different welfare concepts. We further show that overall divergence across databases has grown only modestly since 1960, and mainly through the proliferation of databases rather than through genuine divergence among long-standing sources. Thus, improving on the existing discrepancies across Ginis globally is possible, but ultimately depends on database administrators disclosing full details of Gini construction and on users selecting Ginis built on comparable measures.

A Health Economist Regrets Supporting the ACA

By Michael F. Cannon.

"Dana Goldman is a top-notch health economist and the founding director of the University of Southern California’s Schaeffer Institute for Public Policy and Government Service. On October 22, he published a courageous and eye-opening mea culpa that everyone should read:

In November 2009, I joined 10 other economists in a letter urging Congress to pass a bill that became the Affordable Care Act. I could hardly imagine what would come next.

The ACA promised to expand coverage, and it did. But I signed the letter primarily because the ACA promised to “bend the cost curve” of American health care, which was getting out of control.…

The curve did not bend, and I now wish I hadn’t signed my name to that letter.

Why did Obamacare fail to contain costs?

I, and many of my economist colleagues, didn’t foresee how many of the ACA’s cost-control and financing provisions would be stripped out by Congress, on a bipartisan basis, or watered down over the following decade.

That was true of many health economists. But many saw this coming. We warned the world as loudly as we knew how. In July 2009, I wrote:
… the administration agreed that the new subsidies would start flowing immediately, while the pay cuts would take effect over time. That means the pay cuts may never take effect at all: physicians have been blocking their own scheduled pay cuts for nearly a decade…
All [the industry deals] are contingent on the favored groups getting something they want, and all “savings” could be undone by future lobbying. To paraphrase George Bailey, the industry isn’t selling — the industry is buying.
In December 2009, when the ACA’s authors were drafting the financing provisions that Congress would later strip out, I wrote:
Senate Democrats promise to fund half of their new entitlement with $491 billion of Medicare cuts.…Congress frequently reneges on such promises. Want proof? At the very same time Congress is promising to cut future Medicare spending by $491 billion, it is reneging on a past promise to cut Medicare’s physician payments by $210 billion. Even Medicare’s chief actuary calls the (new) promised cuts “doubtful” and “unrealistic.”
In March 2010, I wrote:
… this legislation would set in motion political forces that would make additional spending inevitable. It would create new constituencies for government spending, hook existing constituencies on even more government spending, and promise implausible cuts in existing subsidies to constituencies that are highly organized and vocal.

I made similar points in 2010 (here, here, here, here, here, here, and here), 2011 (here, here, here, here, here, and here), 2012 (here, here, and here), and 2013 (here, here, here, here, here, here, here, here, here, and here).

In 2011, when I was trying to prevent the spigot from opening, I explained that the dynamic behind these predictions is something economists have known about for some time:
The measure repealing the 1099 mandate may itself increase the deficit slightly. It will reduce federal tax collections by $17 billion, and the offsetting spending cuts are highly questionable. This vote’s real significance, however, is that it shows why ObamaCare’s entitlement spending would survive the political process while its revenue-raising provisions would not.…

When the political process “goes to work” on the rest of ObamaCare’s various provisions, the revenue-raisers will fall because they get the formula wrong, while the entitlement spending will survive because it gets the formula right.…

The 1099 mandate is actually the second ObamaCare revenue-raiser to fall. Worried about the political fallout from private insurers exiting the Medicare program, the Obama administration rather transparently forestalled cuts to Medicare Advantage by granting $1.3 billion of “quality-based” bonuses to mediocre and low-performing MA plans. 

This public-choice dynamic is why the Congressional Budget Office, the chief Medicare actuary, and even the International Monetary Fund have discredited the idea that ObamaCare will reduce the deficit. It is one of the principal reasons why, as Thomas Jefferson wrote, “The natural progress of things is for liberty to yield, and government to gain ground.” In other words, the game is rigged in favor of bigger government. 

It also explains why the Obama administration is sprinting to implement ObamaCare in spite of a federal court having struck down the law as unconstitutional. As that and similar cases work their way toward the Supreme Court, the White House needs to get some concentrated interest groups hooked on ObamaCare’s subsidies–fast.

If Goldman receives praise for admitting error, it will encourage others to do the same. If he receives scorn, it will have the opposite effect."

Thursday, October 22, 2026

Uncapping the Payroll Tax Would Raise the Top Marginal Tax Rate on Wages to Above 60 Percent in Some States

By Kyle Pomerleau of AEI.

"Social Security’s trust fund is nearing insolvency. The latest trustees report projects that the Old-Age and Survivors Insurance Trust Fund will run out in late 2032. If this occurs, benefits paid will be limited to payroll tax revenue, resulting in a roughly 22 percent benefit cut. Some lawmakers have suggested eliminating the payroll tax cap to help close the gap. This would raise revenue, but it would push top marginal tax rates on wages to over 60 percent in some states. 

Social Security is financed with a 12.4 percent payroll tax on employee wages and a matching tax on self-employment income. The tax is split evenly between the employee and employer. The payroll tax is “capped,” meaning that it applies only to the first $184,500 in wages and salaries (in 2026). 

Several proposals would eliminate or alter the cap. Two proposals would introduce a “donut hole” by applying the payroll tax to earnings above either $250,000 (Social Security Expansion Act) or $400,000 (Social Security 2100 Act). A proposal by Sens. Elizabeth Warren (D-MA) and Bernie Moreno (R-OH) would apply the payroll tax to all earnings. 

Eliminating the payroll tax cap would raise the top marginal tax rate on labor earnings. The top marginal tax rate is the combined federal, state, and local tax that a top earner pays on each additional dollar of wage and salary income. 

For example, a top earner in Massachusetts faces a top marginal tax rate of 49.5 percent. This includes the top individual income tax rate of 37 percent, the 2.9 percent Medicare payroll tax, the 0.9 percent Additional Medicare Tax, and Massachusetts’s top income tax rate of 9 percent.1 Eliminating the cap would raise the top marginal tax rate in the state by 8.7 percentage points to 58.2 percent. 

The top marginal tax rate would depend on where a taxpayer resides. The top marginal tax rate would rise to 63.1 percent in New York City, 63 percent in California, and 59.7 percent in Washington, DC. In states without an income tax, the top rate would rise to 49.4 percent. This would be the highest top marginal tax rate on wages since the Tax Reform Act of 1986.

Lawmakers should proceed with caution. 

First, higher top marginal tax rates reduce the incentive to work. This is because eliminating the cap would reduce the after-tax wage that an individual earns. For example, top earners in Washington, DC, would experience a 17.4 percent reduction in their after-tax wage rate if the cap were eliminated. Using the Congressional Budget Office’s estimate that the labor supply elasticity (or responsiveness) of high-income workers is 0.17 (net of the income effect), this would imply a reduction in hours worked of 3 percent for those facing the top marginal tax rate. 

Second, eliminating the cap would exacerbate the incentive for business owners to reclassify their income. Owners of partnerships and S corporations can split their income between profits and wages. The tax code creates an incentive to pay more income out as profits because profits are taxed at a top federal income tax rate of 29.6 percent (37 percent reduced by the 20 percent deduction for pass-through business income) compared to the top federal tax rate on wages of 40.2 percent. Eliminating the cap would widen that gap from 11 percentage points to 19.8 percentage points. 

Third, eliminating the cap would reduce revenue from other taxes. Because the employer-side payroll tax is borne by workers in the form of lower W-2 wages, raising it shrinks the base of the income and employee-side payroll tax. The Joint Committee on Taxation estimates that for each dollar raised by the payroll tax, the federal government collects only 86 cents. Furthermore, the reduction in hours worked would mean that total taxable income would fall, offsetting an even larger share of the initial tax increase. 

Finally, eliminating the cap would delink taxes from benefits. One of the virtues of the current Social Security system is that benefits and taxes are at least loosely linked. The more an individual works, the more they pay in payroll taxes, but also the more they accrue in future benefits, up to the cap. This limits the work disincentive effect because future benefits partly offset taxes at the margin. Eliminating the cap without expanding benefits would make the tax on earnings above the cap a pure tax, with no offsetting benefit. 

Lawmakers are right to be concerned about the future of Social Security. Reform will require changes to both spending and revenue. It matters, however, how those changes are structured. Eliminating the cap on the payroll tax would come with important economic trade-offs. 


[1] The top marginal tax rate is calculated on total labor compensation, including the employer-side payroll tax. Assumes Massachusetts’s paid family leave payroll tax remains capped."