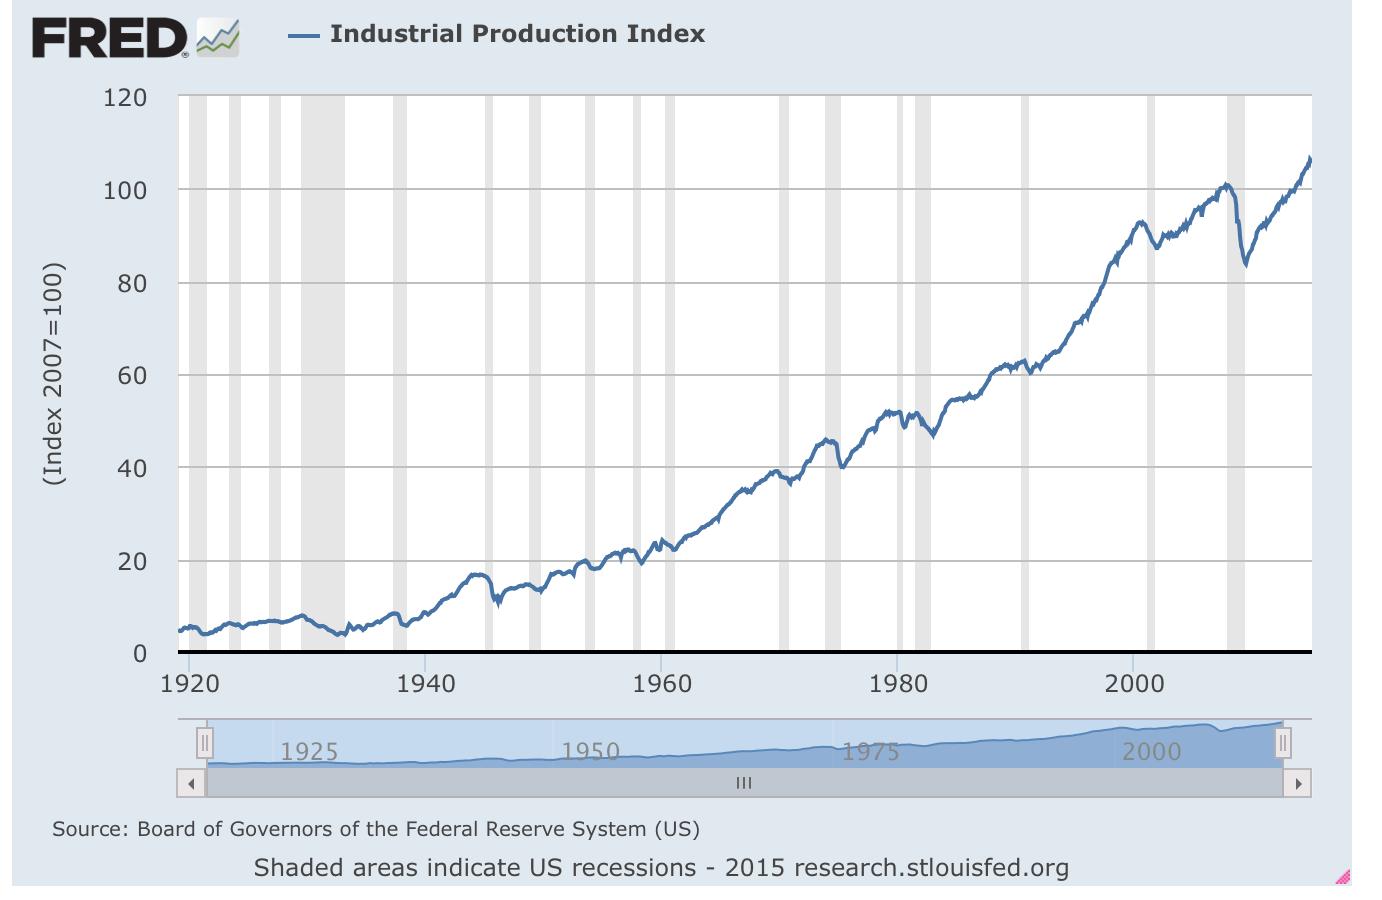
"It’s impossible to encounter the news these days – on air, on paper, in cyberspace, in personal conversations – without regularly reading or hearing some lament about how Americans no longer produce things or, as a variation on that theme, about how policymakers should aim to create a ‘renaissance’ of American industry.
Here’s a graph from the Fed (click to enlarge):
"
Saturday, February 21, 2015
American Industrial Production: 1919-2015
From Don Boudreaux of Cafe Hayek.
 "
"
Friday, February 20, 2015
Evidenced-based Sea Level Rise Projections Remain Low
From Paul C. "Chip" Knappenberger and Patrick J. Michaels of Cato.
"When it comes right down to it, the biggest potential threat from a warming climate is a large and rapid sea level rise. Everything else that a changing climate may bring we’ve seen before (or at least the likes of it), recovered from, and are better off for it (i.e., gained experience, learned lessons, developed new technologies, etc.). In fact, the more often extreme weather occurs, the more adaptive is our response (see for example, decreasing mortality in heat waves). So in that sense, climate change may hasten our adaptive response and reduce our overall vulnerability to it.
A large and rapid sea level rise is a bit of a different story—although perhaps not entirely so.
While we do have a large amount of infrastructure (e.g., big cities) in low-lying coastal regions, it is completely wrong to show them underwater in the future—a typical device used by climate activists. What will happen is that we will act to protect the most valued portions of that infrastructure, as shown in a recent report from leading experts (including from the U.S. Environmental Protection Agency) on sea level rise and response.
But, while targeted action will save our big cities, there is still a lot of real estate that will be lost if sea level rises a large amount in a short amount of time (say, by more than a meter [a little more than 3 feet] by the end of the 21st century).
We therefore keep a vigilant eye on sea level rise research. And what we’ve concluded is that sea level rise by the year 2100 is very likely to be quite modest, say about 15 inches—an amount that should allay concerns of a catastrophe. We’ve detailed literature in support of our conclusions here, there, and elsewhere.
This week, a new paper has come to our attention that further supports our synthesis.
In the journal Quaternary Science Reviews, researchers Nicolás Young and Jason Briner summarized the extant scientific literature on the size of the ice sheet covering Greenland during warm periods in the recent geologic past, with a special emphasis on the middle Holocene—a multi-millennial period centered some 3,000–4,000 years ago during which the temperatures across Greenland were about 1°–3°C higher than the 20th century average. They note this is similar to conditions projected to occur there by about the year 2100.
What Young and Briner found was that the size of the Greenland ice sheet—especially the best observed portions covering the west and southwestern parts of Greenland—during the mid-Holocene was smaller than it is today—but not by a whole lot. They wrote:
[W]e suggest that despite some degree of inland retreat, the West and Southwest [Greenland ice sheet] margin remained relatively stable and close to its current position through the Holocene thermal maximum.The implication is that despite a period of warmer-than-present temperatures in Greenland lasting some 2,000 years, the ice sheet did not shrink to such an extent as to result in a whole lot of sea level rise. This is good news as to what to expect from future warming—the Greenland ice sheet seems pretty stable in the face of rising temperatures.
This is consistent with the remarkable findings of Dorthe Dahl-Jensen’s research team concerning the warmest era in the last 1.5 million years or so—the first 6,000 years of the last interglacial period, known as the Eemian. It began 128,000 years ago.
The ratio of two different isotopes of oxygen (18O/16O) in air trapped in ice provides an accurate measure of local temperature, and because snow compacts every year, it’s fairly straightforward to count backward, year-by-year, as one drills down through the Greenland icecap. Up until Dahl-Jensen’s report, no one had gotten completely through the Eemian. And, up until then, it was thought that temperatures in those 6,000 years were some 2°–4°C warmer than in the current era.
(Greenland’s temperatures were pretty flat during the 20th century.) Dahl-Jensen’s work shows that Greenland was an astounding 8° +/– 4° warmer! Over that 6,000 years, Greenland lost approximately a quarter of its ice, contributing to 2 meters of sea-level rise.
Young and Briner, along with Dahl-Jensen, provide strong evidence that Greenland’s ice will be disturbed very little by what humans are likely to do to the atmosphere. Let’s use the top-end of Young and Briner’s warming by 2100 (3°C) and jack it up to 5° for the next hundred years. Then, let’s make the plausible assumption that we haven’t a clue about society’s energy structure 200 years from now, so we’ll stop things there and let the warming damp back to 20th century levels in 500 years. The integrated heat applied to Greenland (we’ll provide gory details on request) works out to 1,500 degree-years. What Young and Briner found was that the Holocene maximum provided, on average, 4,000 degree-years (2,000 years multiplied by 2°), over twice what humans can contribute. And Dahl-Jensen showed it took a whopping 36,000 degree-years to melt only a quarter of the ice there, 24 times what we can do. In other words, we can’t change the climate enough to ever cause a massive sea level rise from melting Greenland’s ice.
Young and Briner also find that the models tend to overdo the mid-Holocene ice sheet retreat. Examining a leading ice sheet model (described by Lecavalier and colleagues), Young and Briner conclude:
The modeled minimum ice sheet in Lecavalier et al. (2014) at 4 [thousand years ago] equates to a 0.16 [meter] sea-level contribution, but considering minimal inland retreat of the ice margin based on geological reconstructions, we suggest that this value may be a maximum estimate of the [Greenland ice sheet] contribution to sea level in the middle Holocene.Lecavalier’s estimate of 0.16 meters equates to 6.3 inches—which Young and Briner think should represent the worst-case result of 2,000 years of projected end-of-the-century temperatures across Greenland. This also comports well with the estimates from the United Nations Intergovernmental Panel on Climate Change (IPCC), which, in its Fifth Assessment Report, projected the sea level rise from Greenland as being between 0.07 and 0.21 meters (2.8 to 8.3 inches) with a median value of 0.12 meters (4.7 inches) even under its highest greenhouse gas emission scenario.
Like we said, our view that future sea level rise will be modest is now firmly established by the scientific literature, contrary to nonscientific alarmist claims."
From 2007 to 2012-13, The Income Share of Top 1% Fell
From David Henderson of EconLog.
"The share of income (including capital gains) held by the top 1 percent grew from 10 percent in both 1960 and 1980 to 21.5 percent in 2000. Since then, it fell to under 17 percent in 2002 before rising to 23.5 percent in 2007. With the onset of the Great Recession, the wealthiest people actually had their incomes decline by the greatest amount as the share of the top 1 percent fell to 18 percent in 2009 before rising to 21.4 for the 2012 and 2013 on average. (These two years have to be combined because changes in tax rates for the very rich led to many people moving income and capital gains to 2012 -- which resulted in much lower incomes in 2013). The movements of the top .01 percent followed a similar trajectory.Mr. Saez, in a September 2013 paper titled "Striking It Richer," created a splash when he reported that 95 percent of the gains of the growth between 2009 and 2012 were captured by the richest 1 percent. Other analysts have done similar calculations. Together, they have created the impression that the rich were increasing their share of the economic pie at an alarming rate.But these "shares of growth" can be misleading over short time spans. The top 1 percent share's rose from 2009 to 2012, but only after it declined more from 2007 to 2009. The finding that inequality has exploded recently is based on the bounce-back from the unusually low level of capital gains in 2009. If we look at the whole period from 2007 to 2012-13, the share of the top 1 percent decreased as the income loss for the top 1 percent was higher than for other groups.[italics added]This is from Stephen J. Rose, "Measuring Inequality Trends During the Great Recession," New York Times, February 17, 2015.
Rose is a research professor at the George Washington University Institute of Public Policy.
Of course, these data don't track the same people over time. There is much movement in and out of income categories. That's a big caveat. Still, the data are interesting given how much we've heard about the top 1% getting almost all the gains."
Thursday, February 19, 2015
Was The The Great Depression was a Calamity of Unfettered Capitalism?
By LAWRENCE W. REED of FEE.
"To properly understand the events of the time, it is appropriate to view the Great Depression as not one, but four consecutive depressions rolled into one. The late economist Hans F. Sennholz labeled these four “phases” as follows: the business cycle; the disintegration of the world economy; the New Deal; and the Wagner Act. The first phase explains why the crash of 1929 happened in the first place; the other three show how government intervention kept the economy in a stupor for over a decade.
The Great Depression was not the country’s first depression, though it proved to be the longest. The common thread woven through the several earlier debacles was disastrous manipulation of the money supply by government. For various reasons, government policies were adopted that ballooned the quantity of money and credit. A boom resulted, followed later by a painful day of reckoning. None of America’s depressions prior to 1929, however, lasted more than four years and most of them were over in two. The Great Depression lasted for a dozen years because the government compounded its monetary errors with a series of harmful interventions.
Most monetary economists, particularly those of the “Austrian school,” have observed the close relationship between money supply and economic activity. When government inflates the money and credit supply, interest rates at first fall. Businesses invest this “easy money” in new production projects and a boom takes place in capital goods. As the boom matures, business costs rise, interest rates readjust upward, and profits are squeezed. The easy-money effects thus wear off and the monetary authorities, fearing price inflation, slow the growth of or even contract the money supply. In either case, the manipulation is enough to knock out the shaky supports from underneath the economic house of cards.
One of the most thorough and meticulously documented accounts of the Fed’s inflationary actions prior to 1929 is America’s Great Depression by the late Murray Rothbard. Using a broad measure that includes currency, demand and time deposits, and other ingredients, Rothbard estimated that the Federal Reserve expanded the money supply by more than 60 percent from mid-1921 to mid-1929. The flood of easy money drove interest rates down, pushed the stock market to dizzy heights, and gave birth to the “Roaring Twenties.” Some economists miss this because they look at measures of the “price level,” which didn’t change much. But easy money distorts relative prices, which in turn fosters unsustainable conditions in certain sectors.
By early 1929, the Federal Reserve was taking the punch away from the party. It choked off the money supply, raised interest rates, and for the next three years presided over a money supply that shrank by 30 percent. This deflation following the inflation wrenched the economy from tremendous boom to colossal bust.
The “smart” money—the Bernard Baruchs and the Joseph Kennedys who watched things like money supply—saw that the party was coming to an end before most other Americans did. Baruch actually began selling stocks and buying bonds and gold as early as 1928; Kennedy did likewise, commenting, “only a fool holds out for the top dollar.”
When the masses of investors eventually sensed the change in Fed policy, the stampede was underway. The stock market, after nearly two months of moderate decline, plunged on “Black Thursday”—October 24, 1929—as the pessimistic view of large and knowledgeable investors spread.
The stock market crash was only a symptom—not the cause—of the Great Depression: the market rose and fell in near synchronization with what the Fed was doing. If this crash had been like previous ones, the subsequent hard times might have ended in a year or two. But unprecedented political bungling instead prolonged the misery for twelve long years.
Unemployment in 1930 averaged a mildly recessionary 8.9 percent, up from 3.2 percent in 1929. It shot up rapidly until peaking out at more than 25 percent in 1933. Until March 1933, these were the years of President Herbert Hoover—the man that anti-capitalists depict as a champion of noninterventionist, laissez-faire economics.
Did Hoover really subscribe to a “hands off the economy,” free-market philosophy? His opponent in the 1932 election, Franklin Roosevelt, didn’t think so. During the campaign, Roosevelt blasted Hoover for spending and taxing too much, boosting the national debt, choking off trade, and putting millions of people on the dole. He accused the president of “reckless and extravagant” spending, of thinking “that we ought to center control of everything in Washington as rapidly as possible,” and of presiding over “the greatest spending administration in peacetime in all of history.” Roosevelt’s running mate, John Nance Garner, charged that Hoover was “leading the country down the path of socialism.” Contrary to the modern myth about Hoover, Roosevelt and Garner were absolutely right.
The crowning folly of the Hoover administration was the Smoot-Hawley Tariff, passed in June 1930. It came on top of the Fordney-McCumber Tariff of 1922, which had already put American agriculture in a tailspin during the preceding decade. The most protectionist legislation in U.S. history, Smoot-Hawley virtually closed the borders to foreign goods and ignited a vicious international trade war.
Officials in the administration and in Congress believed that raising trade barriers would force Americans to buy more goods made at home, which would solve the nagging unemployment problem. They ignored an important principle of international commerce: trade is ultimately a two-way street; if foreigners cannot sell their goods here, then they cannot earn the dollars they need to buy here.
Foreign companies and their workers were flattened by Smoot-Hawley’s steep tariff rates, and foreign governments soon retaliated with trade barriers of their own. With their ability to sell in the American market severely hampered, they curtailed their purchases of American goods. American agriculture was particularly hard hit. With a stroke of the presidential pen, farmers in this country lost nearly a third of their markets. Farm prices plummeted and tens of thousands of farmers went bankrupt. With the collapse of agriculture, rural banks failed in record numbers, dragging down hundreds of thousands of their customers.
Hoover dramatically increased government spending for subsidy and relief schemes. In the space of one year alone, from 1930 to 1931, the federal government’s share of GNP increased by about one-third.
Hoover’s agricultural bureaucracy doled out hundreds of millions of dollars to wheat and cotton farmers even as the new tariffs wiped out their markets. His Reconstruction Finance Corporation ladled out billions more in business subsidies. Commenting decades later on Hoover’s administration, Rexford Guy Tugwell, one of the architects of Franklin Roosevelt’s policies of the 1930s, explained, “We didn’t admit it at the time, but practically the whole New Deal was extrapolated from programs that Hoover started.”
To compound the folly of high tariffs and huge subsidies, Congress then passed and Hoover signed the Revenue Act of 1932. It doubled the income tax for most Americans; the top bracket more than doubled, going from 24 percent to 63 percent. Exemptions were lowered; the earned income credit was abolished; corporate and estate taxes were raised; new gift, gasoline, and auto taxes were imposed; and postal rates were sharply hiked."
"Perhaps the most radical aspect of the New Deal was the National Industrial Recovery Act (NIRA), passed in June 1933, which set up the National Recovery Administration (NRA). Under the NIRA, most manufacturing industries were suddenly forced into government-mandated cartels. Codes that regulated prices and terms of sale briefly transformed much of the American economy into a fascist-style arrangement, while the NRA was financed by new taxes on the very industries it controlled. Some economists have estimated that the NRA boosted the cost of doing business by an average of 40 percent—not something a depressed economy needed for recovery.
Like Hoover before him, Roosevelt signed into law steep income tax rate increases for the high brackets and introduced a 5 percent withholding tax on corporate dividends. In fact, tax hikes became a favorite policy of the president’s for the next ten years, culminating in a top income tax rate of 94 percent during the last year of World War II."
Electric car benefits? Just myths
By Bjørn Lomborg, in the USA Today.
"It is time to stop our green worship of the electric car. It costs us a fortune, cuts little CO2 and surprisingly kills almost twice the number of people compared with regular gasoline cars.
Electric cars' global-warming benefits are small. It is advertised as a zero-emissions car, but in reality it only shifts emissions to electricity production, with most coming from fossil fuels. As green venture capitalist Vinod Khosla likes to point out, "Electric cars are coal-powered cars."
The most popular electric car, a Nissan Leaf, over a 90,000-mile lifetime will emit 31 metric tons of CO2, based on emissions from its production, its electricity consumption at average U.S. fuel mix and its ultimate scrapping. A comparable diesel Mercedes CDI A160 over a similar lifetime will emit 3 tons more across its production, diesel consumption and ultimate scrapping.
The results are similar for the top-line Tesla car, emitting about 44 tons, about 5 tons less than a similar Audi A7 Quattro.
Subsidies vs. savings
Yes, in both cases the electric car is better, but only by a tiny bit. Avoiding 3 tons of CO2 would cost less than $27 on Europe's emissions trading market. The annual benefit is about the cost of a cup of coffee. Yet U.S. taxpayers spend up to $7,500 in tax breaks for less than $27 of climate benefits.
That's a bad deal.
The other main benefit from electric cars was supposed to be lower air pollution. Yes, it might be powered by coal, but unlike the regular car, coal emissions are far away from the city centers where more people live and where damage from air pollution hits hardest.
However, new research in Proceedings of the National Academy of Sciences found that while gasoline cars pollute closer to home, coal-fired power pollutes a lot more.
The researchers estimate that if the U.S. has 10% more gasoline cars in 2020, 870 more people will die each year in the U.S. from air pollution. Hybrids, because they are cleaner, will kill just 610 people. But 10% more electric vehicles powered on the average U.S. electricity mix will kill 1,617 more people every year, mostly from coal pollution. The electric car kills almost three times as many as a hybrid.
Of course, electric car proponents would venture that the perceived rapid ramp-up of renewables will make future electric cars much cleaner. This, however, is mostly wishful thinking. Today, the U.S. gets 14% of its electric power from renewables. In 25 years, Obama's Energy Information Administration estimates this will have gone up just 3 percentage points to 17%.
Similarly, fossil fuels generate 65% of U.S. electricity today, and will generate 64% in 2040, although natural gas will gain four percentage points and lead to slightly cleaner power.
Instead of focusing on electric cars, we should focus on making coal-fired power cleaner.
What proponents say
Proponents could also argue that the more mileage an electric car logs, the more its carbon footprint is reduced because the battery production is a significant part of their total emissions.
Yet, it hardly matters. The added mileage saves little in the way of emissions, and the electric car's extended use might mean it would have to replace its batteries, entirely blowing the climate benefit.
Moreover, because the Nissan gives you only 84 miles on a charge, most people buy it as a second car for shorter trips. If such a second car goes only 50,000 miles, it will actually end up emitting more CO2.
In the public conversation, electric cars are seen as the new uber-green. But they're nothing of the sort. If we had 25 million extra electric cars rather than gasoline cars on the road in 2020, they would over their lifetime avoid 75 million tons of CO2 at a market value of more than half a billion dollars.
However, at present-day subsidies, they would cost a phenomenal $188 billion while creating more pollution than gasoline cars, costing about $35 billion in lives cut short by poor air quality. For every dollar of cost, the electric car does less than half a cent of good.
For the next decades, hybrids are the way to go, while we innovate cheaper green energy that hopefully over some decades will make the electric car worthwhile.
Bjørn Lomborg, author ofThe Skeptical EnvironmentalistandCool It, is president of the Copenhagen Consensus Center."
Wednesday, February 18, 2015
A Few More Arguments Against Obamacare
By Megan McArdle.
"Austin Frakt of the Incidental Economist writes (and tweets!) to ask if I have ever written anything on the externality argument for the Affordable Care Act's individual mandate. Good question, and the answer is that I don't think I have, though the archives from my first six years of blogging are shot, and the rest are now scattered across three different sites that don't always turn up on Google searches.
But there's nothing stopping me from doing so now, and hey, here I am, doing it.
For those who might not know the term, "externality" is economist-speak, and it means about what it sounds like: an effect that your action has on others. An externality can be positive or negative, and obviously, we as a society would like to have as many as possible of the former and as few as possible of the latter. In other words, "Your right to swing your fist stops at the end of my nose."
I'm a libertarian, and libertarians love talking about externalities. They give us a (relatively) clear way to define what are and are not legitimate scopes of public action. Whatever you're doing in the privacy of your own bedroom with another consenting adult is really none of my business, even if I think you oughtn't to be doing it. On the other hand, if you're breeding rats and cockroaches in there, and they're coming through the shared wall of our respective row houses, then I have the right to get the law involved.
Framing things as "externalities" is therefore a good way to get a libertarian, or someone who leans that way, on your side. And such frames have come up over and over in the debate over Obamacare, which has been variously justified by the cost to the state of emergency room care; the cost to society of free-riding young folks who don't buy insurance until they get sick; the public health cost of people who don't go to the doctor and get really, expensively sick; an unhealthy workforce that is less productive; and the cost to friends and relatives who have to chip in to cover uninsured medical expenses.
I didn't find any of those arguments particularly convincing. The third can just be dispensed with on the grounds of accuracy: In general, preventive medicine does not save money. Oh, it may save money in the particular case of someone whose diabetes or cancer went long undiagnosed. The problem is, you can't just look at the cost of sick folks who would have been a lot cheaper to treat if their conditions had been caught earlier. You also have to include the cost of all the healthy people you had to screen in order to catch that one case of disease. And with limited exceptions, the cost of screening the healthy generally outweighs the cost of treating the chronically ill. Now, you can certainly argue for preventive care on other grounds -- for example, that it makes people healthier (though even then you have to add the cost of unnecessary medical procedures, such as biopsies following a false positive on a blood test, which is why we do not, say, give annual mammograms to every American woman). But it's not generally a money saver, so this particular externality doesn't exist.
The rest of the arguments have some weight, but in the end, I don't think they're weighty enough. Let me explain.
On closer examination, arguments about externalities turn out to be not quite as neat as libertarians, or economists, would like. If you frame it right, almost anything can be an externality, which is useful as a way to tack a thin veneer of economic rationalism onto your political argument but useless as a way to make policy in a pluralistic society. What if knowing that you and your partner are doing naughty things a few feet from my bed causes me severe mental anguish? That's surely an externality, so why don't we take notice of it?
The answer is that we don't simply say "OMG, negative externality! Quick, government, kill it with fire!" Because in that way lies madness. As it's easy to see, reducing this negative externality itself has a negative externality, which falls on the folks who enjoy doing naughty things a few feet from your head.
So too with the individual mandate. Make people buy insurance because their lack of insurance has negative externalities. But getting cheaper insurance for some now has negative externalities on folks who have to buy pricey insurance that costs them far more than the benefit they get out of it. It's like sitting between two mirrors: negative externalities stretching away to infinity on both sides.
How do we decide? Not in any very clean way, of course, this being a society filled with imperfectly rational humans rather than a blackboard in an economics class. But society has generally settled on some rough intuitive rules, which I'll try to make explicit:
1. We don't force people to do things in order to produce positive externalities. My neighbors probably got some modest enhancement in their property values when we replaced our horrid old falling-apart chain-link fence with nice new wrought iron. It's possible that society would be better off if everyone had to replace their fences with wrought iron. But we cannot mandate everything that produces a positive externality. My neighbors would also be better off if I made personal war with the rats on the alley, paid for Yo-Yo Ma to do a solo performance in my front yard, and made breakfast in bed for everyone on the block. It's possible that the benefit to the neighbors is greater than the cost to me, but the government still won't force me to do it.
In general, we are much quicker to pass laws to stop people from doing things that have negative impacts on others than we are to make them do things that confer benefits upon others. Obviously, there is some wiggle room in how we frame the problem -- is forcing a landlord to fix a dangerously dilapidated cornice stopping the negative externality of an injury or creating the positive externality of public safety? And obviously, we don't always abide by this rule ... hello, Selective Service. But we usually abide by this rule, and it's a good thing, too. It's what keeps us from turning ourselves into a slave state.
2. Basic rights can't be violated because they upset someone else. There's a lot of speech out there that causes far more harm than it generates in open public discourse. You still have the right to say it. Promiscuous sexual activity spreads diseases, some of which are very hard to treat. The public health police still can't stop you from getting your groove on. The most exquisite cost-benefit analysis showing that slavery was a net positive in terms of economic activity and utility still wouldn't change the fact that it is evil and wrong. You may append your own list of basic human rights where talking about externalities simply isn't very relevant.
3. You can't have created the situation that you are now trying to fix. Say I have a farm in the middle of nowhere. You come out and build a bunch of new McMansions with granite countertops and recessed lighting and all the modern conveniences. Suddenly, the pungent smell of cow manure is a negative externality for all the folks in the development, who complain to their local government. Most of us would not say that you have the right to force me to stop farming because it's ruining the ambience of the development that you decided to build.
So now let's talk about the individual mandate, which fails on at least two of three points. Start with No. 3: Many of the complaints about externalities rely on a massive amount of public spending on health care or laws such as the Emergency Medical Treatment & Labor Act (which forces emergency rooms to treat people even if they can't pay). It's extremely dangerous to allow the government to say, "Well, we passed this law, and as a result you're costing people a bunch of money, so we're now entitled to pass this other law to dictate your behavior." It's far too easy to build a pyramid of laws that entitle the government to do anything at all, because earlier laws have made your various liberties rather costly.
It also fails on No. 1: We are not trying to stop people from doing something that harms others so much as to force them to do something that would make others better off by enabling them to buy cheaper health insurance. (It's irrelevant to this point whether you think I would also be better off, because Professor Frakt asked specifically about externalities.) I am in general extremely skeptical of those sorts of arguments for anything short of World War II.
I also think it fails on No. 2, by the way; I think people have a right to determine where their own money goes and what products they spend it on -- even if that means they can choose to forgo a very beneficial product that would make everyone better off. Now, I do not think this right is entirely unlimited -- parents can be forced to support their children, for example, and I think that's entirely just. Even free speech can be curtailed in very extreme situations; it does not cover libel, or the proverbial nuthatch who falsely cries "fire" in a crowded theater. But there are very good reasons for requiring extraordinary circumstances to invoke such restrictions, and I do not think that Obamacare meets that bar. I am well aware that Obamacare's supporters will disagree, and I doubt that either of us will convince the other, so I'll leave it at that.
This is not a tedious rehash of my reasons for opposing Obamacare, though two years in, perhaps such a rehash is due. If it is, I will provide it in a different post. This is just a post on why I don't think that the argument for Obamacare can rest very securely on the argument that we are simply cleaning up some ugly negative externalities, in much the same way that we do with noise ordinance and anti-pollution laws. That is not what we are doing, and if it were, we wouldn't be doing it.
- If you are even now planning your tweet or Facebook post stating that "Megan McArdle thinks the Obamacare mandate means we are living in a slave state," you should go back to your middle school teachers and roundly castigate them for their failures in your reading comprehension instruction.
- No, I am not arguing this, because it is not true, and also, it is evil. I am offering an extreme example of something we would not sanction even if the repulsive Southern apologists had been correct that everyone -- even the slaves! -- were happier, healthier and richer under slavery."
How Not to Spin a Big Drop in Top 1% Incomes
By Alan Reynolds of Cato.
"
When Thomas Piketty and Emmanuel Saez release their annual estimates of top 1 percent incomes, you can count on The New York Times to put it in a front page headline with additional hype on the editorial page. This time, however, the news was that the top 1 percent had suffered a 14.9 percent decline in real income in 2013 if capital gains are included, as they always had been until now.
The New York Times heroic spin was “The Gains From the Economic Recovery Are Still Limited to the Top One Percent.” The author, Justin Wolfers of the Peterson Institute wrote, “Emmanuel Saez … has just released preliminary estimates for 2013. The share of total income (excluding capital gains) going to the top 1 percent remains above one sixth, at 17.5 percent. By this measure, the concentration of income among the richest Americans remains at levels last seen nearly a century ago.”
I will have more to say about this in another blog post. For now, I just want to call attention to the artistic way in which the subject was changed. Since 2008, Saez has been comparing changes in top incomes (for which he has preliminary IRS data) to incomes of the bottom 90 percent (for which IRS data are singularly inappropriate). He always included realized capital gains because that makes the top 1 percent share both larger and more cyclical.
Those share-of-gains calculations were the source of the politically popular canard that the top 1 percent had “captured” 91 percent of the gains in total income since 2009 which, as Scott Winship noted, drops to 30 percent if we include 2013. Saez now prefers to say the top 1 percent captured 106 percent of the 2013 decline, leaving the previous 91 percent absurdity intact.
President Obama raised tax rates on top income and capital gains in 2013, and the immediate result was big drop in the amount of such income reported by the top 1 percent – just as I and others had predicted. Saez asks us to take mercy by averaging 2012 and 2013, which comes out to $1,217,002. That is down quite a lot from $1,533,064 in 2007, but we aren’t supposed to mention cyclical downturns, only the upturns.
Wolfers asks us to be even more merciful and leave out capital gains this time. That doesn’t help much, but it allows him to fog recent events by talking about “nearly a century ago.” This echoes the familiar comparison that Senator Ted Cruz and Pew Research made between 1928-29 the now disavowed top 1 percent share in 2012.
But the Piketty and Saez estimates for 1928 or 1929, and all other years up to 1944, calculate shares by comparing top incomes with personal income from the GDP data. They define total income as personal income less 20 percent until 1944, and then switch to a modified version of Adjusted Gross Income after that (missing 40 percent of personal income in the process). They also subtract Social Security and unemployment benefits from the denominator of the top 1 percent ratio, which has zero effect in 1929 but greatly exaggerated top income shares in recent years.
The blue line in the graph shows the same data in Wolfers’ graph. The red line shows what the data would look like if top income shares today were defined the same way they were in 1929. Note the huge increase at the time of the 1986 Tax Reform, when the top 1 percent share of income reported on individual tax returns (rather than being unreported or reported on corporate tax returns) shot up from 7.6 percent to 11.4 percent. These pre-tax pre-transfer data tell us much more about changing tax rates, than they do about income distribution.
When measured a comparable basis, the top 1 percent earned 18.4 percent of income in 1929 and 13.3 percent in 2013. Using the same measure of total income shows the comparison between top income shares in 2013 and 1929 is false."

Subscribe to:
Posts (Atom)