"This graph has been on my mind a lot. It comes from work done by one of my colleagues, John Friedman, and his coauthors at Opportunity Insights. John and his collaborators are, in my view, doing among the most important social science work active today. This is no exception.
Before I tell you what I think this means, and why it’s so important, it’s useful to talk through what, exactly, is in this graph.
The team at Opportunity Insights is looking to evaluate the impact of the COVID-19 pandemic on the economy. This includes impacts on things like stores and restaurants, but also impacts on parts of the economy like education. Their key contribution in most of these areas is creative use of data to see what has gone on in the wake of the disease.
When they turned to look at educational progress, they relied on data from Zearn. If you are a regular reader of this newsletter, you may recall I suggested this as a homeschool resource and, indeed, my kids have been using and liking it. But Zearn is also used in many school districts; it’s linked up to the Eureka math curriculum.
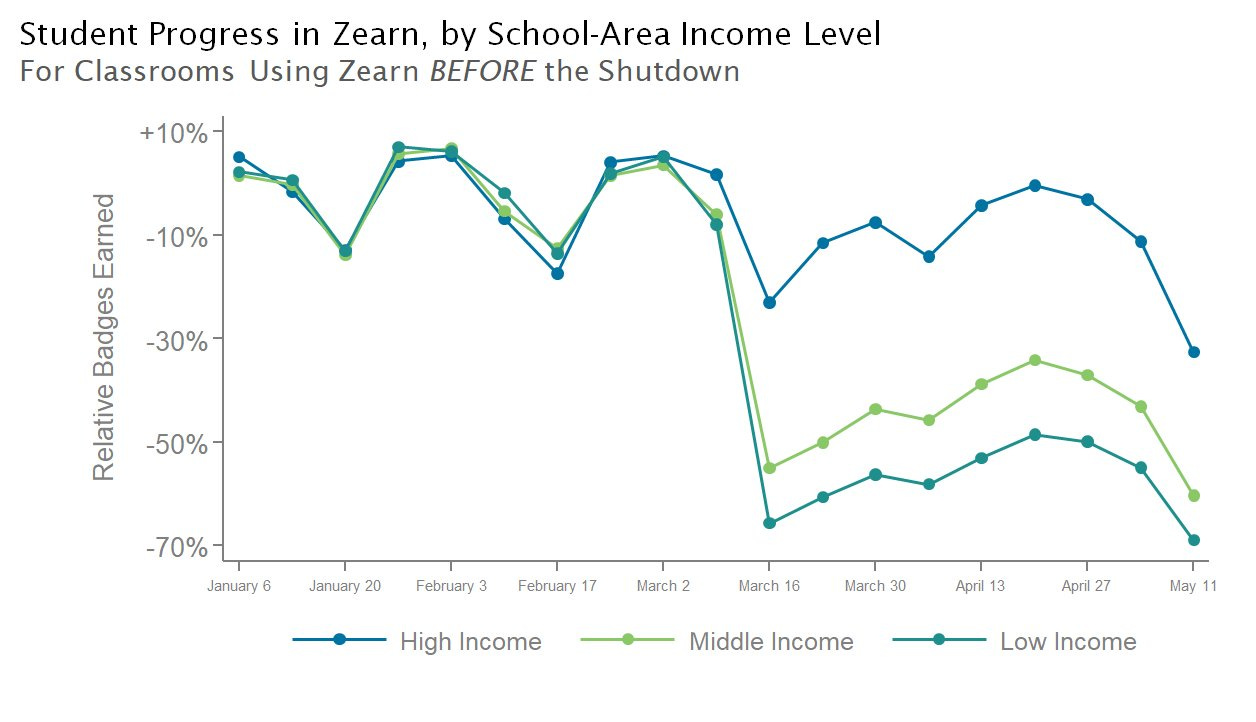
What the Opportunity Insights team did is take data from classrooms that were using Zearn before the shutdown for math instruction. They relied on data about “Badges” earned — basically, a metric of completion of lessons in the program — and looked at how the number of badges earned changed over time after schools shut down.
This is what they are showing in the graph above. The vertical axis is the percent change. A 50% reduction (that’s -50% on the axis) means half as many badges earned relative to the baseline, pre-pandemic period. Importantly: the graph separates out schools in higher income areas (the top line) from those in middle and lower income areas (the bottom two lines). Each group represents about a third of schools. (These are based on area-level income, not individual student income, although higher income areas have, on average, higher income students).
What might we hope to see here? If online learning was basically just as productive as in-school learning, we wouldn’t expect to see a reduction in badges earned. The line would just be flat around zero.
This does not seem to be the case at all. Even for students in the best off districts — the higher income ones — there is a reduction of about 10% in the badges earned and this seems to get even worse in the most recent weeks. For students in middle and lower income school districts, the results are a disaster. There appears to be about a 60% drop in badges earned. That is, kids in these districts are moving through the curriculum at less than half the pace they did while in school.
For a week or two, that might be a surmountable slowdown. But this is consistent over the entire period. It’s a third of the school year. If kids learn half as much math for that third of a year, they will be months behind when the next grade rolls around.
This is only one piece of data. Perhaps you are thinking that in moving to distance learning school districts stopped using Zearn and switched to some other math option. In this case, these data might overstate the losses. This is of course, possible. To me, it seems unlikely. Math instruction which is already online seems among the easiest things to transition. If anything, I would think that these numbers understate learning loss, since many other classroom lessons — social studies, for example — may be more difficult to do well remotely.
Why is this on my mind? In a sense, it brings together for me the two crises we are facing right now.
There is a lot of talk of reopening schools in the fall — should we do it, is it dangerous, how should it happen. There are no easy answers. I have been accused, I think correctly, of being more gung-ho to open than many in public health.
What we all should acknowledge is that opening schools is not without very significant risks. We do not yet understand well how school opening will impact the virus. I hope we will know more as schools in Europe continue to open, and as camps and day cares do in the US. But there is no question we will go into the fall without certainty, and also no question that when we do open some people will get sick.
But what these graphs show me is that keeping schools closed is also not without very significant risks. The current cohort of kids has already experienced learning loss. Now imagine you keep schools closed for another year. That is a full year in which some schools see students learning less than half the math they should learn. There is every reason to believe, based on what we know from other data, that these kids will be less likely to complete high school, go to college, get good jobs and earn a living wage. They will be more likely to die sooner.
And it’s not all kids. Or, at least the burden is disproportionate. Richer kids in richer school districts will do better. Even if their schools are doing a bad job on distance learning, their parents are more likely to fill in. My kid’s school isn’t pushing them through Zearn fast enough? No problem, I’ll sign them up on my own. The already very stark educational inequality will get starker.
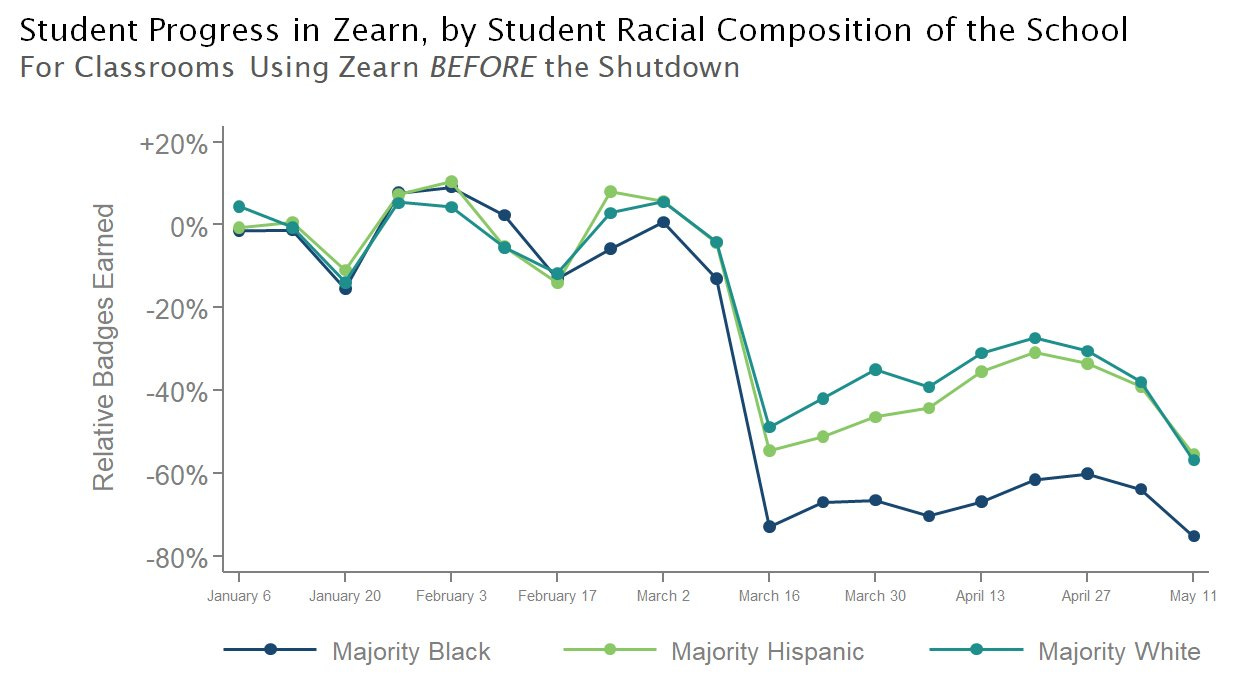
This is where this intersects, also, with race. The graph below has the same structure as the one above, but now separates schools by the racial composition rather than income. Schools in which the majority of students are Black or Hispanic have more learning loss than those who are majority white. The difference for majority Black schools is very large.
Race and income do not always go hand-in-hand. And one of the many important points that have been made recently is the point that racism is just that — discrimination based on race. Black men and women are treated differently because of skin color, be it by police or by others. Being a chaired Harvard professor does not change this.
But it is nevertheless true that Black children are more likely than white children to grow up in lower income families and neighborhoods. When we see inequality in education by income levels, by school resources, these inequalities translate to racial inequalities.
So when we ask: “Which are those children who are going to be left behind if we do not open schools?”, the answer will come back that they are disproportionately not just low income but also Black and Hispanic.
The conversation doesn’t stop there. COVID-19 rates are also higher for people of color. The burden of closed schools is higher, and so is the disease burden. How do we trade this off? There are no easy answers.
What these Opportunity Insights graphs tell me is that we have to find a way to improve learning outcomes and, realistically, I think this means we have to find a way to open schools. And yet we need to do it safely. I do not want to be a broken record, but it is a travesty that we are not collecting more data to understand how child care is spreading the virus. We must do this. It is simply not fair to children not to."
Monday, June 15, 2020
“Which are those children who are going to be left behind if we do not open schools?”, the answer will come back that they are disproportionately not just low income but also Black and Hispanic
See COVID-19, Learning Loss and Inequality by Emily Oster.
Subscribe to:
Post Comments (Atom)
No comments:
Post a Comment
Note: Only a member of this blog may post a comment.