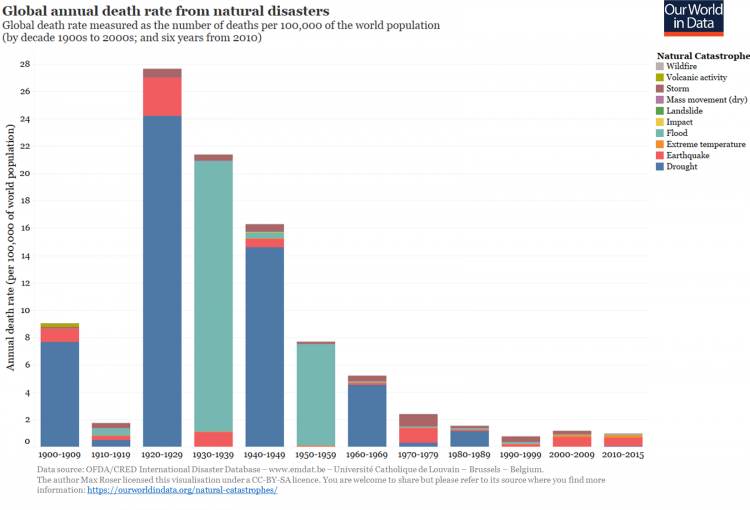
"In the following two charts we explore global fatalities from natural catastrophes since 1900. In the first chart we report the total annual number of deaths from natural catastrophes, as the decadal average from 1900. In the second chart, we report the same data but as the annual rate of global deaths (measured per 100,000 of the world population). The data for both charts can be found in the tables presented here.
Annual global number of deaths from natural catastrophes per decade, 1900-20151
Annual global death rate (per 100,000) per decade from natural catastrophes, 1900-20152
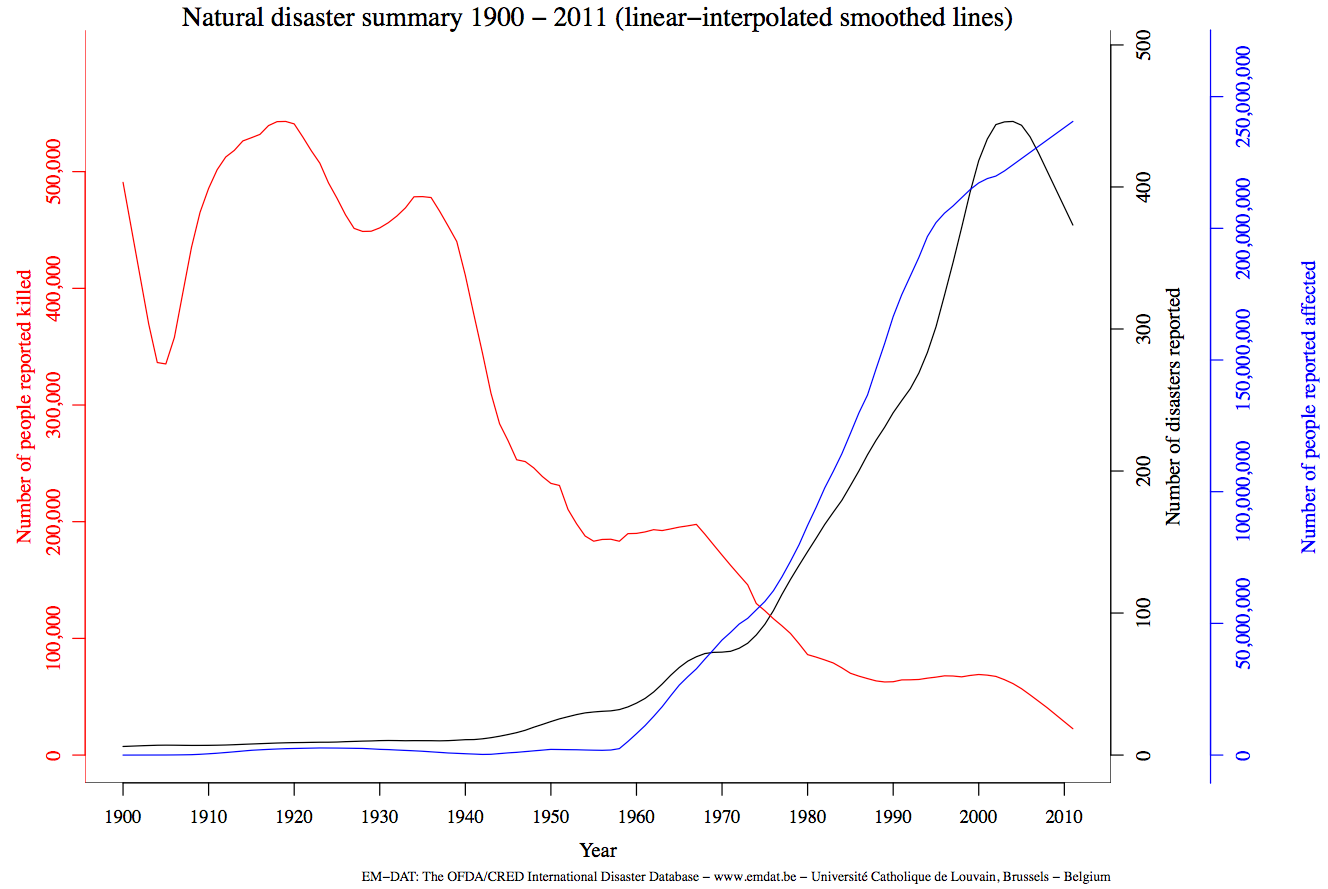
The following time-series plot gives a global overview over the number of reported deaths, the reported monetary damage and the reported number of events. It shows that, as one would expect, more events were reported and the monetary damage in an ever richer world increased, but the number of reported deaths was greatly reduced – as seen in the previous graph.
Number of reported disasters and number of people reported as affected and reported as killed, 1900-2011 – EM-DAT3
"
Wednesday, June 28, 2017
Climate related deaths have been falling
See Natural Catastrophes by Max Roser of Our World in Data. Excerpt:

Subscribe to:
Post Comments (Atom)
No comments:
Post a Comment
Note: Only a member of this blog may post a comment.