Evaluating the free market by comparing it to the alternatives (We don't need more regulations, We don't need more price controls, No Socialism in the courtroom, Hey, White House, leave us all alone)
What about spending for public schools? Has that been reduced in this allegedly draconian neoliberal era?
In
1960, per pupil expenditure for elementary and high school students was
just under $4000. In 1980, when the neoliberal ideology allegedly began
its ascendance, it was a little less than $8000. The latest numbers
from 2015–2016 are just under $15,000. All numbers are corrected for inflation
(in 2017–2018 dollars). So under this time of alleged cutbacks and
resource starvation, per pupil expenditures rose dramatically.
What about transportation infrastructure?
Total spending is up in real terms. What about as a percentage of GDP?
There has been a decline since 1962 as a percentage of GDP but the
numbers are basically flat since 1980…
What about investment in non-defense research and development, and health? Up dramatically since 1980 in real terms.
There is much more at the link, including excellent visuals."
"The House Ways and Means Committee held hearings on infrastructure yesterday. The testimony by D. J. Gribbin was excellent. He was special assistant to President Trump for infrastructure policy and is very experienced in the field.
Many of Gribbin’s themes support points I’ve made
for years regarding infrastructure and federalism. Gribbin and I don’t
come to the same policy conclusions, but his observations about current
policy failings are spot on.
Here are eight lessons for infrastructure policy:
1. States Own Most Infrastructure. Gribbin notes, “the federal government owns less than 7 percent of the nation’s public, non-defense
infrastructure.” The disconnect between federal funding and this state
ownership leads to “inefficiencies.” That is for sure, I’ve discussed here and here.
2. Federal Funds Come from the States. Gribbin says, “The federal government does not have the ability to create funds, just reallocate them,” making the point that federal aid ultimately comes from taxpayers who live in the 50 states. To me
that simple reality creates a high bar for federal action—why not let
the states keep their own money and fund their own highways and transit?
3. Costly Federal Regulations Are Tied with Aid. Gribbin argues, “Expenditure of federal highway funds triggers the need for compliance with an exhaustive list of federal requirements. These requirements not only impose direct additional costs on projects, but can also cause delays, which in turn lead to further costs.” I discuss some of these costs here.
4. Federal Aid Induces States to Delay Projects.
State and local governments delay high‐value projects for years
waiting for federal money when they should go ahead and get the projects
done. Gribbon calls this the “coupon effect” and points to a highway
example in Kentucky. I’ve discussed (#12)
this problem and pointed to delayed seaport, highway, and air traffic
control projects. In my view, if the Feds got completely out of the way,
infrastructure would be built faster and cheaper with fewer delays.
5. Federal Aid Crowds Out State Investment. Gribbon says that sometimes “state and local governments reduce their own, planned expenditures on infrastructure after having received federal grants.” He points to a Federal Reserve study finding crowd out of highway spending. A more serious problem I’ve noted (#17) is that federal aid crowds out the private provision of infrastructure such as airports, seaports, and transit.
6. U.S. Infrastructure Costs Are Suspiciously High. Gribbin is right that “U.S. infrastructure costs have become unacceptably, and inexplicably, high,” meaning the costs to build specific projects. He points to a study finding that “real per‑mile construction costs for the Interstate Highway System were three times higher in the 1990s than they were in the 1960s.”
And Gribbin hits the nail on the head saying that policymakers put
little effort into researching the root causes. Congress is all about
more spending, never cost reduction.
7. Federal Regulations. Federal rules inflate construction costs, as I discuss here (#9). Gribbin says that his “anecdotal conversations with state transportation departments suggest that accepting federal funding reduces purchasing power by 20 to 30 percent due to myriad regulations.” Gribbon discusses how other countries have much shorter environmental reviews for projects such as highways.
8. Governments Fail at Maintenance. Gribbin says, “Today, state and local leaders are incentivized to ignore maintenance … so they can spend those funds elsewhere. Yet, poor maintenance practices damage the long-term quality of infrastructure and result in a maintenance backlog that must be met by future taxpayers.”
Federal aid induces the states to buy expensive systems such as fancy
rail projects. The politicians get the photo ops at groundbreaking, but
then they ignore maintenance until a crisis hits, as we’ve seen with subway systems in Boston, New York, and D.C.
The solution to all these chronic problems is to end federal funding of infrastructure owned by the states, including highways, transit, airports, and seaports. In addition, the federal government should privatize
or devolve to the states many of the assets it owns, including Army
Corps facilities, the postal system, passenger rail, dams and water
projects, and many other items."
"The Community Reinvestment Act is supposed
to ensure that banks lend to low- and moderate-income households
wherever they operate. But there are reasons to doubt its effectiveness.
In the Washington Post
this summer, I reported findings (from a forthcoming paper with Andrew
Forrester) that more than two-thirds of recent home mortgages in the
District of Columbia for which banks can get CRA points went to high-
rather than low-income borrowers. This is because current CRA
regulations count loans to low-income borrowers and loans made
in low-income census tracts (Figure 1a). D.C. has rapidly gentrified in
recent years, as young professionals flocked into historically
low-income neighborhoods, and many among these “gentrifiers” have bought
homes. At present, CRA regulators take loans to gentrifiers into
account when they evaluate banks, even though gentrifiers are not
usually underserved borrowers.
Figure 1a: Loans to Low-Income Borrowers and in Low-Income Census Tracts Qualify for CRA Points
Note: LMI stands for low- and moderate-income, defined as a median
family income below 80 percent of the median for the metropolitan
statistical area. Yellow designates loans eligible for CRA credit
(points).
Gentrification, as a rule, is a good thing for both new arrivals and historic residents. A recent paper
from the Federal Reserve Bank of Philadelphia finds that gentrification
benefits the original residents of low-income neighborhoods. While
more-educated homeowners seem to gain most, even renters and the
less-educated are better off as a result of the improved living
conditions and increased opportunity that gentrification brings about.
The impact of gentrification on migration by less-educated renters,
arguably the most vulnerable group, to other neighborhoods is relatively
small: 4 to 6 percentage points.
The Philly Fed paper uses data from the 100 largest metropolitan
statistical areas (MSAs), which needless to say differ widely in their
local zoning laws, economic policies, history of segregation and
discrimination, and other traits important for our analysis. It may well
be that particular MSAs have worse outcomes from gentrification, for
example, because zoning restrictions make it difficult for housing
supply to respond to higher demand, causing displaced renters to face
greater cost pressures and longer commutes. That, however, is not a
direct consequence of gentrification but of local housing policy.
Regardless of one’s views on the desirability of rapid neighborhood
change, there is wide agreement that government policy should not promote
gentrification. High-income young professionals have the means to buy a
home. Besides, the excitement of moving to an up-and-coming
neighborhood and the lure of capital gains provide ample incentive for
many of them to do so.
Moreover, in specific instances, there may be displacement of poorer
(often minority) original residents, throwing into question the
desirability of government helping to accelerate an inevitable
development. For D.C., Andrew and I found that the minority share of a
census tract’s population had declined by three percentage points for
every additional percentage point of CRA-eligible lending between 2012
and 2017. That does not mean the CRA caused the displacement, nor does
it negate other benefits of gentrification. But it should help persuade
policymakers that counting gentrifier mortgages for CRA purposes is
unnecessary if not outright harmful (Figure 1b).
Figure 1b: Loans to High-Income “Gentrifiers” Currently Count for Banks’ CRA Evaluations
Note: Red designates loans to high-income borrowers in low-income areas.
That is why I have praised
Comptroller of the Currency Joseph Otting and Federal Deposit Insurance
Corporation Chairman Jelena McWilliams’ decision to no longer count
gentrifier loans in banks’ CRA evaluations. Their proposal, unveiled in December, says the following about gentrifier mortgagers:
Although the agencies remain committed to encouraging
banks to meet the credit needs in LMI areas, for banks evaluated under
the general performance standards, the proposal would not apply a
geographic distribution test to a bank’s consumer and home mortgage
product lines. Under the geographic distribution test in the
current CRA framework, banks receive positive consideration for home
mortgage and consumer loans made in LMI areas, even if they are made to
middle- or upper-income individuals or families. Unlike small
loans to businesses and small loans to farms in LMI areas that may
result in additional job creation or other positive effects for the
larger community, home mortgage and consumer loans to middle- or
upper-income individuals and families in LMI areas are generally not as
beneficial to LMI communities and may result in displacement.
Accordingly, this proposal would not apply the geographic distribution
test to these banks’ home mortgage and consumer product lines. The
result of this is that under the proposal, a mortgage loan to a
high-income individual living in a low-income census tract would no
longer qualify for CRA credit.
Otting and McWilliams are right. In the 1970s context of urban flight
and decline, encouraging mortgages to high earners in low-income
neighborhoods might have helped stem their migration to the
suburbs—although the impact can only have been marginal, and the
dramatic drop in house prices was the more meaningful spur for ambitious
buyers. But those circumstances no longer apply. Instead, many large
MSAs are changing rapidly, with a growing number of residents finding it
hard to afford to live in them.
Ahead of Wednesday’s House Financial Services Committee hearing
with Comptroller of the Currency Joseph Otting, Andrew and I have
expanded our analysis to the five most-populated MSAs in the country:
New York, Los Angeles, Chicago, Dallas, and Houston. We suspected our
finding for D.C., that a large share of CRA-eligible 1-to 4-family
(known as single-family) mortgages go to gentrifiers, would also apply
to these MSAs. But, because gentrification in D.C. has been more rapid,
and the original residents’ starting position arguably more precarious,
we also anticipated a weaker gentrifier bias for other MSAs.
Table 1 lays out our findings. Three patterns are worth highlighting.
The first is the substantial share of gentrifier mortgages in all
CRA-eligible mortgages for all five MSAs, despite significant variation
between them. The second is a steady increase in the share of gentrifier
mortgages in the five years from 2012 to 2017. The third pattern is the
large difference in gentrifier loans between New York and three of the
four other MSAs, with L.A. somewhere in the middle but converging with
New York more recently.
Table 1. Share of CRA-Eligible Single-Family Mortgages to High-Income Borrowers, by MSA and Year (%)
Source: Home Mortgage Disclosure Act database.
As we suspected, D.C. has an even greater share of gentrifier loans
than other MSAs. This may be due to idiosyncratic economic factors
related to the District’s profound, decades-long decline and its swift
rebirth since the mid-2000s. Alternatively, Andrew and I only looked at
mortgages in D.C. proper, rather than for the whole metropolitan area
(which includes Arlington and Alexandria), which may bias our results
since much recent gentrification has focused on the District – although
some parts of Arlington have also undergone great change during this
time period.
I can only speculate about the differences between New York and L.A.,
the Texas MSAs, and Chicago. Texas is known for its relatively flexible
zoning rules, which help call forth new supply in response to housing
demand, lowering prices and making homeownership more affordable to
low-income families. Chicago's experience may have more to do with the
city’s rising crime rate
and the state of Illinois' economic underperformance since the 2008
recession ended. New York and L.A., on the other hand, are high-cost
cities whose zoning codes appear to make housing needlessly
unaffordable.
Comptroller Otting and Chairman McWilliams' proposal to stop counting
high-income mortgages under a statute that aims at helping the
underserved will not, on its own, make housing more affordable in
America’s biggest cities. But it will focus CRA regulations on the
borrowers for whose sake it was enacted, while helping researchers
answer the most important policy question regarding this 42-year-old
law: does it in fact encourage banks to lend without increasing risk?"
"Europe has become a continent where families are often asked to pay
exorbitant amounts for basic needs, including energy. That has led to
what is known as “energy poverty.” Many are not able to afford household
power bills, especially in winter but also during summer heat waves.
The
number of Europeans affected by this problem is high. According to the
European Union in its 2015 report on rising energy costs, fully 11 per
cent of its member states’ population — that’s 54 million people —
already cannot afford their energy bills. The EU further estimates that
fully one-quarter of residents, or 128 million people (and that includes
the existing 54 million), are at risk of being energy poor.
Romania’s
energy poverty, for example, clocks in at between 40 and 50 per cent of
the population. Spain, Portugal, Estonia, Belgium, Malta, Slovakia,
Italy, Ireland and even the United Kingdom record energy-poverty rates
of between 20 and 30 per cent of their populations.
Such
energy-poverty rates have led to what the EU references as “excessive
mortality rates” in some of the same countries during winter, when some
consumers cannot afford to properly heat their homes. Seventeen of 26 EU
member states find the problem so prevalent that they even have energy
poverty defined as an explicit concept in law.
Energy poverty
The
EU blames energy poverty on three factors: the effect of recessions on
incomes (it references the 2008/09 recession though some EU states have
been in a recessionary “funk” long past that year); energy-inefficient
homes; and rising energy prices.
Of the three, one is less
amenable to further change: energy efficiency. That’s because European
homes, apartments and townhouses are already very energy efficient
vis-à-vis North American housing.
As for recessions and incomes,
higher energy prices prevent European economies from achieving higher
economic growth given that expensive energy restricts the money
available for business investment. That slows overall economic growth,
which exacerbates existing sluggish economies and lower incomes.
Oddly,
in its 2015 study, the EU ignored one major factor in energy poverty:
Its own role in killing off affordable power in attempts to meet
ambitious carbon dioxide reduction goals in the 1992 Kyoto Protocol.
Such objectives have been a staple of both EU and member-state policies’
ever since.
For a good example of how government policy led to
the creation of energy poverty and then subsequent policy attempts to
deal with the government-created problem, consider the U.K.
In the
U.K., energy poverty is defined as a household where more than 10 per
cent of income must be spent to heat the home to maintain an acceptable
temperature. One-quarter of British households fit that definition.
Pushing out coal
Who’s
to blame? In Britain, successive governments pushed out cheaper energy
sources such as coal. The country was the first to commit to phasing out
coal-fired electricity. Also, as of 2015, Secretary of State for Energy
and Climate Change Amber Rudd made it clear that push would continue
with plans to end all coal-fired power production by 2025.
Problem:
As of 2015, coal-fired electricity in the U.K. still accounted for 20
per cent of all power. Also, the 2025 plan is not realistic without
large costs. The Institution of Mechanical Engineers estimated that the
country lacks the time, resources and enough people with the right
skills to build enough replacement natural gas and nuclear plants by
2025. In any event, these touted replacements and the others, such as
wind and solar, are more expensive. So is imported power from the
continent. U.K. energy poverty is set to rise without a government
U-turn.
Canada has its own examples of how forced transitions from
cheaper energy sources to costly renewables sent power prices soaring —
Ontario, where power rates have doubled in the past decade, being the
most notable example. If Canadian governments adopt EU-style policies,
Canadians can expect an increase in home-grown energy poverty."
"Michael Brendan Dougherty writes about Daniel McCarthy’s piece over at Law & Liberty.
Dougherty seems to think the piece is full of truths about the failure
of free-market economic thinking, and I assume, therefore the legitimacy
of McCarthy’s call for government intervention in the form of
industrial policy. Dougherty calls McCarthy’s piece a “tour de force.” I
agree. It is a tour de force of unsubstantiated claims, unwarranted
conclusions, economic misunderstanding, and silly straw men.
It is also particularly amusing that Dougherty and McCarthy are so
eager to claim that those of us who believe in markets and free-trade
are ignorant of reality when that McCarthy’s piece contains so many
flaws from the reality side of things.
Below are a few examples of why I’m baffled by the praise of McCarthy’s essay.
1) McCarthy claims that free traders do not acknowledge that many
foreign governments, the Chinese one in particular, distort markets
with subsidies and industrial policies.
This claim is simply incorrect. In fact, it’s so bizarre that that
Don Boudreaux over at Café Hayek has offered to pay McCarthy $100 for
every verified example that he, McCarthy, finds of serious economists
displaying the kind of naïveté that McCarthy alleges is rampant among
pro-free-trade economists.
What’s amusing (or would be if it weren’t so depressing) to any
knowledgeable person about McCarthy’s claim is that economists’
centuries-long practice of defending unilateral free trade
springs from the explicit recognition that foreign governments often
distort their economies — and the global economy — with subsidies,
tariffs, and other interventions. The case for unilateral free trade is
that we benefit from lowering our trade barriers even in the face of other countries’ protectionism and industrial policies.
2) Behaving like the Chinese government isn’t self-defense, it’s shooting ourselves in the foot.
In a section called Self-Defense in Distorted Markets, McCarthy
writes, “Supporters of economic nationalism see U.S. tariffs against
China as justified retaliation, and some see them as a means of
achieving freer trade in the long run: by punishing trade violations
with reprisals, the United States can pressure China into abandoning its
bad behavior, which would then free the U.S. to re-liberalize its trade
relations.” There is a problem, however.
This is nothing more than wishful thinking, and you have to wear
rose-colored glasses to see any of the deals signed so far by the
president as anything more than face-saving agreements. This fact is no
surprise to those who study trade. But McCarthy’s timing for making this
argument is pretty bad. On Friday, the Trump administration admitted
that his steel and aluminum tariffs worked exactly as free traders said
they would — i.e., they increased the cost of the imported metals used
by American manufacturers, and hence increased the importation of goods
made with those metals (I wrote about this predictable effect of tariffs
months ago here).
Faced with this inescapable reality, Mr. Trump is doubling down with
new tariffs, this time of derivative products. These same policies will
yield the same results, but that doesn’t seem to deter those determined
to ignore the lessons of both economics and history.
We can lament the behavior of foreign governments that use tariffs
and subsidies because we recognize that these interventions are
counter-productive and distortive. But it’s crucial to understand that
the main victims of such interventions are not Americans but, instead,
consumers, taxpayers, and unprivileged producers in those countries.
Such interventions weaken those foreign economies relative to our own.
Similarly, it is well-established that the Trump tariffs aremostly shouldered by Americans, many of them manufacturers and exporters, and this new series of tariffs won’t get him any closer than the objective he wants.
For this reason (and for others) McCarthy is wrong to assume that the
appropriate response of our government is to mimic those destructive
policies. If imitation is the highest form of praise, the last thing we
should want is for the U.S. government to model its policies on those
dreamed up by the tyrants and mandarins in Beijing.
McCarthy writes that “Comparative advantage is yet another reductive
philosophical construct with little real-world application.” And in an
attempt to prove his accusation, he asserts that the principle of
comparative advantage is violated or rendered inapplicable to reality by
individuals who work to improve their skills.
McCarthy, to put it bluntly, writes nonsense — and nonsense that
proves that he isn’t familiar with the economics of the concept.
First, comparative advantage isn’t a “reductive philosophical construct”; it is, instead, an application of arithmetic.
If some economic entity — say, Jim — can produce a peach by giving up
fewer hats than Jane gives up when she produces a peach, Jim has a
comparative advantage over Jane at producing peaches (and Jane has a
comparative advantage over Jim at producing hats). To put the matter in
more familiar language, Jim’s cost of producing peaches is lower than is
Jane’s. Between them, a larger number of both peaches and hats are
produced if Jim specializes at producing peaches and Jane specializes at
producing hats.
Unless McCarthy is prepared to argue that arithmetic is a “reductive
philosophical construction with little real-world application,” neither
has any business asserting that the principle of comparative advantage
suffers from any such practical irrelevance.
Now to McCarthy’s example of people actively improving their skills.
First, this example — contrary to his suggestion — does nothing to prove
his accusation that comparative advantage is an impractical “reductive
philosophical construct.” Second — and also contrary to his suggestion —
no competent economist or advocate of free trade has ever
denied that the pattern of comparative advantage changes over time, that
these changes are often beneficial, or that they frequently are the
result of conscious human choices.
Like manyothersbeforehim,
McCarthy reveals his ignorance of economics, and of the case for free
trade, when he argues that individuals who upgrade their skills, or
firms that strive to gain efficiencies in serving new markets, act
inefficiently and in ways inconsistent with comparative advantage.
If McCarthy wants to make a case against free trade and for
industrial policy, that’s fine. But no such credible case can be
constructed from the ashes of the horde of strawmen whom he has slain.
4) McCarthy ignores the actual reality of predatory pricing.
McCarthy is particularly infuriating when he talks about the
“reality” of predatory pricing, in a clever story about do-gooding
“LawMart” (U.S. producers) getting put out of business by the nefarious
“MafiaMart” (Chinese producers) who sells stolen goods at unfair prices.
While this makes for a great soundbite, his understanding of how hard
it is to actually pull off successful and sustainable predatory pricing is more fiction than reality.
In particular, this story ignores the existence of capital markets,
third-country producers, and how cutthroat modern global competition
actually is (for every company, foreign or domestic, thinking of
implementing predatory prices there are dozens of other firms salivating
at the idea of entering the market and pleasing those customers with
lower prices). This is why, in the real world, predatory
pricing schemes rarely succeed, and dire warnings of unfair foreign
competition — see, eg, Japan in the 1980s — usually look foolish in
retrospect.
Second, for someone who likes to push an approach supposedly grounded
in reality, McCarthy ignores the fact that the United States has loads of policies
already in place that are meant to protect our “LawMarts” from dumping
and other predatory behavior, such as the anti-dumping and
countervailing duties administered by the Commerce Department and
International Trade Commission to police “unfairly” priced or subsidized
imports that injure American companies. These protective “trade
remedies” are used a lot, as demonstrated by the fact that we have over
500 AD/CVD measures on the books already targeting all sorts of goods
and countries (including, especially, China).
And that leads me to my third, and perhaps most important point:
contrary to what McCarthy claims, in the real world, the legal system in
place has actually been captured and corrupted by LawMart (as public choice 101 predicts it would). Indeed, for decades now the “LawMarts” of America have routinely colluded with government officials of all stripes to design a system
that has little to do with policing actual “unfair” trade or predatory
pricing but instead simply doles out protection from fairly traded
imports at U.S. consumers’ expense. So if anyone’s acting like the
“mafia” in this case, it’s sure not the foreigners. So much for
“reality”!
5) McCarthy hasn’t read the whole passage, from Adam Smith’s
Theory of Moral Sentiments, from which he quotes Smith’s warning about
the “man of system.”
In a move that can be described only as Orwellian, McCarthy accuses
opponents of conscious state direction of large swathes of the economy
of failing to grasp the wisdom of Smith’s warning of the pretentions of
the “man of system.” This is nuts. Judging from Adam Smith’s quote, the
man of system isn’t the proponent of free trade but the protectionist,
such McCarthy.
Indeed, it isn’t us opponents of protectionism and industrial policy
who wish to engineer the economy, as if it were a machine, into some
pre-conceived appearance and pattern of performance. Those who are
deluded with such a conceit are the likes of McCarthy and others. It is
they, not us, who arrogantly believe that if the prevailing detailed
pattern of a free market doesn’t match the ideal image they’ve conjured
in their brains, than the problem is with the market rather than with
their necessarily limited imaginations. It is they, not us, who suppose
that government officials possess the Promethean knowledge and skill
necessary to replace the results of decentralized competitive markets
with better results, ones arising from an allocation of resources
consciously chosen by those charged with systemizing what the
economically ignorant mistakenly regard as the disorderly pandemonium of
free markets. And it is they, not us, who ignore the baneful influence
that special-interest groups inevitably have on the decisions of
government officials who have the power to grant privileges with tariffs
and subsidies.
In short, it they, not us, who are the men (and women) of
system against whom Smith warned — a reality that would have been
crystal clear to McCarthy’s readers had he quoted in full the passage
from Smith about the man of system. Here’s the part that McCarthy left
out:
He [the man of system] seems to imagine that he can
arrange the different members of a great society with as much ease as
the hand arranges the different pieces upon a chess-board. He does not
consider that the pieces upon the chess-board have no other principle of
motion besides that which the hand impresses upon them; but that, in
the great chess-board of human society, every single piece has a
principle of motion of its own, altogether different from that which the
legislature might choose to impress upon it. If those two principles
coincide and act in the same direction, the game of human society will
go on easily and harmoniously, and is very likely to be happy and
successful. If they are opposite or different, the game will go on
miserably, and the society must be at all times in the highest degree of
disorder.
Everyone is entitled to their opinions, but McCarthy’s lack of
economic training is painfully obvious. As such, I would suggest that
maybe next time Dougherty is impressed with McCarthy’s economic claims,
he may want to it check out with his economist friends. I know he has a
few."
"When the New York legislature passed major changes
to the state's rent regulations in June 2019, critics warned the new
law would reduce investment in, and renovations of, rental properties in
New York City. Six months later, those predictions are bearing out.
Bloomberg reported
this morning that sales of apartment buildings in the Big Apple fell by
36 percent in 2019, and that the money spent on those sales fell by 40
percent. The prices investors were paying for rent-stabilized
units—where allowable rent increases are set by the government and
usually capped at around 1 or 2 percent per year—fell by 7 percent.
"The
fact that there's no correlation between the amount you put into a
building and the amount of rent you can charge has completely shifted
investment interest in rent-stabilized buildings," Shimon Shkury,
president of the brokerage Ariel Property Advisors, told Bloomberg.
Shkury
was referring to provisions of the state's 2019 rent regulations that
make it much more difficult to pass along the costs of apartment
renovations (such as adding a new oven) and major capital improvements
(such as adding a new roof) to tenants.
That
law also eliminated landlords' ability to "deregulate" (that is, charge
market rates) for rent-stabilized apartments once rents reach certain
levels.There are about a million rent-stabilized units in New York City.
In
addition to a decline in sales, landlords are reportedly cutting back
on the money that they're putting into the buildings that they do own.
According
to a January survey conducted by the Community Housing Improvement
Program (CHIP)—a trade association representing owners of
rent-stabilized buildings in New York City—69 percent of building owners
have cut their spending on apartment upgrades by more than 75 percent
since the passage of the state's rent regulations. Another 11 percent of
the landlords in the survey decreased investments in their properties
by more than 50 percent.
The new law's limits on recouping the
costs of renovating apartments mean it is often more financially
feasible to leave old apartments vacant.
"A big majority of our
housing stock of stabilized units have been occupied between 40 and 50
years. These units require up to $100,000 and sometimes more, to
complete a gut rehabilitation. You don't need to be a genius to
understand it makes no sense to invest that much only to get an $83.00
rent increase," one survey respondent told CHIP.
CHIP, alongside the Rent Stabilization Association, is suing state and city officials over the new regulations.
The Commercial Observer reports
that the new rent laws are encouraging small- and mid-sized landlords
to exit the market entirely, writing that "many property owners have
woken up to a world where their buildings are worth 30 to 50 percent
less than they were a year ago."
All of this conforms with
predictions made by the Manhattan Institute's Howard Husock, who warned
that limiting rent increases would lead to less maintenance and to
deterioration of existing rental housing.
"The opposite of
gentrification—call it shabbification—would emerge, as city housing
stock becomes more and more degraded," Husock wrote
last May. "Middle-class and working-class neighborhoods, where rents
are often not that high (in some outer-borough neighborhoods, market
rents are lower than permitted by law) would be at particular risk."
New York City does have serious housing affordability issues. But much of that can be blamed on the local leaders' failure to allow for enough new housing development
to accommodate the city's growth. Rather than issuing market-destroying
price regulations, the city authorities should help the city's tenants
with zoning reforms that allow more housing construction. In other
words, by letting markets work."
"There is no climate policy (short of geoengineering to block a
portion of sunlight reaching the earth) that would stop Australia’s
fires or prevent them from recurring.
Climate policies are things that would, over time, change how
much CO2 we ultimately put into the atmosphere. And contrary to the tone
of much activism, things that would be worth doing are not a big reach.
Battery research (to support solar) is already well-funded; a solution
for nuclear phobia may not be at hand, but billions have been spent
developing nuclear prototypes so wholly unlike the problematic reactor
designs of the 1970s that they shouldn’t be discussed in the same
category. And what’s so hard about a carbon tax? Nothing."
"David Wallace-Wells,
author of last year’s “Uninhabitable Earth,” a jeremiad so
extreme that it was praised by reviewers even as it was panned by
climate scientists, wrote a column in
New York magazine saying, in so many words, never mind. He discovers
“deep—perhaps fatal—problems” with the worst-case emissions projection
(known as RCP 8.5) that underlies most “business as usual” climate
scenarios. He says fellow activists need to revise their “understanding
in a less alarmist direction.”"
"the path of emissions most consistent with historical economic,
technological and demographic trends is RCP 4.5—the second-best
scenario. Notice that it’s a much smaller jump from RCP 4.5 to the
best-case scenario of RCP 2.6 than to RCP 8.5, which posits a near
collapse of the global economy and a world that burns an implausible six
times as much coal as today. Sure enough, the latest data confirm that,
outside China, global emissions were flat in 2019 and the world overall
remains on track for the second-best scenario."
"What about Australia’s and California’s wildfires? Some won’t want to
hear it, but climate policy is not a solution for the problems of forest
management, especially the need for controlled burns to reduce the fuel
build-up that leads to catastrophic conflagrations."
"In “The Plot to Politicize Banking”
(op-ed, Jan. 15), Phil Gramm and Michael Solon argue that the Community
Reinvestment Act encouraged risky lending by banks before the 2008
financial crisis. Some academic evidence does suggest a conflict between
CRA performance and bank safety and soundness.
More striking,
however, is the extent to which CRA lending doesn’t reach the people the
law intends to help. My research for the District of Columbia, for
example, shows that between 65% and 70% of recent CRA mortgages went to
high-income borrowers moving to low-income areas, rather than to the
low-income residents the law targets.
Gentrification is inevitable and often beneficial to urban
communities, but it requires no help from government. I was therefore
glad that the Trump administration has proposed no longer to count
“gentrifier” loans under the CRA. Claiming, as opponents of reform have,
that current CRA regulations mainly help the poor is disingenuous and
does a disservice to financial inclusion.
"such proposals would increase the federal deficit dramatically and
destabilize the market for private health insurance, threatening
health-care quality and choice.
While estimates by the Congressional Budget Office and other
analysts have concluded that a public option-style proposal would reduce
federal deficits, those effects are predicated on two flawed
assumptions: first, that the government will negotiate hospital and
provider reimbursement rates similar to Medicare’s fee schedules and far
below what private insurers pay; second, that the government would
charge “actuarially fair premiums,” which cover 100% of provided
benefits and administrative costs.
History demonstrates we should be skeptical of cost estimates that rely
on such assumptions. Political pressure upended similar financing
assumptions in Medicare Part B only two years after the entitlement’s
creation. The Johnson administration in 1968 and then Congress in 1972
had to intervene to shield seniors from premium increases. Objections
from health-care providers to low reimbursement rates have regularly led
to federal spending increases in Medicare and Medicaid. The result
isn’t hard to fathom. If premiums can’t rise to cover program costs, or
reimbursement rates are raised to ensure access to a reasonable number
of providers, who’ll pay? Taxpayers, who were promised a self-sufficient
government program."
"a public option available to all individuals and employers would add
more than $700 billion to the 10-year federal deficit. The annual
deficit increase would hit $100 billion within a few years. Some 123
million people—roughly 1 in 3 Americans—would be enrolled in the public
option by 2025, broadly displacing existing insurance. These estimates
don’t include the costs of additional Affordable Care Act subsidies and
eligibility expansions proposed by Messrs. Biden, Buttigieg and
Bloomberg."
"federal spending on the public option would exceed total military
spending by 2042 and match combined spending on Medicaid, the Children’s
Health Insurance Program and ACA subsidies by 2049. In the latter year
the public option would become the third most expensive government
program, behind only Medicare and Social Security. The public option
alone would raise the federal debt by 30% of gross domestic product over
the next 30 years."
"if tax increases to pay for a politically realistic public option were
limited to high-income filers, the top marginal rate would have to rise
from the current 37% to 73% in 2049—a level not seen since the 1960s.
Such large rate increases would undoubtedly have economic effects,
causing revenue to fall short of our static estimates."
"The generous cost-sharing rules in the public option would likely
increase demand for health-care services, while the federal government
would be unlikely to implement the stringent and sometimes painful
cost-management procedures needed to limit use."
"the public option would quickly displace employer-based and other
private insurance. This would force some private insurers to exit the
market and encourage greater consolidation among remaining insurers.
Consumers seeking coverage would be left with fewer insurance options
and higher premiums."
"many health-care providers would suffer a dramatic drop in income, while
at the same time experiencing greater demand for their services. Longer
wait times and narrower provider networks would likely follow for those
enrolled in the public option, harming patients’ health and reducing
consumer choice. Declines in provider payments would also affect
investment decisions by hospitals and may lead to fewer new doctors and
other medical providers."
"The evidence of economic harm from tariffs keeps piling up. Two
studies out this month from the National Bureau of Economic Research
(NBER) indicate—again—that U.S. tariffs are paid almost entirely by
American consumers, while illustrating how they also act as a drag on
U.S. exports.
The first paper
is by economists at the Federal Reserve Bank of New York, Princeton and
Columbia. They examined data on U.S. customs through October 2019. By
then, as they calculate, the average U.S. duty had more than tripled,
from 1.6% to 5.4%. But foreign firms generally did not cut prices to
compensate. Instead, “approximately 100 percent of these import taxes
have been passed on to U.S. importers and consumers.”
The exception was steel imports, for which the tariff
pass-through rate “falls to around 50 percent a year after the tariff
was applied.” This cuts both ways: On one hand, at least American steel
users bear only half the extra cost. But then how will President
Trump
revive steel jobs? “The fact that foreign steel producers have
lowered their prices,” the economists say, “may help explain why U.S.
steel production only rose by 2 percent per year between the third
quarter of 2017 and the third quarter of 2019.”
The second paper
is by economists at the Federal Reserve, the University of Michigan and
the Census Bureau. Their focus is the weakness in U.S. exports, where
growth has been flat or negative, even when excluding “exports to China
or products facing retaliation.” What gives? One factor, as they wryly
explain: “Firms’ reliance on global supply chains can complicate the
application of traditional mercantilism.”
By value, the items on
Mr. Trump’s many tariff lists are mostly—57%, the study
says—intermediate goods. Hence the boomerang effect, since American
companies use these inputs to make their own products. The authors add
that “84% of total U.S. exports were by firms facing at least one import
tariff increase.”
Those companies represent 65% of manufacturing
employment, another big concern for Mr. Trump. “For all affected
firms,” the economists estimate, “the implied cost is $900 per worker in
new duties.” For manufacturers, it’s even higher: $1,600 per worker.
This fits with the rest of the evidence. A study from the Federal Reserve, which we recently wrote about,
said: “A small boost from the import protection effect of tariffs is
more than offset by larger drags from the effects of rising input costs
and retaliatory tariffs.” An NBER paper in March said that
“the full incidence of the tariff falls on domestic consumers, with a
reduction in U.S. real income of $1.4 billion per month.” Don’t forget
the duties on washing machines, which researchers say raised prices on washers—and also on dryers—by about 12%.
Protectionists may defend their policies on political grounds, but that means ignoring the mounting evidence of economic harm."
"This analysis shows that growth in average wages has been running about
3.9 percent per year in the Current Population Survey over the past two
years, a bit firmer than the pace right before the Great Recession but
below the near 5 percent reached in 2000.
But increases to minimum wages at the state and local level have put 0.4
percentage points of upward pressure on this recent growth. Absent that
pressure, wage growth in the Current Population Survey over the last
two years would have been 3.5 percent. That’s still a fine result, but
it’s a bit cooler than the unadjusted data suggest.
Wage pressure from minimum wage workers is magnified when you look at
only the lowest wages. That’s because while minimum wage work makes up
about 6 percent of all usual hours worked, it’s around 13 percent of
hours worked by Americans in the bottom third of wages.
As the analysis has shown us, wage growth
at the bottom is doing well. It has been around 4.1 percent over the
last two years — above the 3.6 percent at the top end, and above the
overall average of 3.9 percent.
But absent the pressure from minimum wage workers, growth at the bottom would have been closer to 3.3 percent."
"In recent years, Sun Belt cities such as Dallas, Houston, and Atlanta
have attracted millions of domestic migrants who left expensive coastal
cities to find a lower cost of living. From the years 2013 to 2017, for
example, about 6,174 residents per year left New York’s metropolitan
area for Houston alone—two and a half times as many as went the other
way.
According to Texas Monthly, they don’t know what’s good for them. Quoting an analysis of census data by New York’s Citizens Budget Commission (CBC), Texas Monthly
contributor Peter Holley said, “monthly median housing costs in Houston
in 2016 … were $1,379, nearly $400 less than New York City. However,
median transportation costs were $1,152, a figure 38 percent higher than
for New Yorkers. In total, the study found, living in Houston was only
$79 cheaper each month than New York.”
But, Holley continues, the news for Houstonians gets worse: “When
considering housing and transportation costs as a percentage of income,
Houston (and Dallas-Fort Worth, for that matter) appear significantly
less affordable than cities with much more expensive housing, including
New York, San Francisco, Chicago, and Boston. The annual median
household income in Houston was just under $61,000 in 2016, while in New
York that same figure was just over $69,000. As a result, Houstonians
spend just under 50 percent of their income on those combined costs,
whereas New Yorkers spend just over 45 percent.” The reason New Yorkers
can save money: a cheap mass transit system that lets them escape the
expense of car ownership.
These figures seem alarming. Are the domestic migrants swarming into
Texas fooling themselves? As it turns out, no: The CBC’s and Texas Monthly’s conclusions rest on a series of questionable methodological assumptions and poor inferences. Here’s where they went wrong. Step 1: Using metropolitan-area averages
The Citizens Budget Commission’s report uses statistics for
census-defined metropolitan areas, which include central cities as well
as remote exurbs with low land prices and housing values. To take one
example: in Dover, New Jersey, about 31 miles from midtown Manhattan,
home values average $278,000, according to Zillow Research.
This is the same average price as in Katy, Texas, at the edge of
Houston’s metropolitan area, 28 miles from downtown. The census-defined
New York metropolitan area, furthermore, does not include all its
suburbs. It excludes wealthy towns such as Princeton, New Jersey, and
Greenwich, Connecticut.
If we compare desirable central areas with the best jobs access,
however, then Houston looks much better. Montrose, for instance, is a
hip neighborhood nearly adjacent to downtown Houston and only a few
miles from Houston’s most important secondary job centers. An average
one-bedroom apartment rents for $1,325 per month, according to Zillow.
In Brooklyn Heights, an analogous neighborhood in New York—Times Square
is a 23-minute subway ride away—one-bedroom rents average almost $3,274
per month.
Step 2: Counting taxes selectively
The CBC report includes property taxes in the cost of housing for
homeowners and expresses housing and transit costs as a percentage of
before-tax rather than after-tax median income. Therefore, the CBC’s
methodology will overstate the burden of housing costs in areas where
property taxes are an unusually large portion of overall tax revenue. As
it turns out, Texas is exactly such a place.
Property taxes in Texas are high. In Harris County, which includes
most of the Houston metropolitan area, the effective tax rate is 2.31%—in the top five percent of all counties in the United States and about three times the average
effective rate of 0.8% in New York City proper. (New York’s convoluted
system of property assessment gives many wealthy homeowners even bigger
breaks on property taxes: Mayor Bill de Blasio, for example, owns two $2 million townhouses on which he pays property taxes of 0.2%.)
Texans, however, enjoy much lower taxes than New Yorkers in other
domains. The state has no income tax, for example, whereas state income
taxes in New York range from 4% to 8.82%. According to the Tax Foundation,
in 2010, property taxes accounted for 45.2% of total state and local
tax receipts in Texas but just 32.4% in New York state (most of which
has higher property tax rates than the city). New Yorkers also pay for
most of the costs of their public transit through tax subsidies, which
come out of residents’ taxes but isn’t counted as a transportation
expense in the CBC report.
Step 3: Overlooking differences in quality
It’s easy to compare the prices of average houses in different
metropolitan areas, but what about the houses themselves? The envious
responses to a viral tweet
by a new Houstonian showing off her apartment might suggest a big
difference in housing quality, and this is borne out by some figures.
Houston proper and Manhattan, for example, have about the same
population, but Houston’s apartments are about 20 percent larger, averaging 877 square feet compared to 733 in Manhattan. Likewise, Houston apartments have better amenities: 36 percent of them have in-unit washer-dryers, for instance, compared to 20 percent in New York.
The quality of transportation also differs. The biggest expense of
travel is not money but the value of one’s time, and New Yorkers spend
about 25% more time commuting than Houstonians—the average one-way
commute time in New York is 37.6 minutes, compared to just 30 minutes in Houston.
Step 4: Making misleading income adjustments
Even after these questionable methodological choices, the CBC still
finds that living in Houston costs less in absolute dollars. But as a
percentage of income, New York, which has a higher average household
income, is cheaper. This is true, but the lesson that Texas Monthly
draws by implication—that workers moving from New York to Houston would
see their incomes drop by more than enough to offset the lower cost of
living—rests on a false inference that ignores the differences between
the two regions’ economies.
The New York metropolitan area has a high average income because it
is unusually filled with skilled professionals who could earn high
incomes anywhere; meanwhile, the region’s high housing prices have
driven lower-income workers to leave. The Houston region, on the other
hand, has a proportionally larger working-class population. This
difference is reflected partially in educational attainment figures:
38.7 percent of NYC residents aged 25 and above had a BA or higher,
compared to just 31.8 in Houston. Therefore, if a worker earning an
average salary in New York left for Houston, he would quite likely earn
well above Houston’s average income.
The perils of the CBC’s income adjustments are exemplified by the
fact that the San Jose area, where small bungalows sell for a million
dollars or more, had the third lowest housing expenses relative
to income. This is largely because San Jose is filled with extremely
high-earning technology workers: the average household income in the
region is above $124,000. But if you’re not a computer programmer, you
would be foolish to think that you could save money on housing costs by
moving to San Jose
Texas Monthly told a story that a lot of people wanted to
hear: loosely regulated housing markets like Houston have long
embarrassed ideological opponents of free markets who insist that only
rent controls and massive public subsidies can provide affordable
housing. There is a ready audience for the argument that Houston’s
affordability is a mirage. If you ever find an argument like this
tempting, though, ask yourself: is it more likely that you’re mistaken,
or that the millions of Americans voting with their feet are?"
You’ll also hear critics claim dollar stores engage in “predatory” behavior by offering prices that are simultaneously too low (undercutting potential competitors) and also too high (as compared to a per-unit cost at the Costco 15 miles away).
Up until 2015, Haven, Kansas, a
town of just over 1,200 people, had one grocery store: the Foodliner, a
mom-and-pop store owned by a local, Dough Nech. Around 225 locals a day
would cycle through the store, picking up basics like bagged lettuce and
chicken.
That changed when a Dollar General opened in Haven in
February 2015. Almost immediately, Nech saw a drop in the flow of
customers through Foodliner. By last year, they rang up only around 125
people; sales dropped by 40%, he told The Guardian. This August, the Foodliner permanently closed.
Dollar
General is the fastest-growing retailer in the U.S. and it, along with
its competitors Dollar Tree and Family Dollar, have made a killing in
recent years by expanding into some of the county’s most vulnerable
communities: small, rural towns, and urban, predominantly black
neighborhoods. When that happens, dollar stores essentially take
over the market, making it impossible for independent local retailers,
like Foodliner, to thrive.
The bags of flour at a Dollar
Store just south of San Francisco cost only $1, but they also only weigh
two pounds [50 cents per pound]. Most bags in the supermarket are five
pounds, and can be scored for less than $2.50 [50 cents per pound] at
cavernous retailers like Walmart or Costco – though these require time
and, often, a car to access.
Dollar store raisins are only 4.5
ounces. At a big box store, however, 72 ounces of raisins cost $10.50 –
meaning dollar store customers are paying 52% more.
Cartons of
milk at a dollar store are only 16 ounces – which prorates to $8 per
gallon, more than what you would pay for even top-of-the line milk at
Whole Foods.
Note that those same criticisms could also be directed to the
thousands of convenience stores and gas stations across the country that
also charge higher prices for food items than Walmart, Costco, and
Whole Foods. Plus, to get the low prices at Costco you need to first pay
a $60 annual membership fee, which may be prohibitive for many
low-income shoppers.
Here’s the conclusion of Willams’ article on the appalling elitism of banning dollar stores:
For people with cars, free time,
and disposable income, “just drive two miles to the grocery store” may
seem like benign advice. But for people just getting by, it’s dismissive
of their real challenges.
If the same work had been done by a
food bank—30,000 locations providing ultra-affordable, shelf-stable
groceries, concentrated in areas with the most need—would we applaud it?
Perhaps,
but only if the signage were subtle and they weren’t close enough that
people could walk to them. We wouldn’t want to look like the kind of
neighborhood that needs those.
It’s not wrong to care about
community character or beautiful streets. But it’s an injustice to care
about them so much that you’ll use government power to block (other)
people’s access to affordable bread, pencils, and toilet paper. And it
adds condescending insult to injury to claim to be doing so “for their
own good.”"
We can be preached to forever
about “clean electricity” messages, and bedazzle farmers with the
prospects of on-going revenue from renewables, but the extensive mining
worldwide for turbine and solar materials, and the decommissioning
details, and the social changes that would be necessitated without the
thousands of products from those deep earth minerals and fuels, remain
the dark side of the unspoken realities of renewables.
Lets’ be clear about what that means. First, it’s not renewable energy, it’s only renewable electricity, and more accurately its only intermittent electricity.
Renewables have been the primary driver for residents of Germany,
Australia, and California behind the high costs of electricity. Second
and most important is, electricity alone is unable to support
militaries, aviation, and merchant ships, and all the transportation
infrastructure that support commerce around the world.
Everyone
knows that electricity is used extensively in residential, commercial,
transportation, and the military, to power motors and lite the lights;
but it’s the 6,000 products that get manufactured from crude oil that
are used to make those motors, lights, and electronics (see table
above). Noticeable by their absence, from turbines and solar panels, are
those crude oil chemicals that renewables are currently incapable of providing.
We’ve
had almost 200 years to develop clones or generics to replace the
products we get from crude oil such as: medications, electronics,
communications, tires, asphalt, fertilizers, military and transportation
equipment. The social needs of our materialistic societies are most
likely going to remain for all those chemicals that get manufactured out
of crude oil, that makes everything that’s part of our daily
lifestyles, and for continuous, uninterruptable, and reliable
electricity from coal or natural gas generation backup.
…..
Hopefully,
before committing to an all-electric world, we can achieve the
technical challenges of discovering a green replacement for the
thousands of products based on fossil fuels being provided to every
known earth based infrastructure, and society will accept the
consequences of altering their lifestyles that will result from less
services and more personal input to accommodate losing the advances
fossil fuels have afforded them."
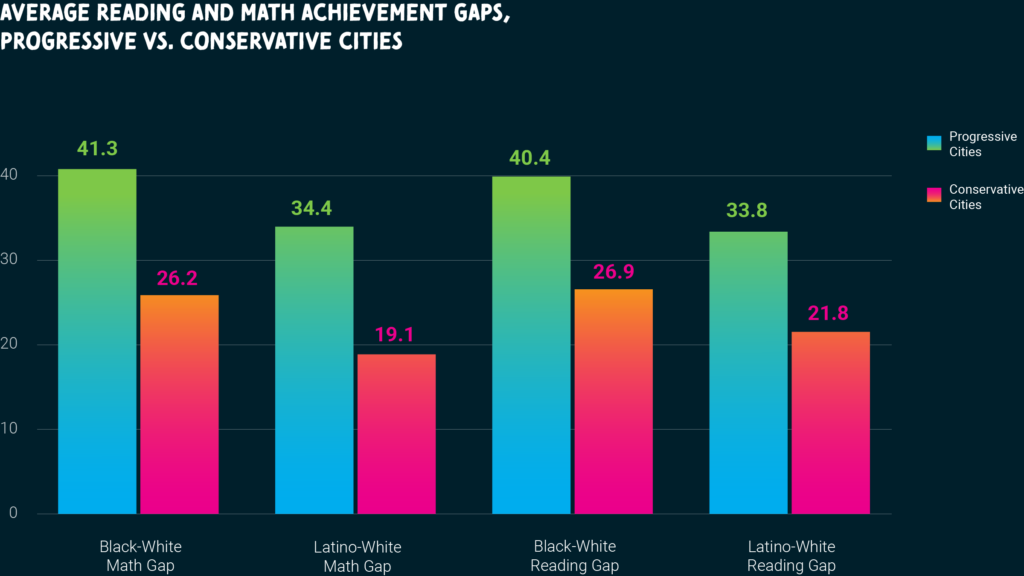
"Huge achievement gaps for black and Latino students are The Secret Shame
of progressive cities, reports the brightbeam network. Progressive
cities, such as San Francisco, have much larger gaps than conservative
cities, such as Fort Worth.
They controlled for other factors that could potentially
explain the different educational outcomes, including per-pupil
spending, poverty rates, population size and rates of private school
attendance but none of these other variables made a difference. The
variable that mattered most when it came to predicting the size of the
achievement gap was whether a city was progressive or conservative.
In San Francisco, for example, 70 percent of white students and 12
percent of blacks are proficient in math, a 58-point gap. In Washington,
D.C., the black-white reading gap is 60 points.
“By contrast, city and school leaders have effectively closed or even
erased the achievement gap in either math, reading or graduation in
three of the most conservative cities the researchers looked at —
Virginia Beach, Anaheim and Fort Worth,” Sanzi writes.
Educators should be flocking to Virginia Beach, Virginia to figure
out what it’s doing right: “The black-white gap in math proficiency is
only 3 percentage points and the gap in reading proficiency is a
miniscule 1 percentage point,” the report notes. “The Latino-white
proficiency rate gaps in Virginia Beach actually favor Latino students
by 2 percentage points in both math and reading.”
Are children from Navy families more likely to succeed in school?"
I don’t think we should care about GAPS, but rather about how well
people do. For example in some of the conservative cities, the
black-white gap is smaller not because black people do better, but
mainly because white people do worse.
That’s true in Detroit: The gap is small because the very small
number of white students in district schools are performing just as
badly as the non-white students. Most parents now send their kids to
charters, schools in nearby suburbs or to private schools. But Detroit
is an outlier, according to the report. Elsewhere, small gaps are not
the result of low achievement by whites."
"When Visit Sarasota reported at the end of 2019 the claim that the
Nathan Benderson Park rowing center generated a $34 million dollar
economic impact for the county in fiscal 2018, we thought that would be
amazing — if true. But after decades of seeing and analyzing exaggerated
economic impact reports, our economist instincts spurred us to dig
deeper.
The rowing facility is gorgeous and hosts many wonderful events.
There is no doubt it is an asset to the Sarasota area. Whether it is
primarily a public or private asset and how valuable it is to area
residents compared to other crucial facilities and services are the
questions. Large sums of local tax revenue were spent building the park,
and more flows to it each year.
To its credit, the analysis used for the economic impact of Nathan
Benderson Park is more accurate than average. It employs a detailed
methodology that relies as much as possible on hard information about
hotel bookings and actual surveys of spectators and participants and
their spending. That is good because far too many economic impact
reports simply rely on estimates.
As a result, estimates of direct expenditures associated with the
rowing park are as solid as they can reasonably be. But the numbers
provided by Visit Sarasota don’t stop there. These numbers reflect the
use of a notorious economic estimation method, developed over 20 years
ago, which claims to capture “indirect” economic benefits of tourism.
The idea is tourists spend money at hotels and restaurants, which take
that money and employ people who spend money on other goods and
services, which in turn employ other people, and so on so forth to
create “indirect” economic “impact” in the region. This notorious
multiplier assumes for every $1 of direct spending, there is another
$0.65 in “indirect spending.”
This part is not based on actual surveys but is an estimate generated
by a company called Implan and id widely used by economic development
agencies who want to report large impacts. It is controversial because
the whole idea of this indirect impact is contested among economists.
Although there is certainly some indirect impact from outside spending,
it is hard to measure and varies widely. Economists attempting to
measure impact accurately tend to shy away from estimates of indirect
impact.
In a specific example for the rowing park, Visit Sarasota estimates
the 2017 World Rowing Championship held at the park generated $22
million in economic impact, while the official body of the world rowing
championships calculated an impact of $7 million. The latter only uses
the direct impact, which the official body knows can be measured
accurately, and not estimates of indirect impact, and such numbers are
used by agencies all over the world to report economic impact of
international rowing events. Meanwhile, Visit Sarasota’s estimates are
more than three times higher. It estimates direct impact at more than
double the international rowing federation and then adds a whopping 65
percent bump for indirect impact. Disparities like this make economists
suspicious of these impact reports.
Estimating impact this way allows Visit Sarasota to claim the $26.38
million in tax money Sarasota County gave the rowing park in 2014-2018
has generated $151.9 million in economic impact, a “600 percent return
on investment.”
Well come on, if that is true, why is anyone investing in Apple and
Amazon if they can get vastly higher returns investing in rowing parks?
Of course, the private investors in Benderson Park are not receiving
anything remotely like 600 percent returns — indeed the park still needs
public (taxpayer) subsidies to cover its costs, so private investors
are not likely making any rate of return. And that 600 percent leaves
out that the park’s economic impact also flowed from a lot of other
investments, including millions in tax money from the state and vast
state and local expenditures to improve local road access to the park.
How much has Sarasota County recouped in tax revenue on its
taxpayer-funded investment to build and operate the park? At best 12
percent of total spending by people who come to rowing park events. It
gets 7 percent via sales tax and 5 percent via the tourist development
tax on short-term rentals like hotels. That amounts to about $1.1
million dollars recovered in taxes in 2018, for example. Add to that the
healthy kickback the rowing park gets from the tourist development tax
to help fund the operations of the park. In 2018, records show that
resulted in $851,856 of tourist tax revenue the county provided for the
park, without which the park would have operated at a net loss. So in
reality, the net contribution of the rowing park to the public purse in
2018 was some $150,000. At that rate, even if we grant a 65 percent
indirect impact, it would take decades for the county to recoup its
investment.
Again, we are not saying there are no benefits from the rowing park.
What we are saying is inflating the benefits is not helpful. The fact
is, the overwhelming majority of the park’s benefits accrue to private
parties: hotels and other renters of homes, restaurants and the like.
That’s why county leaders should take these estimates with an
appropriate grain of salt. Especially when spending taxpayers’ money
always comes with tradeoffs and the county faces major needs to address,
such as sewage spills, red tide causes and consequences, massive
traffic congestion, better services for the homeless and mentally ill,
etc. The list of things more important than subsidizing an already
successful entity is long."
"A
new report from the Competitive Enterprise Institute calls into
question government handling of e-cigarette risk to public health,
especially last week after the U.S. Centers for Disease Control and
Prevention (CDC) tacitly conceded that the spate of lung injuries widely
reported in mid-2019 were not caused by commercially produced
e-cigarettes like Juul or NJOY.
“The Centers for Disease Control failed to warn the public which products were causing lung injuries and deaths in 2019,” said Michelle Minton, co-author of the CEI report.
“By stoking unwarranted fears about e-cigarettes, government agencies
responsible for protecting the health and well-being of Americans have
been scaring adult smokers away from products that could help them quit
smoking,” Minton explained.
Now that the CDC has finally began to inform the public accurately,
it’s too little too late, the report warns. The admission has done
little to slow the onslaught of prohibitionist e-cigarette policies
sweeping the nation, and the damage to public perception is already
done.
Nearly 90 percent of adult smokers in the U.S. now incorrectly
believe that e-cigarettes are no less harmful than combustible
cigarettes, according to survey data from April 2019. Yet the best
studies to-date estimate e-cigarettes carry only a fraction of the risk
of combustible smoking, on par with the risks associated with nicotine
replacement therapies like gum and lozenges. Meanwhile, traditional
cigarettes contribute to nearly half a million deaths in the U.S. every year.
The CEI report traces the arc of CDC and FDA messaging and actions,
starting in late June 2019, about young people hospitalized after
vaping. Concurrent news reporting ultimately revealed, though virtually
never in the headline, that the victims were vaping cartridges
containing tetrahydrocannabinol (THC), the key ingredient in cannabis,
with many admitting to purchasing these products from unlicensed street
dealers. Yet for months the CDC consistently refused to acknowledge the
role of the black market THC in the outbreak, which had a ripple effect
on news reporting and on state government handling of the problem.
By September 2019, over half of public opinion poll respondents (58
percent) said they believed the lung illness deaths were caused by
e-cigarettes such as Juul, while only a third (34 percent) said the
cases involved THC/marijuana.
The CEI report warns that federal agencies should not be allowed to
continue misleading the public about lower-risk alternatives to smoking.
"It’s Davos time, which also means it’s time for Oxfam’s annual whine about wealth inequality and how ghastly everything is.
It would help more than just a little bit if the organisation had bothered to understand the world around them.
The opening grumble from their 2020 report
is that the world’s billionaires own more than 4.6 billion people –
well, yes, they’ve just defined the first group as those who own things,
haven’t they? People who own things own things, strike us all down with
a feather.
Rather more importantly, that’s just how wealth distributions work, as the economists Saez and Zucman
point out, the bottom 50% usually own pretty much nothing. Among other
things, this is down to the fact that it is possible to have negative
wealth, to owe more than is owned. As every kid leaving university with a
student loan does.
The world’s richest 1% have twice as much
as nearly everyone else put together. Well, yes, but who are that 1%?
Anyone with an NHS pension who’s paid off their mortgage would qualify
for that global 1% by wealth. Odds are that everyone even remotely
senior at Oxfam is part of that global 1% too.
The solution to this wealth problem is
apparently that those 1 percenters should pay a 0.5% tax on their
riches. That would – back of the envelope, you understand – means tax
revenue of about half a trillion pounds, serious money even by
governmental standards. But when set against the $25 trillion or so
governments already get, perhaps not all that much. And anyone who
thinks that current governments don’t waste 2% of their current revenues
really isn’t paying attention.
A certain amusement can be had from their
insistence that the wealth of the rich just piles up with no effort on
their own part. They can afford the best advisers, it just increases.
Which is difficult to reconcile with their own evidence that the
aggregated wealth of billionaires fell last year. Or, as CapX’s own Robert Colvile puts it, maybe the rich need better advisers?
Much of the rest of the report is taken up
by complaining that women take on an undue share of caring
responsibilities. That may well be true, but it’s still difficult to
understand why men being taxed on their incomes for the state to employ
women in caring jobs is much better than men sharing their incomes with
their wives and daughters who do the caring.
But enough of the details – what, really, is happening here? The sensei
we need to turn to is C Northcote Parkinson. His great insight was that
the real aim of any organisation is to perpetuate its own existence.
Bureaucracies are no different from other organisms in this sense. This
is where Oxfam has a problem.
Originally founded to provide famine
relief in Greece, it became a charity focused upon the alleviation of
global poverty. Their problem is that extreme poverty is a problem well on the way to being solved. The solution was the one Oxfam didn’t deign to mention, more markets, more capitalism – globalisation, in short.
As poverty worldwide recedes, Oxfam runs
into a problem about its own continued existence. For once the horror to
be alleviated is dealt with, what is the point of the offices, the
brand, the nice jobs with no heavy lifting? That presumably explains why
in recent years they have changed tack and now insist that wealth
inequality is the root of a new dystopia.
It also explains this year’s thrashing
around with feminist mantras about the caring economy and the
interesting attempt to redefine the poverty line upwards. They suggest
changing the definition to anyone on less than $5.50 a day, in what
looks like a pretty obvious attempt to maintain their own client base.
The possibly bitter truth being that
there’s a time to die for organisations just as there is for organisms.
Oxfam’s time seems to have come, so every year we get this statistically
clumsy raging against the dying of the light. Nil nisi mortuum and all
that, but for Oxfam the fat lady’s sung and it will soon be time to
leave the stage."


LTEC says
I don’t think we should care about GAPS, but rather about how well people do. For example in some of the conservative cities, the black-white gap is smaller not because black people do better, but mainly because white people do worse.Joanne says
That’s true in Detroit: The gap is small because the very small number of white students in district schools are performing just as badly as the non-white students. Most parents now send their kids to charters, schools in nearby suburbs or to private schools. But Detroit is an outlier, according to the report. Elsewhere, small gaps are not the result of low achievement by whites."