Evaluating the free market by comparing it to the alternatives (We don't need more regulations, We don't need more price controls, No Socialism in the courtroom, Hey, White House, leave us all alone)
"We quantify the amount of spatial
misallocation of labor across US cities and its aggregate costs.
Misallocation arises because high productivity cities like New York and
the San Francisco Bay Area have adopted stringent restrictions to new
housing supply, effectively limiting the number of workers who have
access to such high productivity. Using a spatial equilibrium model and
data from 220 metropolitan areas we find that these constraints lowered
aggregate US growth by more than 50% from 1964 to 2009.
"Between January 2009 and December 2015, White House officials met
with corporate CEOs 2,286 times. A new study, to be presented at the
upcoming Stigler Center conference on the political economy of finance,
shows that access to the White House has several economic benefits.
Since Donald Trump assumed office, there
has been a dramatic increase in the reporting and discussion on crony
capitalism in the U.S.: Trump’s conflicts of interest, his pro-business policies, his frequent meetings with business executives, and the assertion that, more than any other president, he is tuned in to the interests of big business.
But are all these issues unique to Trump? Was the Obama administration completely different?
A new paper by Jeffrey Brown and Jiekun Huang of the University of Illinois at Urbana-Champaign, “All the President’s Friends: Political Access and Firm Value,”
is trying to answer that question using White House visitor logs from
January 2009 through December 2015, when President Barack Obama was in
office. The paper will be presented during the Stigler Center conference on the political economy of finance, which will be held between June 1-2.
Before asking ourselves if the
methodology and interpretation are convincing, it is worth starting with
two anecdotes, both mentioned in the paper.
The first is about Google. The backdrop is an antitrust investigation against Google by the FTC that culminated in an August 2012 FTC document that recommended suing Google for certain practices.
Immediately after that, Google executives had a series of meetings with
FTC and White House officials: for example, Google CEO Larry Page
(currently the CEO of Alphabet, Google’s parent company) met with FTC
officials, and the company’s executive chairman Eric Schmidt met with
Pete Rouse, a senior adviser to President Obama, in the White House. Following those meetings, the FTC closed its investigation after Google agreed to make some changes to its business practices.
The FTC decision to close the
investigation was probably not a direct result of these meetings. After
analyzing White House visitor logs, the Wall Street Journal
found that Google possibly had unprecedented access to the White House:
since Obama took office, Google employees have visited the White House
for meetings with senior officials about 230 times—on average, roughly once a week.
The second anecdote is related to General
Electric (GE). GE and the Obama White House seemed to be very close. In
a July 1, 2010, piece in the Washington Examiner, Timothy Carney wrote:
“Except for maybe Google, no company has
been closer and more in synch with the Obama administration than General
Electric. First, there’s the policy overlap: Obama wants cap-and-trade,
GE wants cap-and-trade. Obama subsidizes embryonic stem-cell research,
GE launches an embryonic stem-cell business. Obama calls for rail
subsidies, GE hires Linda Daschle as a rail lobbyist. Obama gives a
speech, GE employee Chris Matthews feels a thrill up his leg. I could go
on.”
Behind this, wrote Carney, is the close
relationship between GE CEO Jeff Immelt and President Obama: Immelt sat
on Obama’s Economic Recovery Advisory Board and was asked by Obama’s
Export-Import Bank to be the opening act for the president at an Ex-Im
conference. And this may be just the tip of the iceberg.
The most frequent visitors
The reason that the authors chose to
focus on the Obama administration is that it was simply the only
administration to voluntarily release its visitor logs. Previous
administrations didn’t do so, and the Trump administration is unlikely
to do so either.
Using the visitor logs, Brown and Huang
were able to identify 2,286 meetings between corporate executives from
members of the S&P 1500 stock index and White House officials during
the seven-year period between January 2009 through December 2015.
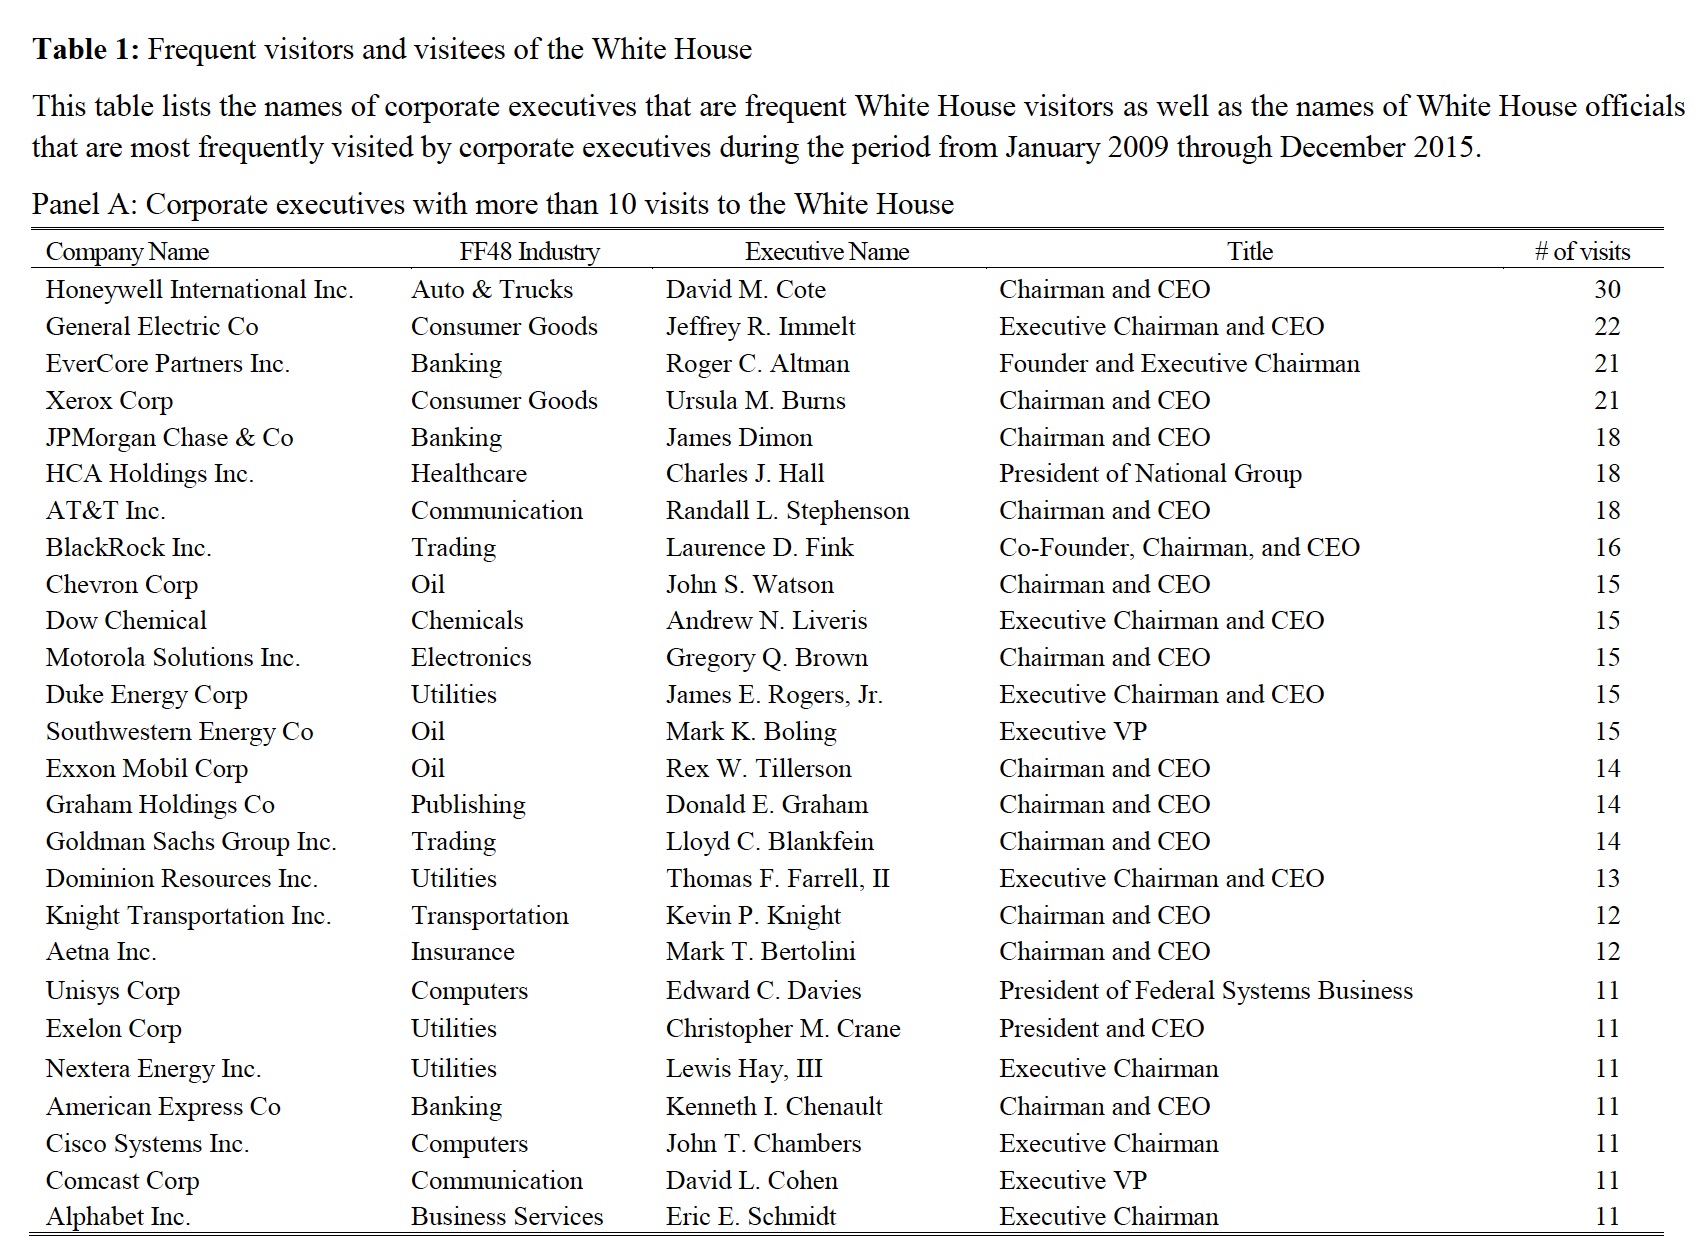
As can be clearly seen from panel A
of Table 1 above, which includes all the executives that had at least 10
meetings in the period studied, the three most frequent visitors were
Honeywell’s David Cote (30 visits), GE’s Immelt (22 visits) and
EverCore’s Roger Altman (21 visits). On average, Cote had meetings in
the Obama White House once every 2.8 months.
Panel B, which includes the list of White
House officials who had the most meetings with business executives,
reveals that the most visited officials were Valerie Jarrett (Senior
Advisor and Assistant to the President for Intergovernmental Affairs and
Public Engagement), Jeff Zients (Assistant to the President for
Economic Policy and Director of the National Economic Council) and
President Obama himself. On average, Jarrett met with corporate
executives once every 24 days.
In assessing the degree of access that
S&P 1500 executives had to the White House during the period
studied, Brown and Huang found that firm-years in which the executives
visit the White House account for around 11.4 percent of the sample,
suggesting that a non-trivial fraction of the firms have political
access. Also, since firms with political access are typically larger,
they account for about 40 percent of the total market capitalization of
firms in the sample.
Campaign contributions and lobbying ‘buy’ access
As access to the White House is still a scarce resource, what are the factors related to better access to it?
Brown and Huang regressed access against a
series of firm characteristics and found that, as defined by the model
they used, an increase in campaign contributions increases the
probability of gaining access to the White House by 2.4 percentage
points. Since the unconditional probability (firm-years in which the
executives visit the White House) is 11.4 percent, 2.4 percentage points
is a significant increase. This, the authors write, is “consistent with
the notion that campaign contributions ‘buy’ political access.”
Their model also indicates that firms
that spend more on lobbying, receive more government contracts, and have
a large market share are also associated with an increased probability
of gaining access to the White House.
Economic gains from access
Access to the White House, Brown and Huang found, has several economic benefits.
One is a positive effect on government
contracts: the average firm generates about $34 million in profits from
incremental contract volume due to political access.
Another is regulatory relief. Using a
dataset of news articles which were characterized as positive or
negative (based on the relative fraction of positive and negative words
in the articles), Brown and Huang matched the articles with White House
visits and found that “treatment firms, relative to control firms,
experience an increase of 0.036 in the number of positive regulatory
news articles during the 12 months immediately following a White House
visit relative to that during the 12 months immediately before the
visit.”
These results, they write, are “in line with the hypothesis that political access enables firms to obtain regulatory relief.”
These and other access benefits are
encapsulated in stock prices. Brown and Huang checked excess stock
returns—specifically, cumulative abnormal returns (CARs) around
corporate executives’ visits to the White House.
“What we find is that these meetings tend
to be associated with significant increase in firms’ stock prices,”
says Huang. “We also find that these companies are able to secure more
favorable regulatory access after the meetings.”
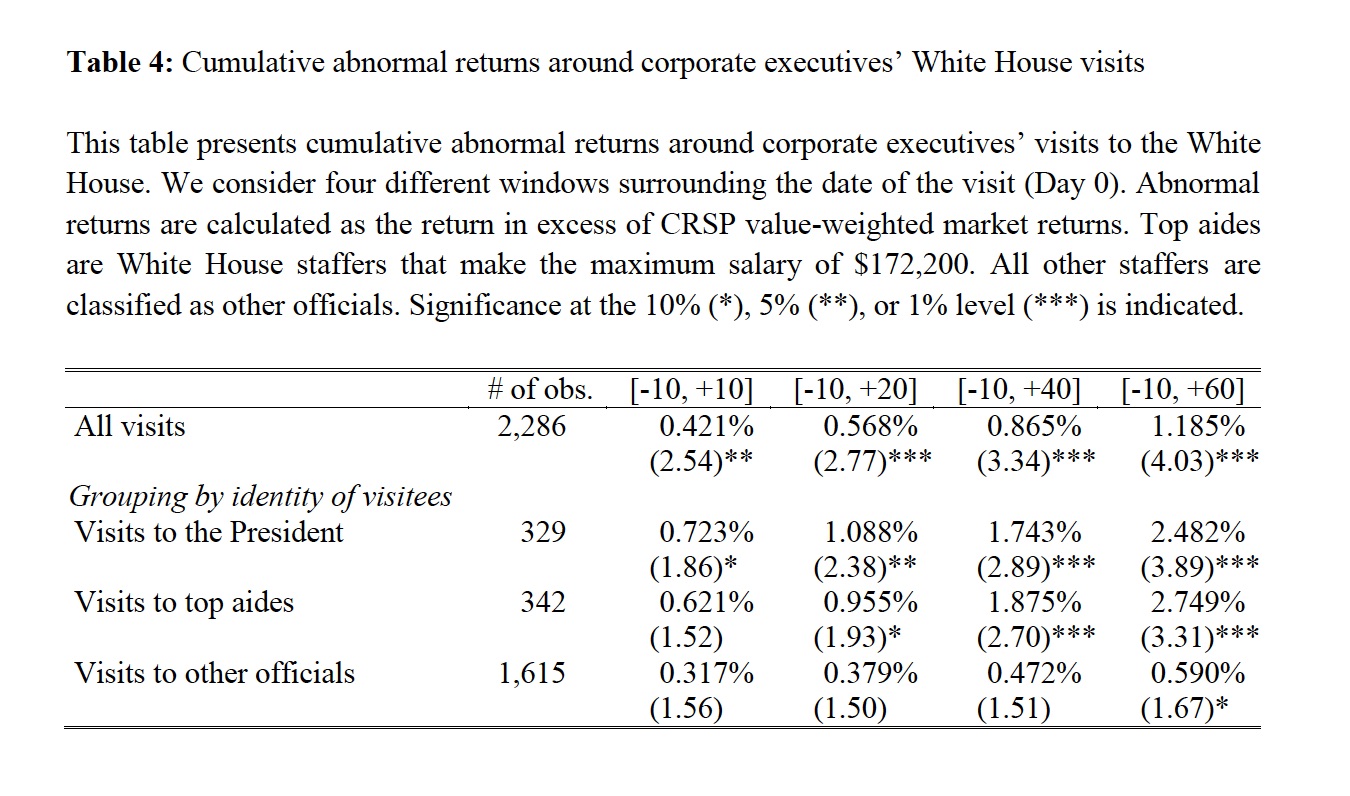
Cumulative abnormal returns in the days around corporate executives’ White House visits
The results show positive and
statistically significant CARs for four timeframes checked by the
authors. The results also indicate that the highest CARs, 2.749 percent,
occurred following a 70-day window around a meeting with Obama’s top
aides—slightly higher
than following a meeting with Obama himself. Since the average market
capitalization of the firms included in the study’s sample is about $36
billion, a 2.749 percent CAR is, on average, equivalent to an almost $1
billion increase in market capitalization.
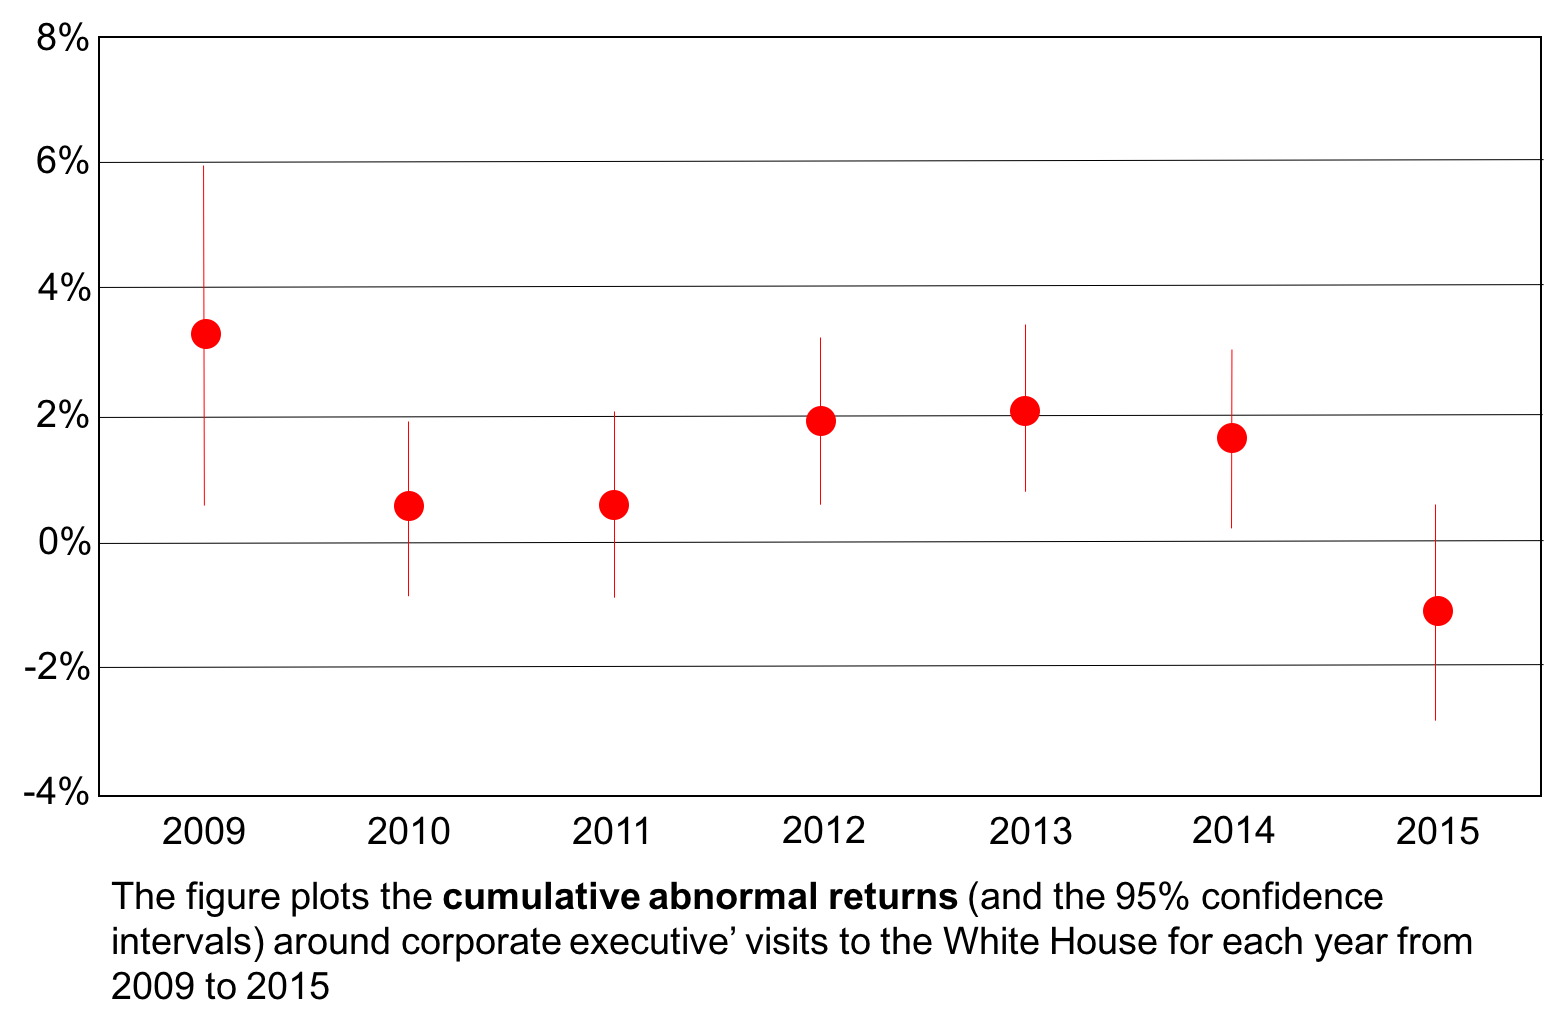
Cumulative
abnormal returns in the days around corporate executives’ White House
visits by year from 2009 through 2015. Source: Brown and Huang (2017).
The excess returns are related to
election cycles: The CARs were significantly positive during the 2012
general election year, the first years after a general election (2009
and 2013), as well as 2014 (Figure 2). These results indicate that
access to influential government officials is particularly beneficial
during those years.
Indeed, confounding factors may be
present, but they were largely treated by Brown and Huang. For example,
they exclude White House visits that are associated with the president’s
advisory board meetings and excluded follow-up visits.
To address possible concerns about
omitted variables that drive both the timing of corporate executives’
meetings with federal officials and stock returns, Brown and Huang used
the election of Donald Trump as a shock, as up until the very last
moment, his Democratic opponent, Hillary Clinton, was widely expected to
win.
Therefore, if the basic notion of their
theory is correct, we would expect shares of the companies that had
access to the Obama White House to underperform as soon as the election
results were announced. And, indeed, that is what they found: in all
four models that they constructed—in which they checked the cumulative
market-adjusted abnormal returns of these stocks from November 9, 2016,
to November 11, 2016—the stocks of the companies that had access to
Obama’s White House showed statistically significant underperformance in
a range that runs between 80 basis points and 130 basis points.
A similar test of Republican administrations, says Huang, will likely
yield similar results. “Before Donald Trump took office, he had a meeting
with the CEO and founder of Alibaba, Jack Ma. Upon the release of the
news that Trump was meeting with Jack Ma, Alibaba’s stock price
increased by 1.5 percent, which is very much consistent with what we
observe.”
The Trump administration could be worse
in this respect than that of Obama. One reason is his policies so far.
Another is that, just recently, the White House announced that it would no longer make its visitor logs available to the public.
The White House is not obligated to make the logs public, but the move
broke with Obama’s practice. The White House cited privacy and national
security concerns. In fact, those issues were already addressed by the
Obama White House by redacting visits that were tied to national
security issues, other particularly sensitive issues, and private visits
that were not related to the business of governing."
One concern about planning is that it will lead government to engage in favoritism and cronyism.
So who would have guessed that when the leaders of the federal
government set out to plan for their own survival—if no one else’s—in
the event of nuclear attack, they failed?
COG—continuity of government—is the acronymic idée fixe that
has underpinned these doomsday preparations. A bunker was installed in
the White House after Pearl Harbor, but the nuclear age (particularly
after the Soviet Union successfully tested an atomic bomb in September
1949) introduced a nationwide system of protected hideaways,
communications systems, evacuation procedures and much else of a
sophistication and ingenuity—and expense—never before conceived….
Strategies for evacuating government VIPs began in earnest in the
early 1950s with the construction of Raven Rock, an “alternate Pentagon”
in Pennsylvania near what would become known as Camp David, and Mount
Weather, a nuclear-war sanctuary in Virginia for civilian officials….
In 1959, construction began on a secret refuge for Congress
underneath the Greenbrier, a resort in West Virginia. In the event of an
attack, members of Congress would have been delivered by special train
and housed in dormitories with nameplated bunk beds.
The most important COG-related activities during the Kennedy
administration came during the Cuban Missile Crisis in October 1962, the
closest this country has come to a nuclear war. Not only was the
military mobilization chaotic—“one pilot bought fuel for his bomber with
his personal credit card”—but VIP evacuation measures were, for the
most part, a debacle: “In many cases, the plans for what would happen
after [a nuclear attack on the U.S.] were so secret and so closely held
that they were almost useless.” …
The Air Force also acquired, for the president’s use, four Boeing 747
“Doomsday planes” with state-of-the-art communications technology,
which were nicknamed “Air Force One When It Counts.”…
Probably the most fraught 24 hours in the history of COG worrying
occurred on Sept. 11, 2001, when al Qaeda terrorists attacked the World
Trade Center and the Pentagon. COG projects and training had been
ceaselessly initiated and honed for a half-century; but, as Mr. Graff
writes with impressive understatement, “the U.S. government [wasn’t]
prepared very well at all.”…
While Vice President Dick Cheney had been swiftly hustled to the
White House bunker, “those officials outside the bunker, even
high-ranking ones, had little sense of where to go, whom to call, or how
to connect back to the government,” Mr. Graff writes. But there were
enough people in the bunker to deplete the oxygen supply and raise the
carbon-dioxide level, and so “nonessential staff” were ordered to leave.
When House Speaker Dennis Hastert tried to call Mr. Cheney on a secure
phone, he couldn’t get through….
When President George W. Bush heard the news about the attacks that
morning, he was in Florida. He was whisked into Air Force One, which,
Mr. Graff notes, “took off at 9:54 a.m., with no specific destination in
mind.” It would eventually land, and the president would address the
country. But “Air Force One’s limitations”—it wasn’t one of the Doomsday
planes—“came into stark relief.” For one thing the plane’s
communications systems were woefully inadequate for what was required on
9/11. “On the worst day in modern U. S. history,” Mr. Graff writes near
the end of his exhaustingly detailed account (I sometimes felt buried
alive under its mass of data), “the president of the United States was,
unbelievably, often less informed than a normal civilian sitting at home
watching cable news.”
Fifty years of planning for a single event, the most important task imaginable—the survival of the republic and their own personal survival—and
top government officials still didn’t get it right. A good lesson to
keep in mind when we contemplate having less-motivated government
officials plan our cities, our energy production, our health care
system, or our entire economy."
Reviewing Roger Backhouse’s biography of the economist Paul Samuelson,
Eric Maskin writes that “The Stolper-Samuelson Theorem implies that
international trade causes inequality between high-skilled and
less-skilled workers to grow in rich countries. The theorem was derived
in 1941 but clearly remains relevant in today’s America of rising
inequality” (“An Einstein of the Dismal Science,” May 20).
Not so fast.
When applied to labor, the Stolper-Samuelson Theorem predicts that the workers whose wages fall as a result of freer trade are (in econ jargon) the relatively more scarce
factor of production – which, in America, is less-skilled workers – and
that the workers whose wages rise are the relatively more abundant
factor of production. In plain language, while the workers in America
whose wages are reduced by freer trade are indeed the lowest paid, they
also are a minority of workers. Freer trade raises the wages of those
workers whose skill-levels are relatively most abundant. Because the
workers in America whose skill-levels are most abundant likely are those
whose incomes are in or near the middle of the income distribution for
workers, Stolper-Samuelson predicts that the wages in America that will
disproportionately rise when trade becomes freer are chiefly those
earned by middle-income workers.
Yet it is difficult to see how a change in the wages distribution
with a disproportionate amount of the gains going to middle-income
workers increases income inequality.
Therefore, to the extent that the
Stolper-Samuelson Theorem applies in reality, it tells us that whatever
increase in income inequality has occurred over the past several decades
is likely not due to the effect that freer trade has on the
distribution of workers’ wages.
Sincerely,
Donald J. Boudreaux
Professor of Economics
and
Martha and Nelson Getchell Chair for the Study of Free Market Capitalism at the Mercatus Center
George Mason University
Fairfax, VA 22030
Note that in this letter I do not argue that income
inequality has not increased in the United States. Instead, I argue
that whatever increase in income inequality there might have been in the
U.S. is not as straightforwardly explained by – or even consistent with
– the Stopler-Samuelson Theorem as many people today (such as Eric
Maskin) presume."
"I often debate the question of whether severe slumps are caused by
financial crisis or tight money. In my view it's usually tight money,
with financial stress being a symptom of falling NGDP. So how would we
test my hypothesis?
While cleaning out my office at Bentley, I came across an old NYT article from June 11, 1933:
Wall Street notes a remarkable contrast between the attitude
toward the war debt question last December and that of the present
time. Last year, financial circles began to become apprehensive about
the war debt question long before December 15. By late November the
pound sterling had fallen to a record low of $3.14 1/2 and the financial
markets were severely depressed. At the present time, although the war
debts payments are due by next Thursday, there has been almost no
discussion of the subject in financial circles, and the possibilities of
wholesale default have left the markets unperturbed.
Why did the markets suddenly stop caring about the war debts issue in
June 1933? For the same reason they suddenly started caring about the
war debts issue in mid-1931. War debts disturbed the financial markets
when they led to devaluation fears, which triggered massive gold
hoarding. By June 1933, the US was off the gold standard, and hence
gold hoarding no longer exerted a deflationary impact on the US.
However, gold hoarding continued to be a problem for countries still on
the gold standard, such as France.
In my book entitled "The Midas Paradox", I did a very extensive
empirical study of this question. The price of German war debt bonds
suddenly become highly correlated with US stock indices in mid-1931
(when Germany got into financial trouble), and this continued through
1932. Fears of German default were triggering a loss of confidence in
the international gold standard. That loss of confidence was justified,
as Germany adopted exchange controls in July 1931 and the UK devalued
in September 1931. At that point people started worrying about a US
devaluation, and gold hoarding rose sharply.
Because the supply of newly mined gold doesn't change very much from
year to year, big changes in the value of gold are primarily caused by
shifts in gold demand. But once the US began devaluing the
dollar in April 1933, increases in gold demand no longer had a
significant deflationary impact on the US. Gold kept getting more
valuable, but now the dollar was losing value. (Recall that price
deflation means that money is getting more valuable.)
Back in 1932, the vast majority of serious people rejected my "tight
money" explanation of the Depression. It was "obviously" caused by
financial turmoil, both domestic and international. Falling NGDP was
seen as a symptom. Only a few lonely exceptions like Irving Fisher and
George Warren took a "market monetarist" perspective, urging a shift
toward expansionary monetary policy. Because we were near the zero
bound, they recommended a depreciation of the dollar against gold. In
1933, FDR adopted their suggestion, and it worked just as Warren and
Fisher predicted---prices and output immediately began rising sharply.
The policy would have been even more effective if not offset by the
NIRA, which sharply reduced aggregate supply.
And there is lots more evidence for the tight money--->falling
NGDP---> financial distress chain of causation. After the dollar
started depreciating against gold in April 1933, domestic bank failures
ceased almost immediately.
Some people claim that tight money did not cause the Great Recession,
because there was no alternative monetary policy at the zero bound of
interest rates. But something similar occurred in the 1980s, when we
were not at the zero bound. Between 1934 and 1980, there was a period
of calm in the banking system. Some people wrongly attribute that to
regulation, but in fact it was caused by higher rates of inflation and
NGDP growth during 1934-80, which made it easier for debts to be repaid.
As soon as the Fed adopted a tight money policy in 1981, and NGDP
growth began slowing sharply, we experienced a bout of bank failures
(mostly S&Ls). The causation in this case clearly went from tight
money to sharply slower NGDP growth to banking distress, as we were not
even close to the zero lower bound on interest rates.
To summarize, the question of whether tight money or financial distress
causes deep slumps might seem almost unsolvable, if you simply focus on
the Great Recession. But those with a deep knowledge of economic
history know that causation clearly runs from tight money to falling
NGDP to financial distress. Unfortunately, economic history is no
longer widely taught in our graduate programs, so we now have an entire
generation of economists who are ignorant of this subject, and who keep
developing business cycle models that are easily refuted by the
historical record."
"Professional sports teams have been relocating to new cities when
they fail to acquire public funding for stadiums. Last year, the Rams
stuck St. Louis with a $144 million bill after the team decided to move to Los Angeles. And earlier this year, San Diego taxpayers were left with a $50 million tab after the Chargers joined the Rams in L.A.
This time around is no different. The Oakland Raiders’ move to Las Vegas will leave Oakland taxpayers stuck with a $163 million bill.
Teams constantly ask taxpayers for handouts despite generating vast
revenues. Billionaire owners get publicly financed stadiums and the
working-class citizens pick up the tab — corporate welfare at its worst.
It’s
understandable that cities want to attract professional sports teams.
People of all ages love sports, and teams often define a community’s
identity. But local governments can’t abandon all logic and principle to
secure a team. That’s what Oakland did, and it didn’t work out.
The San Francisco Chronicle reports that the original $200 million bond
that brought the Raiders to Oakland will cost $350 million. When asked
about the bond, Oakland City Council President Larry Reid acknowledged
it was a bad deal. “The projections were off, but everyone was just
caught up in the emotions of having the Raiders return.”"
"Proponents of taxpayer-funded stadiums insist that stadiums are economic
engines for communities and a wise investment for taxpayers. But
economists from around the country disagree. A 2015 study from the Mercatus Center at George Mason University found these projects provide little to no economic benefit for their communities.
Economist Victor Matheson of Holy Cross
was more to the point: “Whatever number the sports promoter says, take
it and move the decimal one place to the left. Divide it by 10, and
that’s a pretty good estimate of the actual economic impact.”"
Here are the key findings from the Mercatus study:
Professional sports can have some impact on the economy.
Looking at all the sports variables, including presence of franchises,
arrival and departure of clubs in a metropolitan area, and stadium and
arena construction, the study finds that the presence of a franchise is a
statistically significant factor in explaining personal income per
capita, wage and salary disbursements, and wages per job.
But this impact tends to be negative. Individual
coefficients, such as stadium or arena construction, sometimes have no
impact, but frequently indicate harmful effects of sports on per capita
income, wage and salary disbursements, and wages per job. When the
effect of these coefficients appears to be positive, it is generally so
small as to be insignificant.
At most, sports account for less than 5 percent of the local economy.
Though sports are often perceived as a major economic force, sports at
most account for less than 5 percent of the local economy, with the
majority of estimates putting that number under 1.5 percent. Simply
stated, sports teams are not the star players in local economies.
"To any casual observer, the area just south of Trump Tower in Midtown
Manhattan is obviously wealthy: The blocks are crowded with
skyscrapers, and stores include Versace and Ferrari. Diners can pick at
the foie gras and caviar on La Grenouille’s $172 prix-fixe dinner menu.
In
the eyes of federal-bank regulations, though, that sliver of New York
City is a poor neighborhood where median incomes are relatively low.
The anomaly has yielded a hidden benefit for banks such as J.P. Morgan Chase & Co. and
Wells Fargo
WFC 1.30%
& Co. that have crowded branches into the area. Having robust
branch representation in supposedly low-income areas gives them a
better score on a key regulatory test that can help determine how fast
they expand.
"Neighborhoods like the one in Midtown Manhattan could add a new
dimension to the debate, even though branch analysis is only one part of
regulators’ broader CRA evaluations. Its quirky treatment under the CRA
is due to the fact that regulators who enforce the act rely on older,
sometimes unreliable, Census Bureau data to determine an area’s income
level.
New York isn’t an isolated example. Six of the 10 most
popular poor areas for banks to have branches, including the Manhattan
tract, are slated to lose that classification when more recent census
data go into effect this year, according to regulators and data from
fair-lending software company ComplianceTech. But bank regulators have
been using the older data because they stick to a preset schedule of
switching every five years.
In one of these census tracts, a “low
income” area in downtown San Francisco, one of the most expensive
cities in the country, 53 branches pack into an area that census data
indicate has only 1,783 residents. That’s 52 more branches than the
average poor district in the U.S. has, despite the fact the San
Francisco tract has far fewer residents than average.
About 30 miles away in Menlo Park, Calif., a
First Republic Bank
branch on
Facebook Inc.’s
corporate campus is classified as lower income because the
surrounding areas have lower incomes than the median of the broader
area. But the only people with access to the branch are employees and
guests of Facebook"
"Then there is Manhattan’s census tract 102, the bustling Midtown blocks
with the most lower-income bank branches per capita in the U.S.,
according to a Wall Street Journal analysis of data from
ComplianceTech’s LendingPatterns.com. Due to a paucity of residential
buildings in the area, the district bordered by Park and Fifth avenues,
49th and 56th streets has only 230 residents, or about 10 for each of
the 22 bank branches that call the tract home, according to the census
data used by banking regulators."
"But the areas often have few residential buildings, one reason that
can explain the lower-income CRA designation. The fact that banks get
credit for branches in these areas, though, has prompted some criticism.
“Banks
can conform to the letter of the law, but not meet the purpose of CRA,”
says John Vogel, an adjunct professor at Dartmouth’s Tuck School of
Business. This is especially the case, he says, in the classification of
“low- and moderate-income neighborhoods.”"