Evaluating the free market by comparing it to the alternatives (We don't need more regulations, We don't need more price controls, No Socialism in the courtroom, Hey, White House, leave us all alone)
Wednesday, April 24, 2024
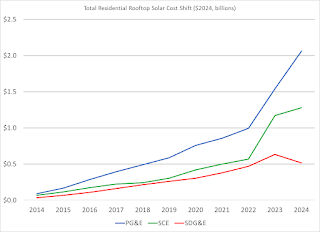
California’s Exploding Rooftop Solar Cost Shift
In 2024, residential PV will shift nearly $4 billion onto others’ bills, more than double the 2020 amount.
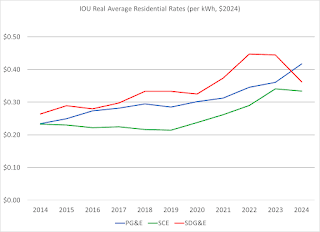
"There’s a lot of anger in California right now about rising electricity
prices. Since 2020, residential rates of the two largest investor-owned
utilities – PG&E and Southern California Edison – have risen,
respectively, by 38% and 40% after adjusting for inflation.
Inflation adjusted rates of San Diego Gas & Electric, the third
largest, have only risen 11% during that time, but SDG&E was already
the most expensive in 2020. The prices of all three are now more than
double the national average. (There are going to be a lot of numbers in this post. If you want the details behind them, this link has a data appendix with the data and code for my calculations.)
Regardless of what is driving utility costs higher, their impact on
rates is multiplied when customers install their own generation and buy
fewer kilowatts-hours from the grid. That’s because those households –
whether they are customers of the utility or of a community choice
aggregator – contribute less towards all of the fixed costs
in the system, such as vegetation management, grid hardening,
distribution line undergrounding, EV charging stations, subsidies for
low income customers, energy efficiency programs, and the poles and
wires that we all rely on whether we are taking electricity off the grid
or putting it onto the grid from our rooftop PV systems.
Since those fixed costs still need to be paid, rates go up, shifting costs onto the kWhs still being bought from the grid.
This will be less true for systems registered after last April when
compensation for new systems was made somewhat less generous, but that
applies to almost none of the systems installed before 2024, which are
the ones I am studying here.)
—
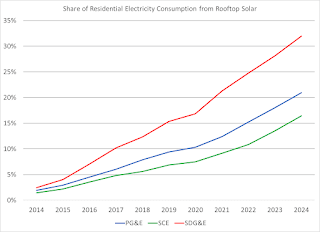
A decade ago, this was a small concern, because rooftop solar was
barely a blip in the total supply picture. In 2014, the homes served by
these three IOUs got less than 2% of their electricity off their roofs.
Today they get about 20%. As fewer kWhs are sold from the grid, retail
rates must rise even more in order to recover the fixed costs of the
system.
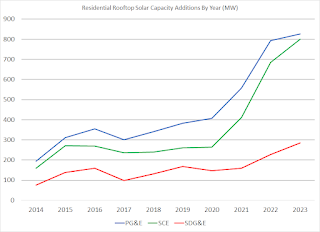
The problem has become particularly acute in the last four years.
During that time, solar capacity on houses has more than doubled at the
same time that the utilities’ fixed costs have escalated dramatically
due in large part to wildfires and the need for grid hardening against
them.
—
Figuring the rooftop solar cost shift
What has this done to rates? That takes a lot of calculations, which I
detail in the available data appendix. But it turns out that three
numbers are the major determinants: the total revenue the utility is
permitted to collect from residential customers to cover its operating
and fixed costs (known as the revenue requirement), the utility savings
from selling a customer fewer kWhs (known as the avoided cost), and the
amount of solar on rooftops that is leading to those lower sales.
Since 2020, the real (i.e., inflation-adjusted) revenue requirements
of the utilities have increased about 25% for residential customers and
rooftop solar has grown 114%, but the avoided cost from each kWh coming
off those panels has hardly changed. So, as higher and higher
electricity prices have meant customers would save more and more for
each solar panel installed, the system hasn’t been saving any more money
per panel when they do, and those extra costs have been shifted onto
customers who don’t have solar.
—
Compared to the case in which residential rooftop solar were treated
like actual producers and paid the competitive value of their
generation, my analysis concludes that PG&E residential customers
with solar in 2024 will shift slightly more than $2 billion of costs to
customers paying the utility for their power. For Southern California
Edison, it’s around $1.3 billion, and for SDG&E the cost shift will
be about $0.5 billion. My findings are largely in line with a separate analysis
done by the independent Public Advocates Office of the CPUC. (Their
headline number – $6.5 billion for the total cost shift – differs
largely because they include commercial and industrial (C&I)
customers’ solar, which makes up about one-third of distributed solar
capacity, and because I use a somewhat more generous avoided cost than
their analysis does.)
The cost shift impact on rates
While it might be tempting to compare these astonishing figures to
the revenues collected from residential customers, that would implicitly
assume that all of these costs are shifted onto the residential price
of electricity. In reality, some costs are shifted onto C&I
customers. How much? That’s hard to know. It depends on which costs are
allocated to specific customer classes (e.g., the cost of distribution
lines in residential neighborhoods) and which are considered systemwide
costs (e.g., the cost of billing systems, transmission lines, etc.).
One thing we do know is that residential rates have increased faster
than C&I rates in the last decade. In 2014, PG&E residential
rates averaged about 7% above C&I, but by 2024, they were 15%
higher. SCE went from a 15% differential to a 47% differential over the
same time period, while SDG&E’s differential jumped from 2% to
19%. This suggests that the costs that have been going up lately, and
the increasing cost shift from distributed solar, have been allocated in
higher proportion to residential customers. That’s not surprising given
that a lot of the cost increases in the last few years have been
defensive investments to harden distribution systems – which are
disproportionately associated with residential customers – and because
homes have two-thirds of the distributed solar.
To get a feel for the impact, let’s assume that 60%-80% of the cost
shift from residential solar goes onto the bills of other residential
customers. If so, then 5.7-7.0 cents of the price of each kWh (for
customers not on the CARE low-income rate), or 12%-15% of PG&E’s
full residential price in 2024, is due to the rooftop solar cost shift.
For SCE it is 3.2-4.0 cents or 9%-11% of the price. And for SDG&E it
is 7.4-8.8 cents or 19%-22% of the price.
In 2018, Lucas Davis wrote a blog post titled “Why Am I Paying $65/year for Your Solar Panels?” The question is still with us today, except now it’s more like “Why Am I Paying $300/year for Your Solar Panels?”
Getting to a sustainable energy system
I’m not presenting this analysis in order to demonize solar adopters
or to make them feel guilty about their choice. It’s not their
responsibility to do this sort of analysis. People are busy and utility
bills are a burden for many. I don’t blame them for jumping at an
opportunity to save money, without working through where those savings
come from. The problem is not in our household decision makers, but in
our policies. The 2023 change in how new solar installations are
compensated was a small step in the right direction, but not a solution.
Nor is the solar cost shift the only problem facing California’s electricity system. Adapting to increased wildfire risk and other impacts of climate change, challenges of maintaining reliability with increased renewables, dysfunctional regulation, inefficient utility operations, and excessive returns on capital investments
are all contributing to increased rates. All of these issues –
including the exploding solar cost shift – need honest discussions among
legislators and policymakers if California is going to successfully
navigate today’s unsustainable rate trends."
No comments:
Post a Comment
Note: Only a member of this blog may post a comment.
No comments:
Post a Comment
Note: Only a member of this blog may post a comment.