Evaluating the free market by comparing it to the alternatives (We don't need more regulations, We don't need more price controls, No Socialism in the courtroom, Hey, White House, leave us all alone)
Tuesday, June 7, 2022
Is Concentration Driving Inflation?
A recent Boston Fed policy brief argues it is. I'm not sure.
"A recent policy brief
from Falk Bräuning, José L. Fillat, and Gustavo Joaquim at the Boston
Fed examines the data and argues that concentration contributes to
inflation. The full research paper is coming soon.
Before
getting caught up in the commotion, let’s be clear about what the paper
claims to do. The paper’s punchline number is “pass-through becomes
about 25 percentage points greater when there is an increase in
concentration similar to the one observed since the beginning of this
century.”
25%. That’s a big number. Get base hits 25% of the
time, and you make it to Major League Baseball. But what does 25% mean
in this context?
Imagine an economy with the same levels of
concentration as the US had in 2005. Now imagine each industry
experiences a shock to their costs of production. For example, suppose
gasoline rises by $1. This magnitude doesn’t matter. Businesses will
pass through some of the cost increases in producer prices. So we are
very meticulous, and we tease out that the gas price generated 4% higher
producer prices. That’s called pass-through.
Now imagine
everything is the same except the economy has 2018 levels of
concentration, which everyone agrees are higher than 2005. The gasoline
price rises by $1 again, but now we see a 5% increase in producer
prices. We conclude that pass-through is 25% higher with the increased
concentration since 5% is 25% higher than 4%. They do fancier
econometrics but that’s the basic exercise as I read it. The authors
then conjecture that the same shock in 2021 would lead to a more than 5%
increase since they claim concentration increased from 2018 to 2021. We
will say more about the conjecture in a later section. Notice what the
paper does not do. It does not say inflation would have been 25% lower
in 2021 if concentration remained at 2005 levels. That’s a different
calculation.
With the meaning of the quantitative exercise straight, let’s assess the evidence.
First,
to be clear, I think this is an important topic and worthy of serious
analysis. It is a serious engagement by serious scholars, which is not
guaranteed in this hotly-debated area. I look forward to the full
research paper.
However, as is in this short brief, I have two
concerns with using this type of analysis for drawing conclusions about
the connection between concentration and inflation, especially the
inflation we’ve seen over the past year. First, industrial organization
economists (those who study concentration and competition full time)
have stopped doing the types of regressions used in the paper
(regressing prices on concentration). The regressions are too
problematic. Second, the data they use from Compustat, which is just
public firms, is not super helpful for telling us something about the
overall economy.
Economists are really interested in market power, which is often
defined as a firm’s ability to price above marginal cost. But market
power is notoriously difficult to measure. You need price and marginal
cost. So economists sometimes fall back on another option:
concentration.
At the most basic level, the Boston Fed
policy brief regresses producer price increases on a measure of
concentration. They focus on the Herfindahl-Hirschman Index (HHI)
of sales, but the exact index doesn’t matter. The important part is
that you are regressing a measure of prices on some concentration
measures.
The problem with such an approach, which
is well understood in industrial organization, is that the regression
basically has no meaning. Concentration (the thing we can measure) is
unrelated to the level of market power (the thing we care about). The
idea goes back to Harold Demsetz’s critique"
"As I’ve stressedmany times
in my research and the newsletter, the number of competitors does not
tell us much (anything?) about the level of competition in a market.
Remember that standard Bertrand competition has two competitors and is
still perfectly competitive; price equals marginal cost.
More recently than Demsetz, Chad Syverson argued in a famous JEP paper on markups,
Perhaps
the deepest conceptual problem with concentration as a measure of
market power is that it is an outcome, not an immutable core determinant
of how competitive an industry or market is… As a result,
concentration is worse than just a noisy barometer of market power.
Instead, we cannot even generally know which way the barometer is
oriented
This is not Syverson's (nor Conlon’s nor
Demsetz’s nor my) niche position. Nathan Miller, Steven Berry, Fiona
Scott Morton, Jonathan Baker, Timothy Bresnahan, Martin Gaynor, Richard
Gilbert, George Hay, Ginger Jin, Bruce Kobayashi, Francine Lafontaine,
James Levinsohn, Leslie Marx, John Mayo, Aviv Nevo, Ariel Pakes, Nancy
Rose, Daniel Rubinfeld, Steven Salop, Marius Schwartz, Katja Seim, Carl
Shapiro, Howard Shelanski, David Sibley, and Andrew Sweeting have a
paper arguing against using these regressions in the particular context
of mergers. (Yes, such a large, distinguished, and intellectually
diverse group all wrote a joint paper. That’s the level of agreement on
this.) As they put it,
The underlying problem with
regressions of price on the HHI is that the relationship between price
and the HHI is not causal. Instead, both are equilibrium outcomes that
are determined by demand, supply, and the factors that drive them. Thus,
a regression of price on the HHI does not show the sort of causal
effect that would be helpful in predicting the competitive effects of a
merger.
The argument applies beyond mergers though.
Regressing the price on HHI is not causal. The authors are aware of this
issue. That’s why they use an instrument, called a “granular
instrumental variable”, to try to account for endogeneity issues so they
can claim causality. I’m skeptical that solves the deep issue but I
will wait for the full paper.
You’ll often hear “the stock market isn’t the economy.”
Yet, the authors, like so many before them, use data on publicly traded
firms to draw conclusions about the overall economy. The reason people
use data on publicly traded firms is that it is easily available through
Compustat, which is a newly popular data source in macroeconomics.
The
problem isn’t that the stock market/Compustat doesn’t cover the whole
economy. After all, the authors point out that Compustat accounts for
53% of sales in the overall economy. It’s not everything. That would be
okay if the firms in the data were a random sample of all firms.
If
Compustat was even just a biased set of firms, there would be easy ways
to deal with that. You just acknowledge that it oversamples large
firms, for example, and take differences to correct for that. NBD.
Unfortunately,
Compustat is not a random sample or even a consistent sample; the
publicly traded firms in Compustat vary from other firms in all sorts of
ways. The difference between public and private firms is changing over
time in lots of subtle ways that we still don’t fully understand. For
example, Davis, Haltiwanger, Jarmin, and Miranda (2007) show that private firms have been becoming less dynamic over the past few decades while public firms have become more dynamic. Decker, Haltiwanger, Jarmin, and Miranda (2016)
show that trend changed post-2000. For our purposes, the important part
isn’t their exact results on dynamism; what matters is that the firms
that choose to go public and stay public at a later time are different
from the private firms. And the way they differ depends on whether we’re
talking about 1990, 2000, 2010, or 2020.
Forget private vs. public for a second. We know that the makeup of businesses is changing over time. Krupkin and Looney
show how business income overall has shifted from C-corps to
pass-throughs, such as partnerships. If we imagine that public firms
correspond with C-corps (they don’t but the categories are related),
there’s further reason to believe public firms look less and less like
the overall economy over time.
Given the constantly changing relationship between public and
private firms, it would be an amazing coincidence if Compustat gave us
consistent measures of concentration. But, again, we know it doesn’t. In
a 2008 paper, Ashiq Ali, Sandy Klasa, and Eric Yeung show that
Industry
concentration measures calculated with Compustat data, which cover only
the public firms in an industry, are poor proxies for actual industry
concentration. These measures have correlations of only 13% with the
corresponding U.S. Census measures, which are based on all public and
private firms in an industry.
Later papers with more recent Census data confirm the basic takeaway.
Even
more recently, in this same general discussion surrounding
concentration and inflation, we’ve seen that using Compustat data can
get the sign wrong!
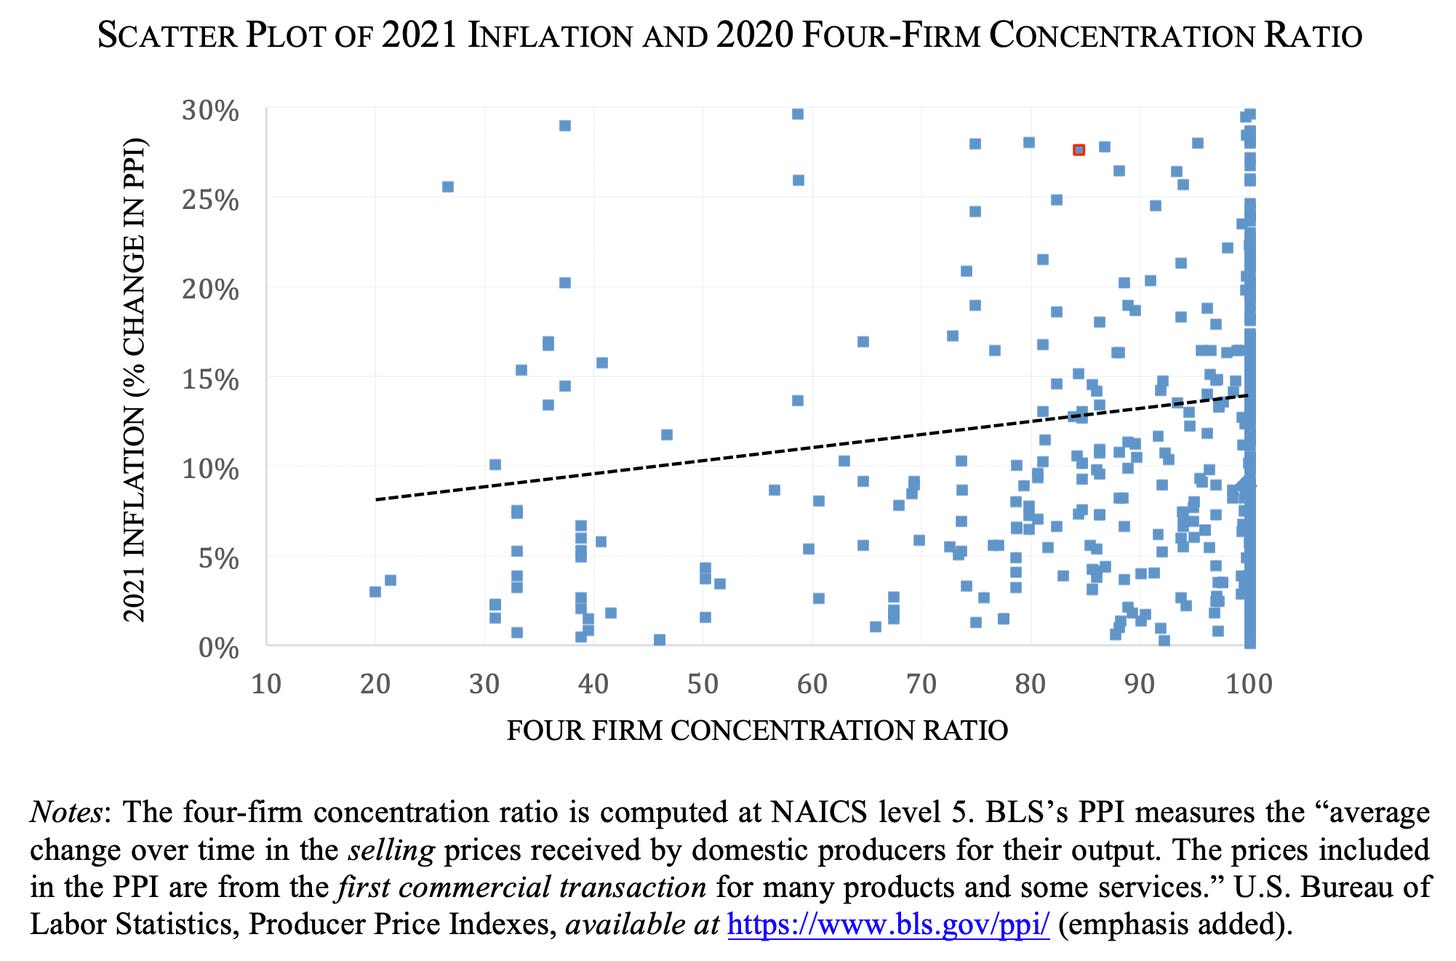
Take a chart from Hal Singer’s testimony
in front of Congress on the role of concentration and inflation that
sparked much of the recent debate. Using Compustat firms, Singer shows a
positive correlation between concentration levels and inflation. Let’s
ignore the fact that we are using four-firm concentration ratios in a
dataset where many industries (defined at the 5-digit NAICS level) have
four or fewer firms. Let’s assume this is the right concentration ratio
to look at.
Compare
Compustat with Census data, which is the best data available and covers
all firms but is only available up to 2017. When you run the same
correlation, the sign flips! Higher concentration is correlated with
less inflation. the correlation goes the opposite direction! (This is
assuming regressing prices on concentration is meaningful. It’s not.)
Beyond issues with Compustat, the authors make other data choices that readers should be aware of. The authors explain
To
guarantee that our data are representative of the underlying market
structure in a given industry, we exclude from our regression analysis
industries that have fewer than two firms in Compustat at any moment in
our sample and retail industries (NAICS 44/45).
Guarantee is a strong word. A real Chad move. I respect that.
Because
there are so few firms in many Compustat industries, they have to drop
some. That happens. We all do it. They also drop retail, all of it. They
explain why in a footnote: “We exclude retail industries because they
have a small number of firms in Compustat and because regional
concentration is more important than total industry-level
concentration”. I don’t want to question every data decision. We all
have to make choices. But I feel like commentators should be aware that
they are talking about inflation but excluding retail. Is that what you
mean by inflation?
Suppose I accept their analysis of the 2005-2017 period, a period of low inflation.
Can
we extrapolate to the inflation we’ve seen in the past year? That is
the impression on Twitter. The authors suggest so as well: “Industry
concentration has increased significantly in the United States in the
past 20 years, and this trend has accelerated since the onset of the
COVID-19 pandemic.” But remember, they show concentration has risen in
Compustat. And we know the issues with Compustat.
Unfortunately, we have no way of knowing what has happened to concentration in the economy as a whole since 2020.
What we do know about the changes from 2020 to 2021 seems to contradict the claim about further rising concentration. A Fed note by Ryan Decker and John Haltiwanger
looks at employment changes from March 2020 to March 2021. It’s not
sales or product market concentration but surely it’s related. If big
firms are growing, I’d expect concentration to rise. That’s not what we
see. Decker and Haltiwanger show an increase in employment among small firms, not among the big firms.
Again, we simply do not know what has happened to economy-wide
concentration since March 2020. As a theorist, I always just thought
data was everywhere. Just go to some website and you get the data. I
don’t know how these things work. Decker and Haltiwanger explain:
A
key challenge for economic analysts during the pandemic has been the
substantial lag with which official data on business entry and exit are
released. Data on the entry and exit of establishments—that
is, single operating locations of potentially larger businesses—are
released by the BLS with a lag of about three quarters. Data on the
entry and exit of firms—that is, collections of
one or more establishments under common ownership or control—are
released by the Census Bureau with a lag measured in years
For
any theory of inflation in the past year to be coherent, you need
concentration to rise. So even if concentration caused inflation from
2005 to 2017, we can’t say the same for 2021-2022. Static concentration
(regardless of how high it is) cannot explain an increase in inflation.
I guess it’s theoretically possible that small firms grew from March
2020 to March 2021 and then that reversed from March 2021 to March 2022,
exactly when we had more inflation. The problem? We don’t know that. It
is pure speculation.
I guess you could spin yourself into a knot
by relying on the idea within monetary economics of the “long and
variable lag”. Maybe increases in concentration in 2010 caused—with a
long and variable lag—2021 inflation. I don’t think that’s what Friedman
meant.
Given the data and theoretical issues I pointed out in
this newsletter, it’s not quite the victory lap that people on Twitter
want to believe it is. That’s fine. Each of these policy briefs is meant
to be one piece in a much larger picture that informs the Fed’s
decisions."
No comments:
Post a Comment
Note: Only a member of this blog may post a comment.
No comments:
Post a Comment
Note: Only a member of this blog may post a comment.