Evaluating the free market by comparing it to the alternatives (We don't need more regulations, We don't need more price controls, No Socialism in the courtroom, Hey, White House, leave us all alone)
"In the United States, it is conventional wisdom that wages have stagnated for decades.
A few examples to illustrate the point: In a recent story in “The New
York Times’s” Business section, an article began with this statement:
“One of the most urgent questions in economics is why pay for
middle-income workers has increased only slightly since the 1970s, even
as pay for those near the top has escalated” (Scheiber, 2021).
Conservative commentator David Brooks declared in 2017 that
“middle-class wage stagnation is the biggest economic fact driving
American politics.” A 2018 analysis by the Pew Research Center had this
headline: “For most U.S. workers, real wages have barely budged in
decades.” Populist politicians on the political right and progressives
on the political left share this view, as well.
Many economists agree. Economists assume wage stagnation as a fact in
commentary written for the public (e.g., Krugman, 2021; Stiglitz, 2020)
and in academic and policy papers (e.g., Azar et. al, 2020; Hoynes and
Rothstein, 2019; Sachs et. al, 2015; Benmelech et. al, 2022; Benmelech
et. al, 2019).
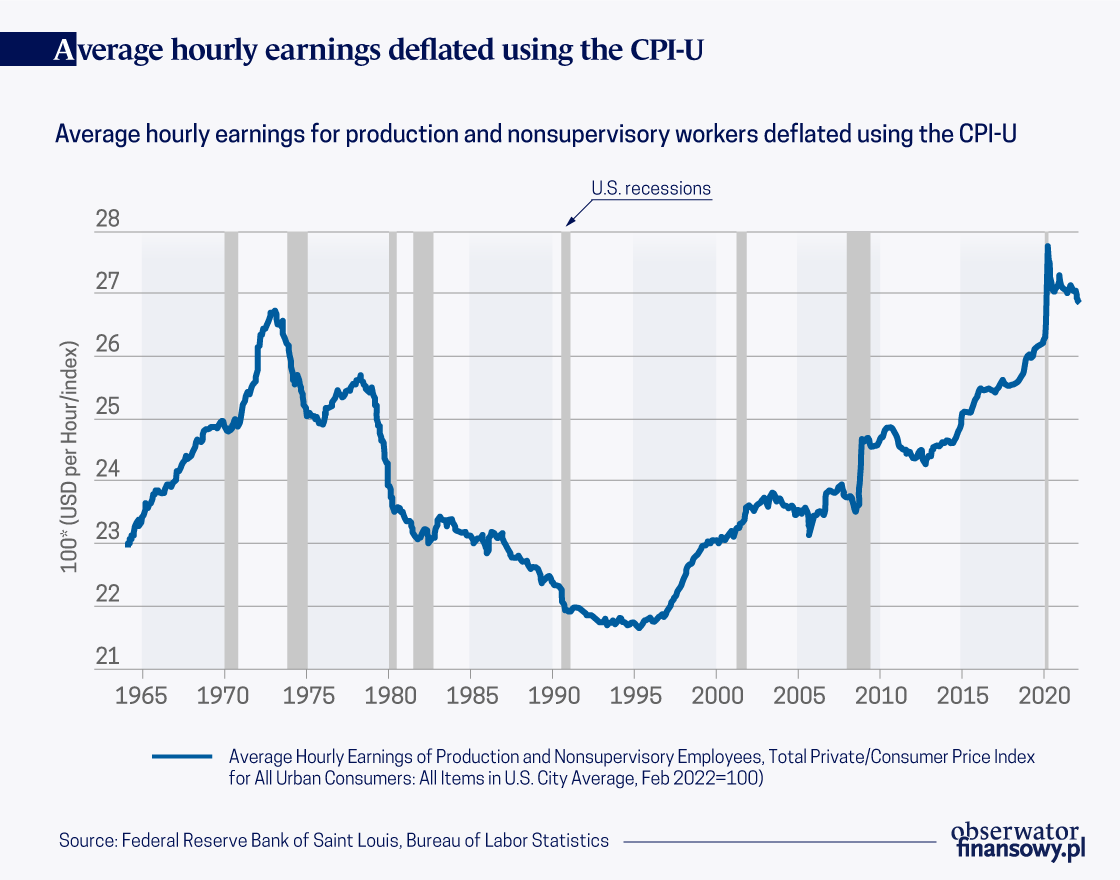
This view has empirical support. See the growth of inflation-adjusted
average wages for production and nonsupervisory workers, shown in
Figure 1. A startling fact is that average real wages have grown by only
0.7 percent over the half century beginning in February 1973. In
February 2022 dollars, wages have grown over this period by $0.18. There
is no question that an $0.18 increase over a half century is correctly
interpreted as stagnant.
Selecting the base year
Many descriptions of U.S. wage stagnation begin in 1973 (or 1979)
because that was the previous peak in the series, the rapid growth in
inequality that began around that time, and due to perceived shifts in
the economy during the 1980s away from organized labor and towards
a greater emphasis on economic efficiency (e.g., Mishel et. al, 2015).
The starting year for wage growth calculations is crucially
important, but has received relatively little attention in the academic
and policy debates around wage stagnation. See my recent bookOpens in new window, for more detailed discussion of this issue.
Calculating wage growth using 1973 (or 1979) as a base year
mechanically produces smaller growth magnitudes because 1973 was
a previous peak of the series and because 1978/1979 was a local maximum
of the series.
A quick glance at Figure 1 — which contains the full available time
series for average hourly earnings for production and nonsupervisory
workers — does not lead one to conclude that 1973 is the obvious base
year for economists or analysts to choose. The year the series begins,
1964, might be more natural. With that as the base year, wages have
grown by 17 percent. That may still be interpreted as stagnant, but
still much faster than growth calculated from 1973.
In Strain (2020), I make several arguments that — at least for the
purpose of the policy debate — July 1990 is a sensible base period.
First, I argue that when political leaders and political leaders argue
that “wages have been stagnant for decades,” many people hear that as
referring to their own wages. But 1973 was a half century ago. Choosing
a more recent base year is more sensible, and even one three decades ago
may be too far in the past because it would apply to too few current
workers. Second, July 1990 was a business cycle peak, which helps to
avoid overstating wage growth by estimating it from a trough.
The third reason I argue in Strain (2020) for 1990 as the base year
rests on the fact that the U.S. experienced two decades of stagnating –
actually, declining – average real wage growth, beginning in the early
1970s and ending in the early 1990s. Averaging wage growth from that
period with the decades that followed – i.e., averaging economic
outcomes from two different economic regimes – arguably distorts our
understanding of wage growth over time. Finally, the earlier the base
year, the harder it is to adequately adjust for inflation. Measuring
changes in a typical consumption bundle from 1990 to 2022 is challenging
enough given quality improvements in continuing products and the vast
number of new goods and services that have entered the typical bundle
during that period. Going back a half century is even harder, still.
Selecting the price index
In addition to selecting the base year, the issue of inflation
adjustment is of first-order importance. So far, I have been using the
consumer price index, which is arguably the most prominent measure of
inflation. There is widespread recognition that the headline CPI may
overstate the rate of inflation, particularly over longer periods of
time (Boskin et. al, 1998; Broda et. al, 2009). Given that, many
economists use a CPI research series (known as the CPI-U-RS) that
attempts to account for some of these issues, though the CPI-U-RS does
not deal adequately with substitution bias over the periods of time in
question (Moulton, 2018).
An alternative to the CPI is the personal consumption expenditure
price index (PCE). There are numerous technical differences between the
two indices, and each has strengths and weaknesses. The CPI is
specifically designed to capture price changes in a typical consumption
bundle, whereas the PCE includes all expenditures made for consumption,
including those made by third parties (e.g., employer-provided health
insurance premiums). The CPI focuses on urban consumers, while the PCE
tries to capture all consumers, and does a better job capturing price
changes faced by rural populations.
The most important advantage of the PCE is its more realistic
treatment of consumer substitution across goods in response to price
changes. For example, if the prices of strawberries goes up, consumers
will buy fewer strawberries and more raspberries. Because of the PCE’s
ability to better capture this type of substitution, it is the measure
used by the nonpartisan Congressional Budget Office when analyzing
trends in wages over time. The PCE is also the Federal Reserve’s
preferred measure of consumer price inflation (though of course the Fed
studies many measures of price changes across several distinct markets,
including consumer goods and services).
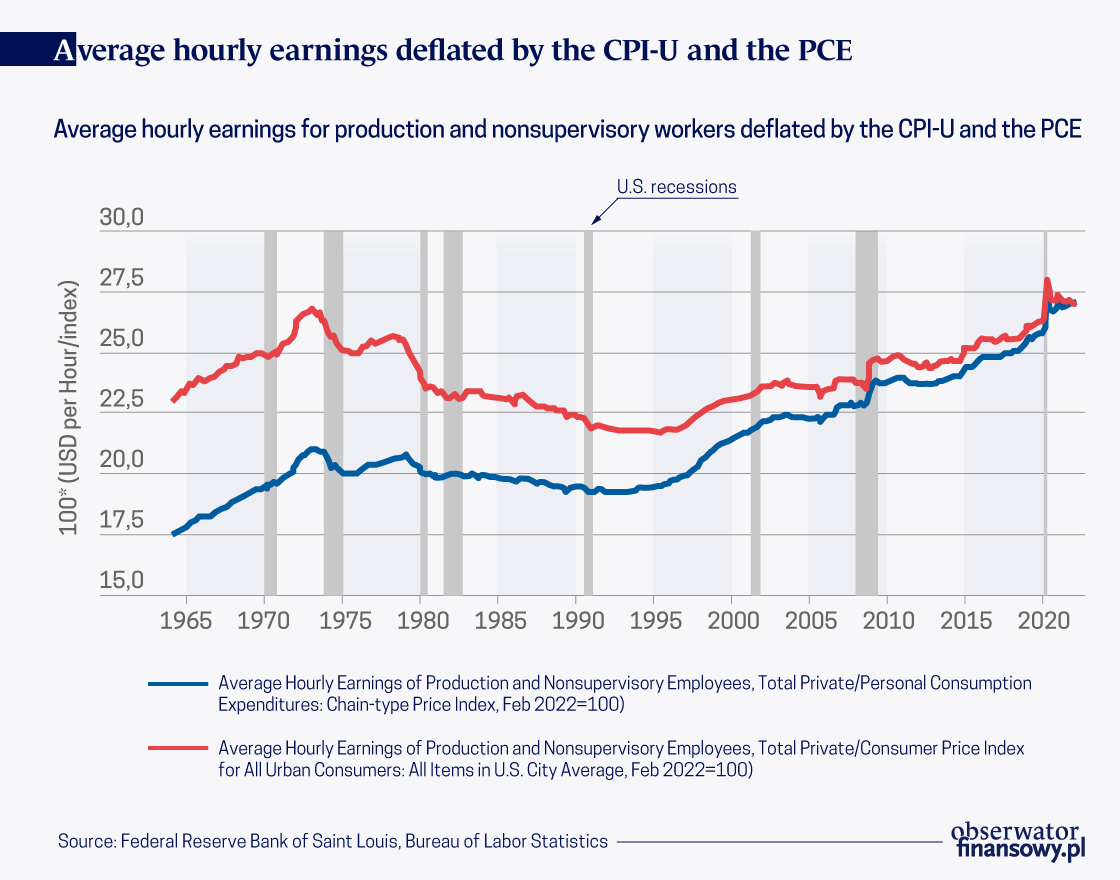
Because the CPI overstates inflation, calculations using the CPI for
inflation adjustment understate real wage growth. Figure 2 shows two
series for the average real wage for production and nonsupervisory
workers. One is deflated by the CPI and one by the PCE. Both are
expressed in February 2022 dollars, so the closer the series is to
February 2022 the closer real wages are to nominal wages.
The presentation in Figure 2 highlights how conclusions —
quantitative, but perhaps also qualitative — are driven in part by the
choice of price index, and how the further in the past the base year,
the larger the role the choice of price index plays.
Have wages stagnated for decades?
Using July 1990 as the base period, average real wages using the CPI
grew by 21 percent over the three-decade period ending in February 2022.
Real wages grew by 39 percent using the PCE.
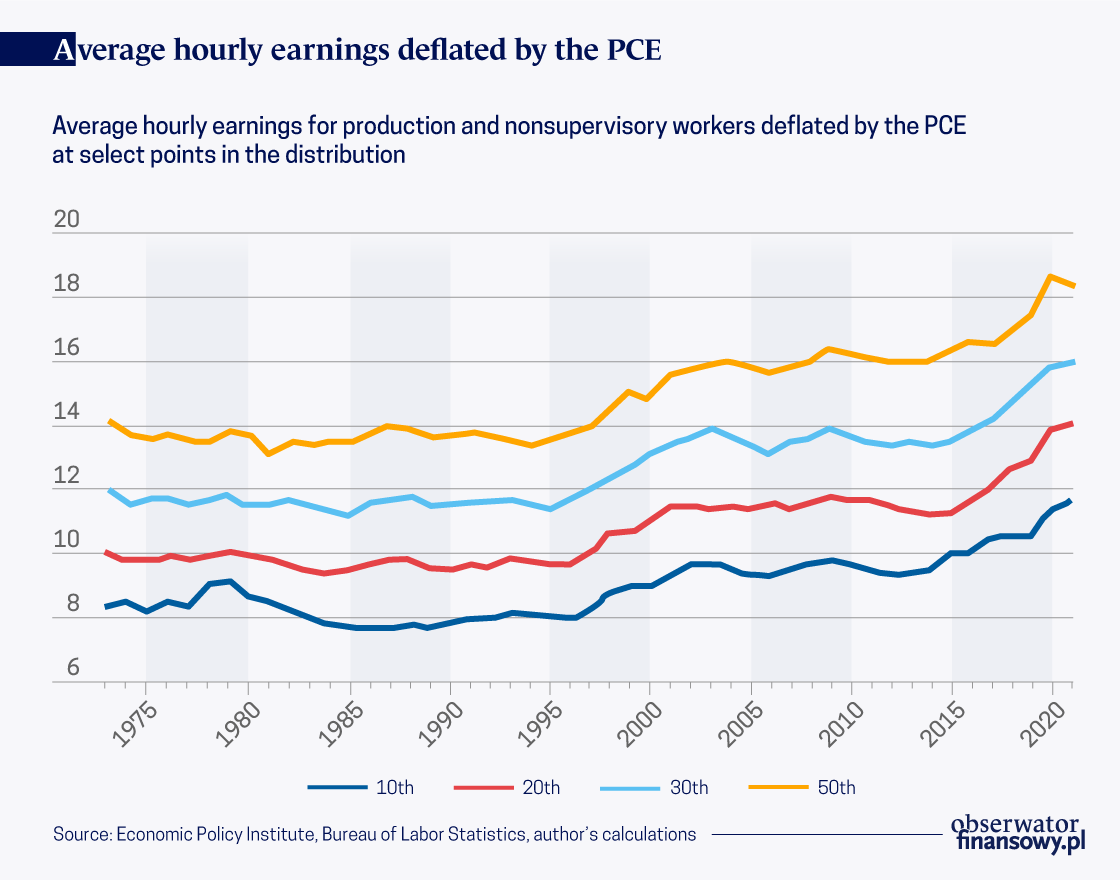
So far, I have been discussing average wages. Because the analysis
has focused on production and nonsupervisory workers — workers who are
not managers, roughly speaking — there is less reason than usual to be
concerned that average wages produce a distorted picture of what is
happening to “typical” workers because of growing inequality. Still,
some concern may remain. Figure 3 shows real wage growth for the median
worker and at other points in the distribution.
Since 1990, real median wages grew by 34 percent. Real wages at the
tenth, twentieth, and thirtieth percentiles grew over this period by 50,
48, and 38 percent, respectively.
The ubiquity of 1973 might argue for economists and analysts to adopt
a new standard base year. But it would be better still for scholars and
commentators to take a more nuanced approached when describing wage
growth over time. Wage trends over the past half century are too nuanced
to be succinctly summarized without considering the 1970s and 1980s
separately from the three decades that followed.
Thirty-nine percent growth in average wages over the past three
decades (and 34 percent median wage growth) is slower than wage growth
at the top of the distribution. But given the choice between “stagnant”
or “not stagnant,” the latter is the more accurate characterization.
A 39 percent increase in purchasing power is a significant increase.
My characterization of wage growth over this period would be “solid, but
not spectacular.” Of course, policy should not be content with this
pace of growth. It is not “fast enough.” Policymakers should focus on
policies to boost productivity, which will quicken the pace of wage
growth, along with measures to increase competition in the labor market."
No comments:
Post a Comment
Note: Only a member of this blog may post a comment.
No comments:
Post a Comment
Note: Only a member of this blog may post a comment.