Evaluating the free market by comparing it to the alternatives (We don't need more regulations, We don't need more price controls, No Socialism in the courtroom, Hey, White House, leave us all alone)
Sunday, January 22, 2023
Evidence that Economic Freedom Improves Outcomes
By Antony Davies. He is a professor of economics at Duquesne University.
"The latest Economic Freedom of North America report issued
by the Fraser Institute marks the first time economists have had a full
four decades’ worth of data on economic freedom across the fifty United
States. Those less familiar with economic research claim that economics
isn’t a science because economists can’t conduct controlled experiments.
Yet where economists can’t conduct controlled experiments (behavioral
economists do conduct controlled experiments), they employ complicated
statistical techniques to compensate for the fact that they must take
data as they come. Here, the Fraser Institute has
given economists a treasure-trove of data that provide insight into the
effect of larger and smaller government footprints among the states’
economies.
Economic freedom is not the same as less government. In fact, in many
cases, improved economic freedom requires more government. Economic
freedom is rather “right government,” government that, as Thomas
Jefferson put it in his first inaugural address,
would “restrain (people) from injuring one another, (but) shall leave
them otherwise free to regulate their own pursuits...” Societies are
more economically free when their governments prevent people from
harming each other, whether by violence, theft, fraud, defamation,
pollution, or any of the many other ways the more powerful manage to
exploit the less. But societies are also more economically free when
their governments otherwise leave people and businesses alone to make
decisions for themselves. Exploitation is as anathema to economic
freedom as is the nanny state.
There is no perfect way to measure economic freedom, as is often the
case, so economists must settle for reasonable measures. Fraser has
constructed a quasi-objective measure of economic freedom. The “quasi”
part comes from the fact that Frasier’s researchers had to decide what
metrics were consistent with the idea of economic freedom. The
“objective” part is that government agencies put numbers to the metrics.
In calculating an Economic Freedom index for each state, Fraser
combines state and local government spending, government transfers and
subsidies, state pension payments, tax rates and brackets, the minimum
wage relative to average income, and government employment. Fraser
simply averages its metrics together and puts the result on a scale from
0 (least free) to 10 (most free). Reasonable people can argue that some
metrics should be weighted more than others, but Fraser tries to keep
its researchers’ opinions out of the equation by taking simple averages.
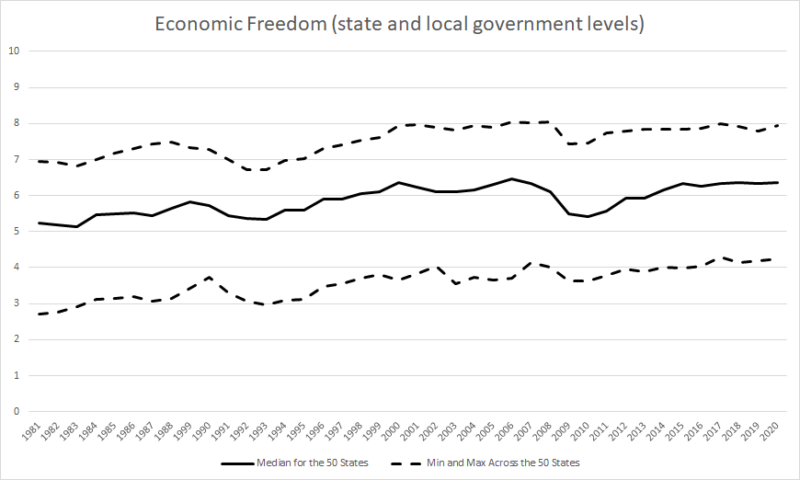
As of 2020, the last year for which Fraser has performed the
calculations, economic freedom among the fifty states has ranged from a
low of 4.3 (New York) to a high of 7.9 (Florida). On the whole, economic
freedom among the states has risen over the decades from a median of
5.2 in 1981 to almost 6.4 in 2020. That’s a remarkable improvement. Even
New York State, the least free state in the union, has raised its score
from 2.7 in 1981.
Data source: Fraser Institute.
It’s reasonable to assume that small states would be more
economically free because small states don’t require the massive
government spending on infrastructure and social welfare programs that
come with large populations and more complex economies. Yet, economic
freedom scores don’t follow a pattern according to state size.
Two of the most economically free states, Florida and New Hampshire,
are at opposite ends of the size spectrum. Florida is the third-largest
state by population and fourth by economy. New Hampshire is the
42nd-largest by population and 40th by economy. So too, two of the
least-free states, New York and Vermont, are of opposite sizes. New York
is the fourth-largest state by population and third-largest by economy.
Vermont is the third-smallest by population and second-smallest by
economy.
But economic freedom does follow a consistent pattern when it comes
to socioeconomic outcomes. This pattern becomes clear when, for each
year, we divide the states into two groups according to the median
economic freedom score in that year. For each year from 1981 through
2020, let’s call the 25 states that scored above the median, the “more
free” states for that year, and the 25 that scored below the median, the
“less free.” So divided, we can compare in each year economic measures
that matter the most to people: unemployment, poverty, income, and
income inequality.
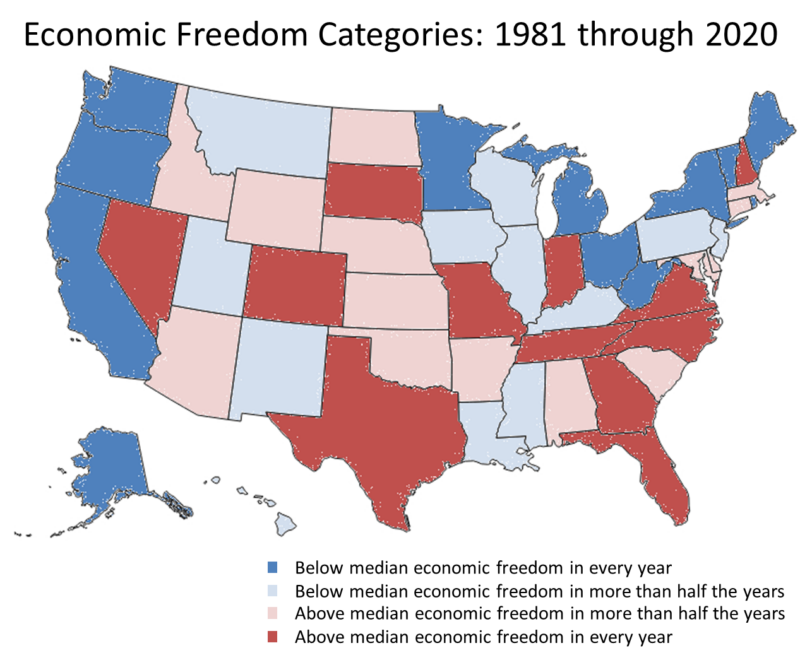
From 1981 through 2020, one-quarter of the fifty states (Florida, New
Hampshire, South Dakota, Texas, Tennessee, Virginia, Georgia, North
Carolina, Idaho, Indiana, Missouri, and Colorado) appeared among the 25
more free states every year. Over that same period, one-quarter of the
states (New York, California, Vermont, Oregon, Maine, West Virginia,
Rhode Island, Alaska, Minnesota, Ohio, Michigan, and Washington)
appeared among the 25 less free states every year. The remaining half of
the states moved back and forth between the two groups, ranking among
the more-free states in some years and among the less-free in other
years.
Data source: Fraser Institute.
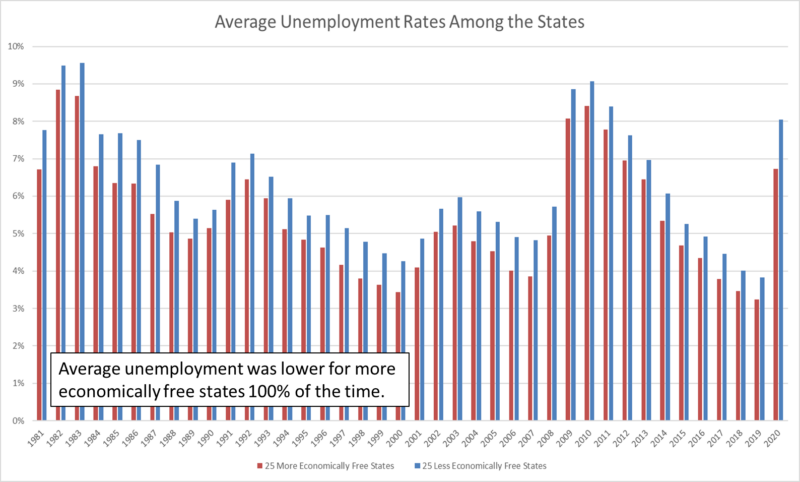
Consider unemployment rates across the states. In 1981, for example,
the average unemployment rate among the 25 states in the “less free”
category was 7.8 percent. That same year, the average unemployment rate
among the 25 states in the “more free” category was 6.7 percent. In
1982, the average unemployment rate for the less free states was 9.5
percent versus 8.8 percent for the more free states.
In each year of the past four decades, the less-free states in a
given year had an average unemployment rate that exceeded that of the
more-free states in that same year. From 1981 through 2020, average
unemployment was almost a full percentage point lower in the more-free
states. For four decades, we’ve seen solid evidence that more economic
freedom and lower unemployment rates go together.
Data sources: Fraser Institute, Bureau of Labor Statistics.
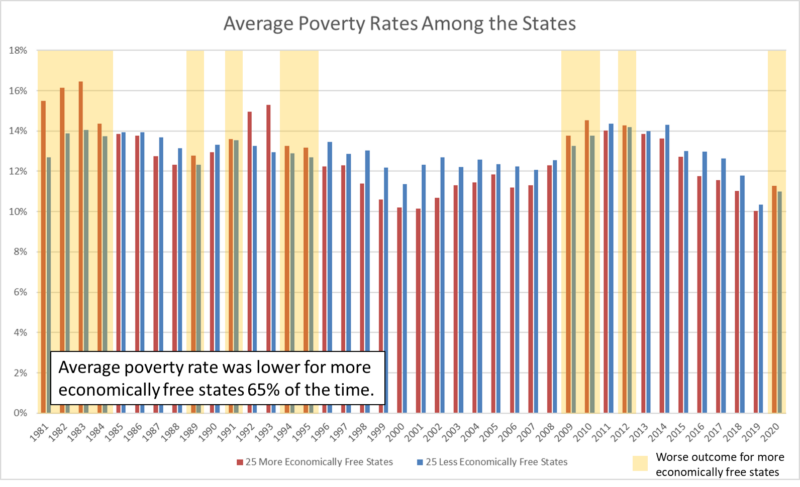
From 1981 through 2020, the average poverty rate across states was
lower among the more-free states 65 percent of the time. Median
household income was higher among the more-free states 60 percent of the
time. And when we adjust household incomes to account for differences
in the costs of living across the states (cross-state cost of living
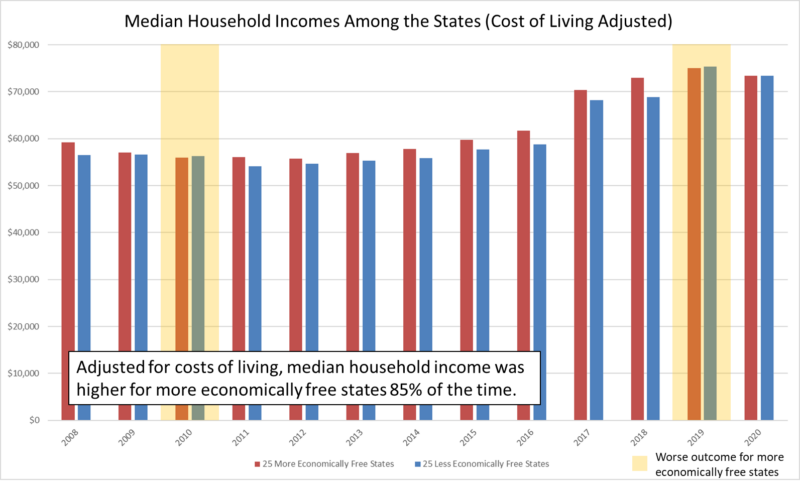
adjustments only go back to 2008), the more-free states showed higher
average household purchasing power 85 percent of the time.
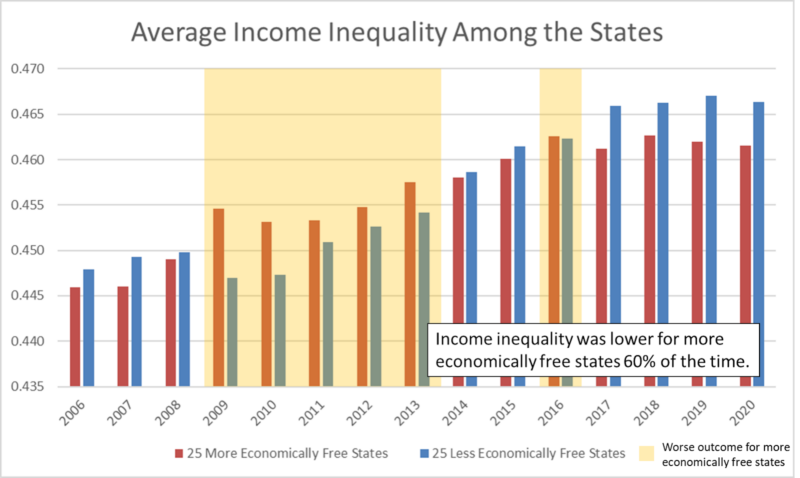
Interestingly, income inequality (for which data also only go back to
2008) was lower for the more-free states 60 percent of the time.
Data sources: Fraser Institute, US Census Bureau.
Data sources: Fraser Institute, US Census Bureau, Bureau of Economic Analysis.
Data sources: Fraser Institute, US Census Bureau.
While these results may come as news to non-economists, they aren’t
to economists who study economic freedom, because the same pattern
repeats whether we’re comparing states or cities or countries. When
comparing countries, the evidence becomes richer still as more-free
countries exhibit lower child labor rates, more gender equality, and
better environmental outcomes. And this isn’t a “rich” country effect,
because the same pattern emerges when comparing poor-and-more-free
countries to poor-and-less-free countries.
Of course, the data only show correlations, and correlation isn’t causation. But, the absence of correlation is the
absence of causation. And nowhere do we see a correlation between less
economic freedom and better outcomes. That is, we have evidence that
less economic freedom does not cause better outcomes.
The sad irony is that, when faced with unemployment, poverty, and
inequality, voters most often ask what the government can do to mitigate
these problems. But the data suggest that, just as often, voters should
be asking what the government can stop doing that is exacerbating these
problems.
The four most recent decades of evidence support the claim that
Thomas Jefferson made twenty-two decades ago: societies achieve the best
outcomes when their governments prevent people from harming each other,
but otherwise leave them alone."
No comments:
Post a Comment
Note: Only a member of this blog may post a comment.
No comments:
Post a Comment
Note: Only a member of this blog may post a comment.