By Andrew Wilford & Evelyn Kilty of The National Taxpayers Union.
The IRS recently released the latest installment of tax migration statistics, comparing 2019 with 2020. As with past installments of this data, it clearly shows that taxpayers are fleeing high tax states for greener pastures.
Last fall, NTUF examined tax migration statistics from the perspective of state and local tax (SALT) deductions, showcasing how, with capped SALT deduction, taxpayers in high-tax states experience more of the bite of their state’s tax policies.
But while that year’s dataset was notable for representing the first year of tax data in the aftermath of capping of the SALT deduction, the new data represents the last full year before the pandemic hit.[1]This report represents data from beforethe pandemic which pushed a sizable number of American workers remote, allowing them greater freedom of movement.
In the months following the beginning of the pandemic, the scale of remote work grew rapidly, with the percentage of American workers working from home at least 20 days a month jumping from 5 percent in 2019 to 22 percent in the summer of 2020. Though remote work has since cooled off somewhat, it is nonetheless safe to say that the pandemic has increased the flexibility of many workers’ work arrangements. After all, even for workers who have since returned to in-person work, remote work is far more easily attainable should they wish it.
These facts make the enormous net shifts in taxpayers and income from high-tax to low-tax states described below even more stark, as they make clear that a state’s tax rates are an important factor in residency decisions for many taxpayers. As work flexibility increases, so too will taxpayers’ ability to decide where they want to live — and the greater the pressure on states will be to make their tax codes competitive.
Taxes Matter to Taxpayers
IRS migration data shows how many taxpayers move to and from each state between two given years of tax returns, examining the inflow and outflow of the number of tax returns, individuals, and Adjusted Gross Income (AGI). The data represents net changes in domestic migration statistics, excluding immigration and emigration to and from different countries.
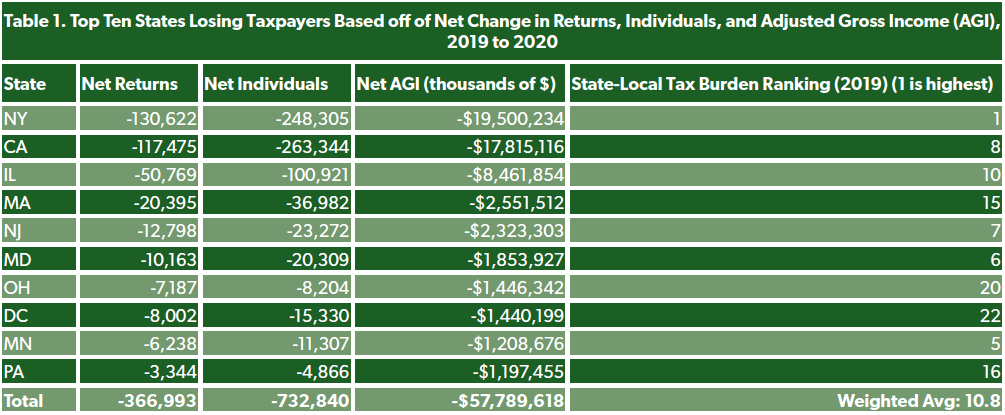
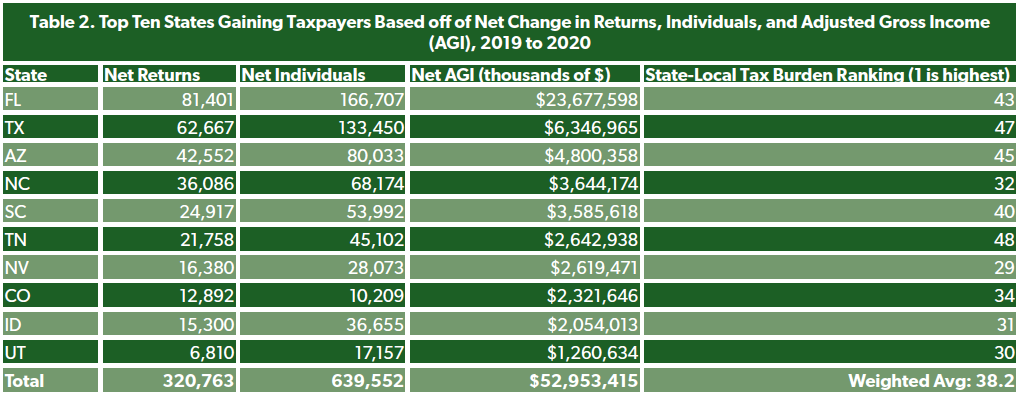
Tables 1 and 2 below list the top ten states losing and gaining taxpayers and income, respectively. They also include each state’s ranking in Tax Foundation’s 2019 state-local tax burdens report, with the first-ranked state, New York, being the state with the highest state-local tax burden in the country.
This dataset makes clear that, as a general principle, taxpayers prefer to move to states with lower tax burdens and away from states with higher tax burdens. Right from the start, the three states losing the most taxpayers and income–New York, California, and Illinois–are the three largest high-tax states. The top two states gaining taxpayers and income, Florida and Texas, are the two largest low-tax states (Arizona, though it does not have this reputation to the same extent, still enjoys a below-average tax burden).
The top ten states gaining taxpayers acquired a net total of 321,000 households and $53 billion in AGI. On the other hand, the top ten states losing taxpayer dollars lost a net total of nearly 367,000 households and $58 billion in AGI.
All told, the top ten states losing the most income had a weighted average of about the 11th-highest tax burden in the country that year, according to Tax Foundation statistics. The top ten states gaining the most income, on the other hand, had a weighted average of about the 38th-highest (or the 12th-lowest) tax burden in the country.
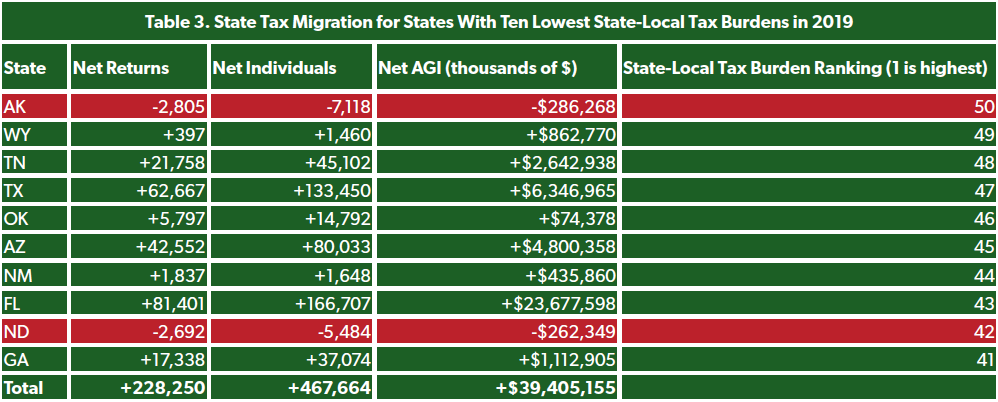
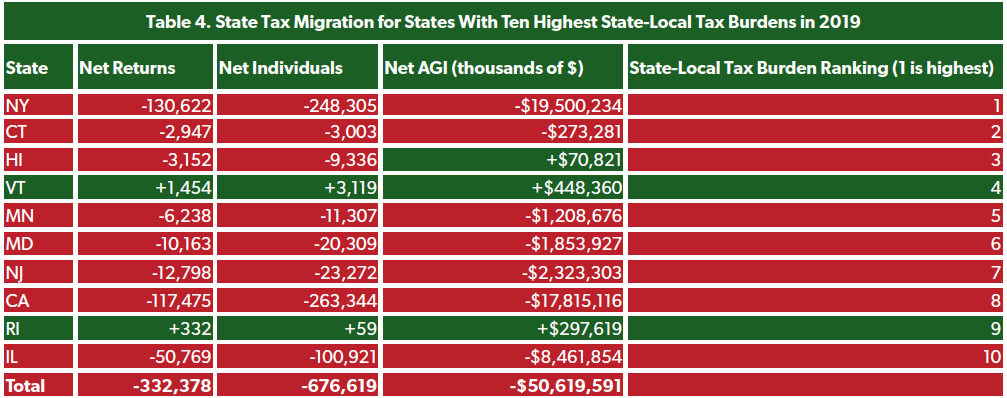
The contrast is just as clear when looking at the top ten states with the greatest tax burdens versus the ten states with the lowest tax burdens. The ten states with the lowest tax burdens gained a net total of 228,000 households and $39.4 billion in AGI, while the ten states with the highest tax burdens lost a net total of 332,000 households and $50.6 billion in AGI as demonstrated by Tables 3 and 4 below.
Additionally, states with distinct advantages to their tax systems tend to gain taxpayers. Florida, Nevada, Texas, and Tennessee all have no individual income tax and all appear in the top 10 states gaining taxpayers. Meanwhile, every state in the top ten tax migration losers levies an individual income or sales tax.
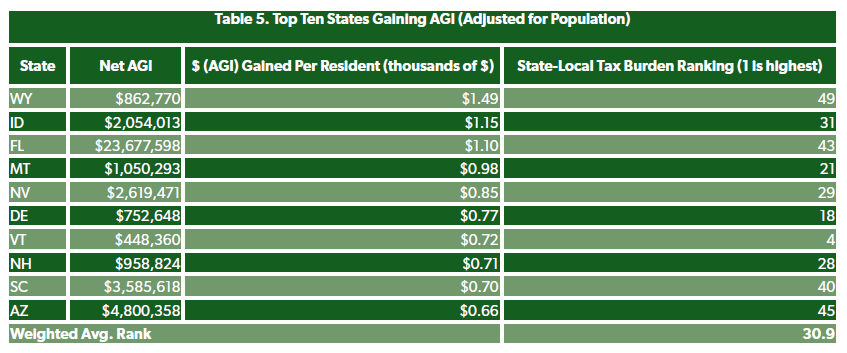
Table 5 shows that, adjusting for population sizes, other states without individual income taxes like Nevada, New Hampshire, and Wyoming join the top ten winners of tax migration. States with no sales taxes are all among the smallest states in the country, but adjusting for population size, three of the five states without a sales tax appear in the top ten winners: Montana, New Hampshire, and Delaware. Another, Alaska, actually appears in the top ten losers on a per capita basis, but while Alaska has no statewide sales tax, local jurisdictions do levy sales taxes.
The Impact of Other Taxes
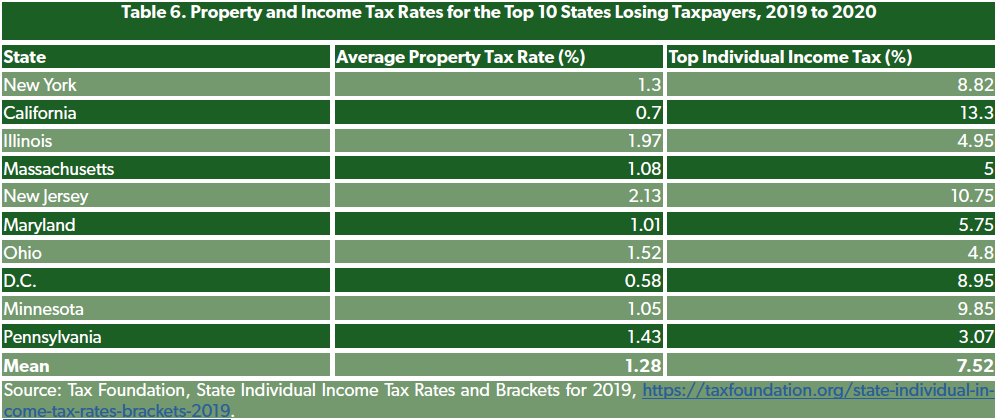
Among the states losing taxpayers, Ohio and Pennsylvania have lower combined state-local tax burdens (10.3 percent and 10.4 percent respectively) than other states, but still lost over $1 billion each in AGI. High property taxes strongly suggest a reason for this loss. The average property tax for these top ten states losing taxpayers is 1.28 percent. Ohio’s property tax averages 1.52 percent, higher than most states. According to the Tax Foundation’s property tax rankings, Pennsylvania also has a high property tax of 1.43 percent, ranking 16th out of 50 in 2019. Illinois and New Jersey’s inclusion in the top five tax migration losers also supports this notion, with the states having the highest average property tax rates in the country at 2.13 and 1.97 percent, respectively.
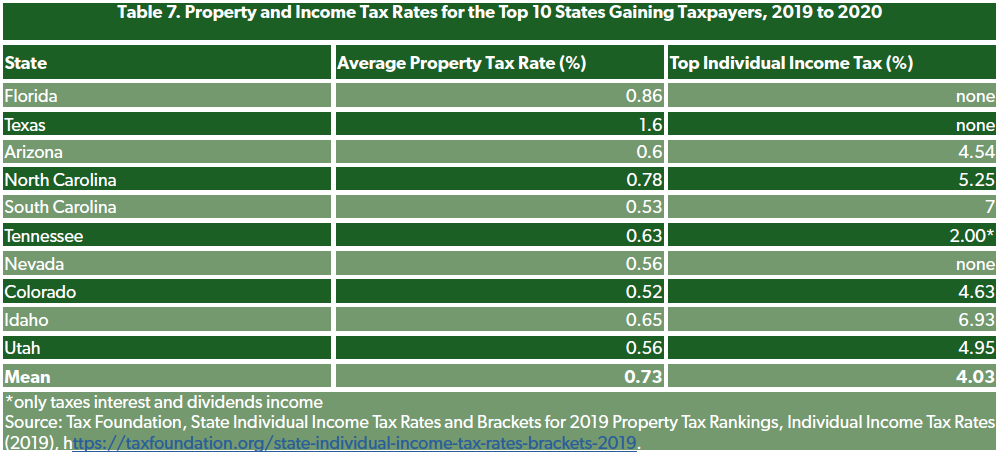
Just as taxpayers are fleeing states with high property taxes, so too are they flocking towards states with low property tax rates. The average property tax for the group of states gaining taxpayers is 0.73 percent as demonstrated in Table 7 below. This is 55 percent lower than the top ten states losing taxpayers. Colorado’s average property tax in 2019 was 0.52 percent, while Illinois’s average property tax is almost four times higher at 1.97 percent. Relative to Illinois’ average of $4,400 paid in property taxes, the average Coloradan pays a mere $1,756, a net savings of $2,644 annually in property taxes.
However, low property taxes are not the only possibility for tax migration to these 10 states. According to the IRS data, Texas gained over $6 billion in net AGI alone while still having one of the worst average property taxes in the country at 1.6 percent. At first place on the list, Florida also has a fairly significant average property tax of 0.86 percent, yet the Sunshine State gained almost $24 billion in AGI income alone, four times that of Texas. But Florida and Texas balance high property tax rates with no individual income tax. The average individual income tax rate for the ten states gaining the most AGI from tax migration is more than two points higher than the states losing taxpayers. As illustrated by Tables 6 and 7 below, the ten states gaining the most income from tax migration have an average tax rate of 4.03 percent, while the ten states losing the most income have an average income tax of 7.52 percent.
Migration Data in the Context of State Actions
These trends are important to state policymakers. While it should give cause to examine the need for competitiveness in their tax codes, many high-tax states have instead responded by seeking to erode the general principle that tax obligations are based on the taxpayer’s physical location. In recent years, NTUF has published reports examining how states have sought, with varying degrees of success, to impose income, sales, and businesstax obligations (as well as regulationsand other taxes) on out-of-state individuals and businesses.
Our past analysis on these interstate commerce issues has focused on the great burden that overlapping tax and regulatory systems places upon tax compliance. However, it is worth noting that should states succeed in further blurring the lines between tax jurisdictions, Americans’ ability to “vote with their feet” will become greatly diminished. One of the hallmark characteristics of the federalist system is the ability for taxpayers to choose what state policies they want to live under by choosing what state they want to reside in. That taxpayer freedom at the state and local level exists only so long as states’ tax authority ends where their borders do.
Conclusion
The IRS tax migration data showcases the sharp distinctions between states losing and gaining taxpayers. States gaining taxpayers tend to place less of an emphasis on draining the wealth of their taxpayers into state coffers, instead allowing taxpayers more freedom with what they do with their own money. Taxes are an important factor that taxpayers consider when deciding where to live. If the states losing taxpayer dollars were to make their tax rates more competitive, then these states would not be losing taxpayers at their current rate. States would do well to appraise their tax codes and implement reforms that signal a willingness to respect taxpayers’ money instead of burdening them with significantly higher rates."
No comments:
Post a Comment
Note: Only a member of this blog may post a comment.