Saturday, November 30, 2019

Study On Foxconn Deal Shows Government Subsidies Don't Work

George Mason University Researchers Say Deal With Foxconn Could Reduce Economic Activity

By Corrinne Hess of Wisconsin Public Radio.
"A new study on government subsidies by George Mason University found Wisconsin’s deal with Foxconn will not work and could reduce economic activity in southeastern Wisconsin.

Researchers with the Virginia-based Mercatus Center at the university focused on the Foxconn deal because of its size and high profile.

In its study, "The Economics of a Targeted Economic Development Subsidy," George Mason researchers found targeted subsidies are more likely to diminish rather than enhance the economic prosperity of communities that offer them. 

Researchers based their study on $3.6 billion in state incentives — taking into account the $3 billion incentives package approved by the GOP-controlled state Legislature in 2017, and an additional $600 million in utility, road, training programs and economic development programs needed for the project.

In 2017, the village of Mount Pleasant and Racine County created a special financing district to pay for a $764 million investment to support the Foxconn project. The investment has since been increased to $911 million.

"Wisconsin is pretty much already on the hook for over a billion dollars in subsidizes if Foxconn were to leave tomorrow, the only question is, how much further does it go," said Michael Farren, an economist and head researcher of the study.

Emails to Republican legislative leaders and Gov. Tony Evers' office were not returned. The Wisconsin Economic Development Corp. (WEDC) did not respond to a request for comment by deadline.

Assembly Minority Leader Gordon Hintz, D-Oshkosh, said legislators knew large subsidies often don't pay off when Foxconn was being debated.

"I think there was an appetite for a smaller investment, but the scale of this, even under the best case scenario had a 25-year pay back, and of course the project has changed, and it looks like the best case scenario has been made much worse," Hintz said. "It comes at a time and reaffirms what we know. But the fact that Wisconsin went well and above what traditional incentives are, I think, that put us in an even worse position."

A recent state audit found, on average, firms receiving Wisconsin subsidies create only about 34 percent of promised jobs.

Among its many findings, George Mason University researchers found the Taiwan-based electronics manufacturing company could have come to Wisconsin even without an incentives package, and job goals can hamper economic development.

Local talent, resources and CEO preference are often the reason a company chooses its location, not the subsidy being offered, the study found.

"For the typical subsidy, it only matters between 2 and 25 percent of the time," Farren said.
Foxconn is not as easy to pinpoint.

Its large LCD manufacturing display facilities around the world have been "massively" subsidized by local and national governments, Farren said.

"Wisconsin is probably the best place to locate because of its access to water resources and other utilities and the fact that Wisconsin already has a 0 percent corporate income tax for manufacturing firms," Farren said.

Proponents of targeted economic development policies often argue they can create industry clusters. In Foxconn’s case, Wisconsin officials have been discussing, "Wisconn Valley," for two years.
But the study found specialization should be a natural course to be efficient, using market signals.

"Subsidies can encourage a firm to ignore its or its region’s natural comparative advantage, oblivious of what economists have called 'regional realisms,'" the study found. "Consider this fanciful but feasible alternative: The $3.6 billion in subsidies that Wisconsin promised Foxconn could instead have built 7 square miles of greenhouses to motivate orange growers to move from Florida."

"If Wisconsin was the right place for LCD manufacturing firms, I would argue that they would probably already be locating there," Farren said.

The study also aimed to quantify the cost of the subsidy, looking at the $3.6 billion that could be paid to Foxconn over 15 years if all job goals are met.

The study contends the subsidy represents just over 1 percent of all tax revenue Wisconsin is expected to receive over the next 15 years. If instead, Wisconsin were to decrease its taxes by 1 percent, the state would see $20 billion more in economic development, Farren said.

The study also argues attaching subsidies to job goals incentivizes a company to continue on a path that might no longer be economically viable.

Farren said this has already happened with Foxconn.

The company originally was going to build large flat screens with a so-called Gen 10.5 plant. Foxconn said market changes prompted the company to shift to a smaller Gen 6 facility.

In early 2019, Foxconn executives hedged briefly on whether they would be doing any manufacturing in the state at all. Now, they say the Gen 6 facility will begin operating in late 2020.

"If it doesn’t make sense to build LCD displays in the U.S. or even in southeastern Wisconsin, then it shouldn’t be done," Farren said. "And if you try to force something to happen, then you are going to end up with more economic waste."

Foxconn’s 1 million-square-foot manufacturing plant is currently under construction in Mount Pleasant. The company has remained committed that it will create 13,000 jobs in Wisconsin.

WEDC will receive a report from Foxconn on Dec. 31 to determine whether the company qualifies for state tax credits."
Despite doubts, there’s enough proof to conclude that foreign trade is good for poor

Areas where workers faced foreign competition tended to have greater reduction in poverty rates.

By Devashish Mitra. He is professor, economics, Maxwell School of Citizenship and Public Affairs, Syracuse University.
"In the backdrop to India’s recent decision to not join the Regional Comprehensive Economic Partnership (RCEP), the question of trade liberalisation’s effects on poverty has once again come to the fore. In their new book, Good Economics for Hard Times, Economics Nobel laureates Abhijit V Banerjee and Esther Duflo provide an extensive discussion on the impact of international trade on poverty.

Specifically, they write about work on India by their former PhD student, currently at the International Monetary Fund (IMF), Petia Topalova, ‘The national poverty rate dropped rapidly in the 1990s and 2000s, from about 35% in 1991 to 15% in 2012.

But, against this rosy backdrop, greater exposure to trade liberalisation clearly slowed poverty reduction — contrary to what the Stolper-Samuelson theory would tell us, the more exposed a particular district was to trade, the slower poverty reduction was in that district.’

Not a Poor Conclusion
Based on this statement, a reader could be forgiven for concluding that had India not undertaken trade liberalisation, it would have experienced faster poverty reduction than it did. There are, however, several reasons why such a conclusion would be incorrect.

First, Topalova’s results, based on analysing trade-poverty linkages using the district as the unit of analysis, are quite different from those of a paper I co-authored with Rana Hasan and Beyza P Ural (bit.do/fipeF). Working with states and regions (a region being a collection of districts within a state with similar agro-climatic features) as units of analysis, we found that areas where workers were, on average, faced with greater increases in exposure to foreign competition tended to have experienced greater reductions in rural, urban and overall poverty rates (and poverty gaps).

While working with districts can have some advantages from an econometric perspective, it also has some serious disadvantages. For example, the then-sampling methodology of the National Sample Survey Organisation’s (NSSO) household expenditure surveys used to estimate poverty did not allow for straightforward computation of representative poverty rates at the district level. Further, district boundaries change over time.

An individual district, relative to a state or region, is also more likely to be specialised in its production.

Districts specialised in importable goods will lack the product diversification that can generate offsetting real income enhancing effects of expanding export sectors. Also, irrespective of whether this makes qualitative differences to the results, Topalova emphasised as her main determinant of poverty the overall employment-weighted average tariff, including non-tradable industry tariffs, which she sets to zero.

In our study, we restricted attention to the weighted average for only the economy’s tradable part, since non-tradable employment itself responds to tradable tariffs. Also, a good’s non-tradability arises precisely from its prohibitively high (not zero) trade cost (inclusive of tariff). Our analysis is for tariffs and non-tariff barriers, using several alternative poverty measures.

Next, one should not conclude that trade liberalisation has harmed the cause of poverty reduction. As Banerjee himself has correctly pointed out, based on the analytical methods used in both studies, one can only say which states (or districts) reduced poverty faster or slower due to trade liberalisation, not what this liberalisation did to poverty at the national level.

Now, the national poverty rate certainly declined faster during India’s post reform period. To be sure, the 1991 economic reforms entailed more than just trade liberalisation. But being a key element of the reforms, it is likely that trade liberalisation contributed to higher economic growth and reduced poverty. That all boats were lifted — though some more than others — is consistent with both our study and Topalova’s.

Certainly, these results don’t warrant Banerjee and Duflo’s conclusion that “greater exposure to trade liberalisation clearly slowed poverty reduction”, which runs the risk of serious misinterpretation by lay readers. This claim is especially surprising since Topalova’s urban poverty results are mostly statistically insignificant — that is, lack precision.

Importantly, in some of our analysis, we allowed the transmission of tariffs to change with distance from ports and the quality and density of the transportation infrastructure that vary across states. Hasan and I later extended our analysis in a paper co-authored with Jewelwayne Cain, where we added a later round of NSSO data. All our earlier results survived, and we also found that financial development helps with this trade and poverty reduction channel.

Interestingly, a common finding across both Topalova’s study and ours concerns the role of labour market regulations. While in our study, labour market flexibility was found to enhance the relative speed of poverty reduction in open states, in Topalova’s, it was found to reduce the relative slowness of poverty reduction in open districts. Overall, given the evidence available today, it seems impossible to unambiguously conclude that trade is bad for the poor.  In fact, in India’s case, exactly the opposite applies."

Friday, November 29, 2019

Peter Navarro Says the 'Data' Show Americans Aren't Paying Trump's Tariffs. In Fact, They Show the Opposite.

Tariffs are taxes on imports that translate into higher prices for American businesses and consumers.

By Eric Boehm. Excerpt:
"He could start with The Wall Street Journal, which last week reported on a Goldman Sachs analysis of consumer price index data released by the Labor Department. That analysis found that consumer goods affected by tariffs have increased in price by about 3 percent since February 2018, while goods not subject to tariffs have fallen in price by about 1 percent.

If he wanted to dig a little deeper, Navarro could look at the May 2019 paper published by economists at Harvard, the University of Chicago, and the Federal Reserve Bank of Boston. That analysis of the trade war found that China was absorbing about 5 percent of the tariffs' costs while American consumers were getting hit by the other 95 percent.

Or he could dig up a March 2019 paper published by the Centre for Economic Policy Research, a London-based think tank, that found the Trump's tariffs were draining about $1.4 billion out of the U.S. economy every month. That's above and beyond the actual direct cost of paying the tariffs.

"We find that the U.S. tariffs were almost completely passed through into U.S. domestic prices, so that the entire incidence of the tariffs fell on domestic consumers and importers," wrote Mary Amiti, Stephen J. Redding, and David Weinstein, the three researchers who authored the paper.

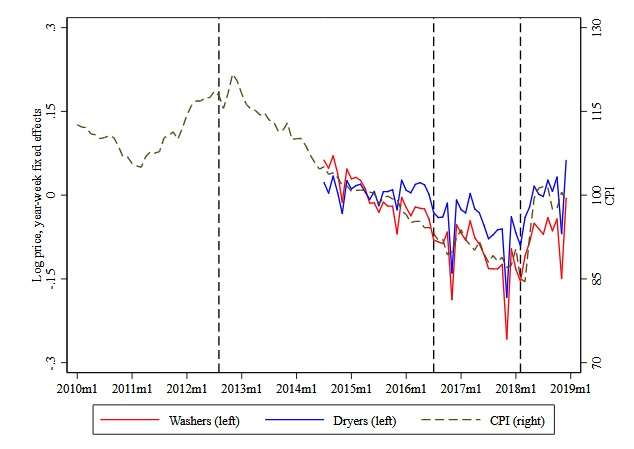
If he's still not convinced, Navarro could pick up a more specific case study, like this April 2019 review of the Trump administration's tariffs on washing machines. In 2018, researchers at the University of Chicago and the Federal Reserve found, those tariffs generated $82 million for the U.S. Treasury—but cost consumers about $1.2 billion.

In fact, the tariffs on imported washing machines ended up increasing the retail price of not just washing machines but dryers too—even though dryers were not subject to the new import taxes imposed by the Trump administration in January 2018. The new tariffs caused a spike in consumer prices for both household appliances after a years-long decline.


The data are pretty clear. Tariffs are taxes on imports that translate into higher prices for American businesses and consumers. Navarro's claims that Americans aren't paying for them are economically illiterate nonsense. It would be one thing for the Trump administration to claim—as it has on some occasions—that the tariffs are a necessary burden for Americans to bear in pursuit of better trade deals, or as a means to getting China to change its bad behavior. But simply lying about the basic realities of the trade war serves only to undermine whatever strategy the White House is pursuing.
If Navarro's not convinced by the data, maybe he would be convinced by…Peter Navarro.

Last week, after announcing that new tariffs on Chinese imports would be postponed until mid-December to avoid soaking American consumers during the holiday shopping season, Navarro said the maneuver was "a Christmas present to the nation."

But why would that be a Christmas present to Americans if Americans aren't paying for the tariffs?
It's remarkable that the Trump administration has been able to ignore economic reality for as long as it has. But it's now becoming clear—on the stock market, in the polls, and from the White House's own jumbled messaging—that the economists were right all along: Tariffs are taxes, and Americans are footing the bill."

U.S. government says it lost $11.2 billion on GM bailout

By Eric Beech of Reuters. Excerpt:
"The U.S. government lost $11.2 billion on its bailout of General Motors Co (GM.N), more than the $10.3 billion the Treasury Department estimated when it sold its remaining GM shares in December, according to a government report released on Wednesday.

The $11.2 billion loss includes a write-off in March of the government’s remaining $826 million investment in “old” GM, the quarterly report by a Treasury watchdog said.

The U.S. government spent about $50 billion to bail out GM. As a result of the company’s 2009 bankruptcy, the government’s investment was converted to a 61 percent equity stake in the Detroit-based automaker, plus preferred shares and a loan.

Treasury whittled down its GM stake through a series of stock sales starting in November 2010, with the remaining shares sold on December 9, 2013.

At the time of the December sale, Treasury put the total loss at $10.3 billion but said it did not expect any significant proceeds from its remaining $826 million investment in “old” GM, the report by the Office of the Special Inspector General for the Troubled Asset Relief Program said."

Trump's Farm Bailout Has Cost Over $10 Billion This Year

Trump has authorized up to $16 billion in bailout spending this year, on top of $12 billion spent in 2018.

By Eric Boehm of Reason.
"The U.S. Department of Agriculture has now spent more than $10 billion this year to bail out farmers affected by President Donald Trump's trade war, according to updated U.S. Department of Agriculture data.

Illinois and Iowa have received more than $1 billion each, while Minnesota, Texas, and Kansas have received more than $700 million each, according to the USDA's data. The bailout payments cover a wide variety of crops, and allow farmers to receive between $15 and $150 per acre, depending on what crops and where in the country the farm is located.

Trump has authorized up to $16 billion in bailout spending this year, on top of $12 billion spent in 2018.

All told, the price tag for Trump's trade war farm bailout now far exceeds the $12 billion in net losses (after loans were repaid) incurred by the Obama administration to bail out domestic auto manufacturers in the wake of the 2008 financial crisis—a policy that was roundly criticized by Republicans and by Trump.

Trump says the farm bailout is being paid for by China, but that's inaccurate in two ways. First, the tariff revenue that's supposedly covering the cost of the bailout is coming from American consumers and businesses that are paying higher taxes because of Trump's tariffs.

Second, the tariff revenue is insufficient to cover the cost of the bailout.

But even if the math added up, the farm bailout would be poor policy. Trump is trying to shield farmers from the loss of a huge export market; China has largely cut-off purchases of American agricultural goods in response to American tariffs on Chinese-made goods. But bailout checks are a poor substitute for a free market. An analysis of the bailout by the Environmental Working Group (EWG), an agricultural policy watchdog, shows that the government largess is flowing mostly to large farms and is not adequately covering farmers' losses.

According to EWG's analysis of more than $6 billion in bailout funds distributed between early July and the end of October, half went to just 10 percent of all recipients. The bottom 80 percent of recipients received an average of just $5,130. And thanks to what the group calls "laughably lax eligibility rules," relatives with no direct connection to farms can cash-in on the bailout—a problem that has long plagued other forms of farm subsidies.

No wonder many farmers say they would much rather be able to sell their goods to China than wait for government checks to arrive."

Wednesday, November 27, 2019

New research suggests that the average net social value of occupational licensing is negative

By John Phelan. John Phelan is an economist at the Center of the American Experiment.
"I’ve written before about the negative economic effects of occupational licenses. For all the rhetoric, they are about protecting producers, not consumers; they lower labor supply and slow economic growth; and, our state’s regime might not be as onerous as in many other states at present, Minnesota ranked 11th overall for the increase in the breadth and burden of its occupational licensing requirements between 2012 and 2017.

Another piece of new research adds to the bleak picture. In a paper titled ‘A Welfare Analysis of Occupational Licensing in U.S. States‘, economists Morris M. Kleiner and Evan J. Soltas set out to weigh the costs and benefits of occupational licenses.
Chief among the costs, they note,
…is that licensing may reduce the supply of labor in licensed occupations. Among the potential benefits are gains in product quality due to the resolution of inefficiencies from asymmetric information. Despite the often heated debate over the trade-offs posed by licensing, economists have thus far offered little guidance on how to conduct a welfare analysis of such policies.
Kleiner and Soltas conclude that
…for marginal occupations licensed by U.S. states, the welfare costs of licensing appear to exceed the benefits. We estimate that licensing an occupation reduces total surplus from the occupation, defined as the welfare value of trade in its labor services, by about 12 percent relative to no licensing. Workers and consumers respectively bear about 70 and 30 percent of these welfare costs. For workers, wage increases compensate for only about 60 percent of the opportunity cost of investments that licensing regulations mandate. For consumers, licensing slightly increases prices adjusted for willingness to pay (WTP), as higher WTP offsets 80 percent of the price increase.
To decode that slightly, occupational licenses are costly for workers to get in terms of other things they could be doing instead (opportunity cost). While occupational licenses raise the wages of workers with them, this premium only recoups 60% of the cost of getting the license. And for consumers, while they are willing to pay more for a licensed worker, this, on average, only covers 80% of the price increase.

Add this to the file of research showing the negative effects of occupational licenses."

NPR story says minimum wage laws lead to automation

See 99 Bottles Of Beer On The Touch Screen: The Spread Of Self-Serve Taps. Excerpt:
"Pour-your-own technology has been featured in bars and restaurants for years, but its appeal has never been more obvious to owners staring at balance sheets that include astronomical rents in desirable locations and new mandatory minimum wage increases in 18 states this year."

Tuesday, November 26, 2019

Why Apocalyptic Claims About Climate Change Are Wrong

By Michael Shellenberger. Excerpts:

"First, no credible scientific body has ever said climate change threatens the collapse of civilization much less the extinction of the human species. “‘Our children are going to die in the next 10 to 20 years.’ What’s the scientific basis for these claims?” BBC’s Andrew Neil asked a visibly uncomfortable XR spokesperson last month.
“These claims have been disputed, admittedly,” she said. “There are some scientists who are agreeing and some who are saying it’s not true. But the overall issue is that these deaths are going to happen.”
“But most scientists don’t agree with this,” said Neil. “I looked through IPCC reports and see no reference to billions of people going to die, or children in 20 years. How would they die?”
“Mass migration around the world already taking place due to prolonged drought in countries, particularly in South Asia. There are wildfires in Indonesia, the Amazon rainforest, Siberia, the Arctic,” she said.
But in saying so, the XR spokesperson had grossly misrepresented the science. “There is robust evidence of disasters displacing people worldwide,” notes IPCC, “but limited evidence that climate change or sea-level rise is the direct cause”
What about “mass migration”? “The majority of resultant population movements tend to occur within the borders of affected countries," says IPCC.
It’s not like climate doesn’t matter. It’s that climate change is outweighed by other factors. Earlier this year, researchers found that climate “has affected organized armed conflict within countries. However, other drivers, such as low socioeconomic development and low capabilities of the state, are judged to be substantially more influential.”
Last January, after climate scientists criticized Rep. Ocasio-Cortez for saying the world would end in 12 years, her spokesperson said "We can quibble about the phraseology, whether it's existential or cataclysmic.” He added, “We're seeing lots of [climate change-related] problems that are already impacting lives."
That last part may be true, but it’s also true that economic development has made us less vulnerable, which is why there was a 99.7% decline in the death toll from natural disasters since its peak in 1931.
In 1931, 3.7 million people died from natural disasters. In 2018, just 11,000 did.  And that decline occurred over a period when the global population quadrupled.
What about sea level rise? IPCC estimates sea level could rise two feet (0.6 meters) by 2100. Does that sound apocalyptic or even “unmanageable”?
Consider that one-third of the Netherlands is below sea level, and some areas are seven meters below sea level. You might object that Netherlands is rich while Bangladesh is poor. But the Netherlands adapted to living below sea level 400 years ago. Technology has improved a bit since then.
What about claims of crop failure, famine, and mass death? That’s science fiction, not science. Humans today produce enough food for 10 billion people, or 25% more than we need, and scientific bodies predict increases in that share, not declines.
The United Nations Food and Agriculture Organization (FAO) forecasts crop yields increasing 30% by 2050. And the poorest parts of the world, like sub-Saharan Africa, are expected to see increases of 80 to 90%.
Nobody is suggesting climate change won’t negatively impact crop yields. It could. But such declines should be put in perspective. Wheat yields increased 100 to 300% around the world since the 1960s, while a study of 30 models found that yields would decline by 6% for every one degree Celsius increase in temperature.
Rates of future yield growth depend far more on whether poor nations get access to tractors, irrigation, and fertilizer than on climate change, says FAO.
All of this helps explain why IPCC anticipates climate change will have a modest impact on economic growth. By 2100, IPCC projects the global economy will be 300 to 500% larger than it is today. Both IPCC and the Nobel-winning Yale economist, William Nordhaus, predict that warming of 2.5°C and 4°C would reduce gross domestic product (GDP) by 2% and 5% over that same period.
Does this mean we shouldn’t worry about climate change? Not at all.
One of the reasons I work on climate change is because I worry about the impact it could have on endangered species. Climate change may threaten one million species globally and half of all mammals, reptiles, and amphibians in diverse places like the Albertine Rift in central Africa, home to the endangered mountain gorilla.
But it’s not the case that “we’re putting our own survival in danger” through extinctions, as Elizabeth Kolbert claimed in her book, Sixth Extinction. As tragic as animal extinctions are, they do not threaten human civilization. If we want to save endangered species, we need to do so because we care about wildlife for spiritual, ethical, or aesthetic reasons, not survival ones.
And exaggerating the risk, and suggesting climate change is more important than things like habitat destruction, are counterproductive.
For example, Australia’s fires are not driving koalas extinct, as Bill McKibben suggested. The main scientific body that tracks the species, the International Union for the Conservation of Nature, or IUCN, labels the koala “vulnerable,” which is one level less threatened than “endangered,” two levels less than “critically endangered,” and three less than “extinct” in the wild.
Should we worry about koalas? Absolutely! They are amazing animals and their numbers have declined to around 300,000. But they face far bigger threats such as the destruction of habitat, disease, bushfires, and invasive species.
Think of it this way. The climate could change dramatically — and we could still save koalas. Conversely, the climate could change only modestly — and koalas could still go extinct.
The monomaniacal focus on climate distracts our attention from other threats to koalas and opportunities for protecting them, like protecting and expanding their habitat.
As for fire, one of Australia’s leading scientists on the issue says, “Bushfire losses can be explained by the increasing exposure of dwellings to fire-prone bushlands. No other influences need be invoked. So even if climate change had played some small role in modulating recent bushfires, and we cannot rule this out, any such effects on risk to property are clearly swamped by the changes in exposure.”
Nor are the fires solely due to drought, which is common in Australia, and exceptional this year. “Climate change is playing its role here,” said Richard Thornton of the Bushfire and Natural Hazards Cooperative Research Centre in Australia, “but it's not the cause of these fires."
The same is true for fires in the United States. In 2017, scientists modeled 37 different regions and found “humans may not only influence fire regimes but their presence can actually override, or swamp out, the effects of climate.” Of the 10 variables that influence fire, “none were as significant… as the anthropogenic variables,” such as building homes near, and managing fires and wood fuel growth within, forests.
Climate scientists are starting to push back against exaggerations by activists, journalists, and other scientists.
“While many species are threatened with extinction,” said Stanford’s Ken Caldeira, “climate change does not threaten human extinction... I would not like to see us motivating people to do the right thing by making them believe something that is false.”
I asked the Australian climate scientist Tom Wigley what he thought of the claim that climate change threatens civilization. “It really does bother me because it’s wrong,” he said. “All these young people have been misinformed. And partly it’s Greta Thunberg’s fault. Not deliberately. But she’s wrong.”
But don’t scientists and activists need to exaggerate in order to get the public’s attention?
“I’m reminded of what [late Stanford University climate scientist] Steve Schneider used to say,” Wigley replied. “He used to say that as a scientist, we shouldn’t really be concerned about the way we slant things in communicating with people out on the street who might need a little push in a certain direction to realize that this is a serious problem. Steve didn’t have any qualms about speaking in that biased way. I don’t quite agree with that.”
Wigley started working on climate science full-time in 1975 and created one of the first climate models (MAGICC) in 1987. It remains one of the main climate models in use today.
“When I talk to the general public,” he said, “I point out some of the things that might make projections of warming less and the things that might make them more. I always try to present both sides.”
Part of what bothers me about the apocalyptic rhetoric by climate activists is that it is often accompanied by demands that poor nations be denied the cheap sources of energy they need to develop. I have found that many scientists share my concerns.
“If you want to minimize carbon dioxide in the atmosphere in 2070  you might want to accelerate the burning of coal in India today,” MIT climate scientist Kerry Emanuel said.
“It doesn’t sound like it makes sense. Coal is terrible for carbon. But it’s by burning a lot of coal that they make themselves wealthier, and by making themselves wealthier they have fewer children, and you don’t have as many people burning carbon, you might be better off in 2070.”
Emanuel and Wigley say the extreme rhetoric is making political agreement on climate change harder.
“You’ve got to come up with some kind of middle ground where you do reasonable things to mitigate the risk and try at the same time to lift people out of poverty and make them more resilient,” said Emanuel. “We shouldn’t be forced to choose between lifting people out of poverty and doing something for the climate.”
Happily, there is a plenty of middle ground between climate apocalypse and climate denial.

Fed economists warn of ‘economic ruin’ if Modern Monetary Theory policies are ever adopted

By Jeff Cox of CNBC.

"Key Points
  • St. Louis Fed economists warn in a paper of potential “economic ruin” if Modern Monetary Theory is adopted.
  • The theory says government debt doesn’t matter if inflation is low, and that deficit spending can be used to fuel growth and reduce inequality.
  • Some of its biggest advocates include Sen. Bernie Sanders and Rep. Alexandra Ocasio-Cortez.
Federal Reserve economists warn that printing money to pay for deficit spending, as Modern Monetary Theory proponents recommend, has been a disaster for other nations that have tried it.

In a paper that discusses the burgeoning U.S. fiscal debt, Fed experts note that high levels are not necessarily unsustainable so long as income is rising at a faster pace. They note that countries that have gotten into trouble and looked to central banks to bail them out haven’t fared well.

“A solution some countries with high levels of unsustainable debt have tried is printing money. In this scenario, the government borrows money by issuing bonds and then orders the central bank to buy those bonds by creating (printing) money,” wrote Scott A. Wolla and Kaitlyn Frerking. “History has taught us, however, that this type of policy leads to extremely high rates of inflation (hyperinflation) and often ends in economic ruin.”

They cite Weimar-era Germany, Zimbabwe in the 2007-09 period and Venezuela currently. All three faced massive deficits that led to hyperinflation due to money printing.
“An important protection against this type of policy is to create an independent central bank that is insulated from the political process and has clear objectives (such as a specific target for the inflation rate) so that it can make policy decisions to sustain economic health over the long run rather than respond to political pressures,” the economists added.
The paper never specifically mentions Modern Monetary Theory, though it does reference a paper on the movement in a sidebar box on monetary “owls” — as opposed to “hawks” who are against deficits and “doves” who don’t care as much about them. The owls, according to the authors, “suggest that a government that controls a fiat money system is not constrained because it can simply create more money to pay its debts.”

Deficit spending as an investment

Indeed, MMT supporters argue that a country that runs up debts in its own currency can never default, and as long as inflation remains tame, there really are no problems with government deficit spending.

They further say that public spending can be used to stimulate the economy, that essentially a deficit in the public sector can be a surplus in the private sector.
The total federal government debt is just over $23 trillion, or 103.2% of GDP. The total actually held by the public (as opposed to intragovernmental debt) is $17.1 trillion, or 76% of GDP. The government budget deficit was $984.4 billion in fiscal 2019.
The Fed itself has come under criticism for “money printing,” which it did in three rounds of quantitative easing during and after the Great Recession. This came along with keeping its short-term lending rate anchored near zero for seven years. However, the central bank’s stated aims were to bring down long-term interest rates and stimulate economic growth, not to finance the national debt.
“There are ways in which the government can make investments today, that increase deficits today, that produce higher growth tomorrow and build in the extra capacity to absorb those higher deficits,” Stephanie Kelton, professor of public policy and economics at Stony Brook University, said in a video for CNBC.com. “Their red ink becomes our black ink and their deficits are our surpluses.”
Kelton added that deficit spending can be used to fund improvements in education, infrastructure and other inequality-reducing programs without causing long-term damage.
Some of the most prominent advocates for MMT are Democratic presidential candidate Sen. Bernie Sanders and Rep. Alexandria Ocasio-Cortez, both of whom identify as democratic socialists, as well as former Pimco economist Paul McCulley.
Most mainstream economists and Wall Street authorities, however, reject the basis that deficits don’t matter absent inflation.
Bond market guru Jeffrey Gundlach at DoubleLine Capital has called MMT “a crackpot idea,” while former White House economist and Treasury Secretary Larry Summers has labeled it “dangerous.” However, hedge fund king Ray Dalio at Bridgewater Associates said its adoption is “inevitable” amid growing wealth disparity."


Sunday, November 24, 2019

Cuomo’s Carbon Casualties

Ban pipelines and fracking and then blame business for shortages

WSJ editorial. Excerpts:
"Natural-gas production in Pennsylvania has increased 60% since Mr. Cuomo banned fracking five years ago, adding $6 billion to Keystone State GDP and its waterways are fine.

Mr. Cuomo’s real purpose is to eliminate natural gas as part of his political commitment to “carbon neutrality” by 2050, and this isn’t a cost-free promise. Upstate New Yorkers struggle economically and pay among the highest energy costs in the U.S. A quarter still rely on heating oil, which costs about $1,000 a year more than natural gas and emits nearly 40% more CO2. New Yorkers pay about 40% more for electricity than Pennsylvanians and 15% more than in New Jersey.

"The utility Con Edison in March halted natural gas hookups north of New York City due to pipeline constraints. National Grid, the gas utility that serves Long Island, this fall imposed a moratorium on new hookups after the Governor vetoed a 23-mile gas pipeline beneath New York Harbor. National Grid said it couldn’t guarantee uninterrupted service without the pipeline. New oil-to-gas conversions could cause future gas shortages and outages."

"“The ‘moratorium’ is either a fabricated device or a lack of competence,” the Governor wrote to National Grid last week."

"The Governor claims the utility violated its “fundamental legal obligation” by inadequately managing supply and demand. He also blames the utility for promoting oil-to-gas conversions even though this advances the state’s climate goals. One irony is that the pipeline he vetoed below New York Harbor could reduce annual CO2 emissions by the equivalent of 500,000 cars on the road. His gas embargo is raising state emissions."

Sanders’s Tax Would Hit Small Investors (financial transaction tax)

By Fred Hatfield. Mr. Hatfield was a Democratic member of the Commodity Futures Trading Commission, 2004-07. Excerpts:
"the presidential candidates would do well to drop one of their talking points: a financial transaction tax. Sen. Bernie Sanders has long supported an FTT, which he calls a “tax on Wall Street speculation.” Sen. Elizabeth Warren has also endorsed the idea. But former Vice President Joe Biden says it would “impact investments held by middle-class Americans.”"

"Sweden repealed its FTT in 1991 after 50% of its trading volume migrated to London. Various European Union officials have tried to institute such a tax, but they’ve been unable to do so because the tax would be difficult to implement and could slow economic growth. In the U.S., we’ve already tried the FTT. Congress enacted a stamp tax on trades of stocks and bonds in 1914, but it was scrapped in 1965 because it produced little revenue and slowed growth.

The economic case against the tax is persuasive, too. According to a study of Mr. Sanders’s proposed FTT by Georgetown economist James Angel, the tax could reduce retirement savings by as much as 8.5% over a typical worker’s lifetime. These significant losses for ordinary investors may be one reason why the Obama administration’s economic team, which considered proposing its own FTT, ultimately decided against it."

"The tax would be bad for farmers, whose support is critical in the Feb. 3 Iowa caucuses. Iowa is the nation’s leading producer of corn and the second-largest producer of soybeans (after Illinois). Farmers manage risk by entering into futures contracts, a type of derivative. Under Mr. Sanders’s proposal, trades of corn and soybeans futures would be taxed at a rate of 0.5 basis point."

Saturday, November 23, 2019

Elizabeth Warren's 68.7 Percent Tax on Capital Income

By David Henderson.

What about a 3% tax on wealth? If you have $100 and earn 3% on some investment, at the end of the year you have $103. Now you have to pay a wealth tax of 3%. The amount you pay is .03*103 = $3.09. Now divide 3.09/3 and you get 1.03. 3.09 is 103% of 3. A tax rate of 103% on income.

What about a 2% tax on wealth? If you have $100 and earn 3% on some investment, at the end of the year you have $103. Now you have to pay a wealth tax of 2%. The amount you pay is .02*103 = $2.06. Now divide 2.06/3 and you get .687. 2.06 is 68.7% of 3. A tax rate of 68.7% on income.

"Columbia University public finance economist Wojciech Kopczuk, who is also editor-in-chief of the Journal of Public Economics, arguably the top journal in public finance, has a first-rate critique of a proposal by Emmanuel Saez and Gabriel Zucman for taxing wealth. Saez and Zucman are professors of economics at University of California, Berkeley.

I’m working my way through the paper and found one statement up front that non-economist readers might find implausible but that is correct. Kopczuk writes:
An individual with this year’s stock of wealth W earning the return of r could be next year (assuming away any consumption) subject to a tax that is imposed on either (1+r)W or rW — a wealth or a capital income tax. It is immediate to see that absent any other considerations, a tax of t on wealth is revenue-equivalent to a tax of Ï„=(1+r)t/r imposed on capital income rW. This links the two bases and provides a straightforward comparison of the burden that a wealth tax would impose on capital income. If you consider a safe rate of return of, say, 3%, a 3% wealth tax is a 103% tax on the corresponding capital income and a 6% tax rate is a 206% tax. Obviously, even though wealth tax rates appear nominally small, they are in fact very heavy taxes on the corresponding streams of income.
Really? A 3% tax on wealth amounts to a 103% tax on capital income? Yes, it really does. It probably isn’t “immediate to see,” as Kopczuk writes. But it’s true.

My point here is to make his point clear by filling in the missing math.

If someone starts the year with wealth W and earns a rate of return of r on that wealth, at the end of the year she will have a wealth of (1+r)W. [Why do I say “she?” Because the tax that Saez, Zucman, and Senator Warren advocate is on the wealthy and the wealthy are disproportionately old, and the old are disproportionately female.]

So the tax will be t(1+r)W, where t is the tax rate on wealth.
But t(1+r)W = t(1/r +1)rW.

So the tax rate of t on W amounts to a tax rate of t(1/r +1) on rW
But notice that rW is the return on capital. QED.

Now plug in some plausible numbers.

Kopczuk starts with a 3% tax on wealth.

So the tax rate on income from wealth = 0.03(1/0.03 + 1) = 1 + 0.03 = 1.03. So indeed a 3% tax on wealth is a 103% tax on the income from wealth.

Start with Elizabeth Warren’s 2% tax on wealth. The tax rate on income from wealth, therefore, = 0.02(1/0.03 +1) = 0.687. That amounts to a 68.7 percent tax on the income from wealth."

Consumer Financial Protection Bureau Should End Frivolous Student Loan Lawsuit

By Matthew Adams & John Berlau of CEI.
"The efforts of Consumer Financial Protection Bureau (CFPB) Director Kathy Kraninger have gone a long way in reversing egregious Obama-era actions that plagued the agency, helping to make it more transparent, accountable, and friendly to consumer choice. However, while these efforts should be applauded, there remains unfinished business that must be taken care of—chief among them the flawed lawsuit levied by the CFPB against the finance company Navient.

The lawsuit against Navient, a servicer of student loans for both private lenders and the federal government, was launched in January 2017, just two days before the inauguration of Donald Trump. Not only did the lawsuit give the appearance of being rushed through before a change of leadership, it soon looked even weaker when the primary allegations of the suit were shown to be overblown or outright false.

In the suit, the CFPB argued that Navient had “systematically and illegally fail[ed] borrowers at every stage of repayment” by misleading them and steering them towards forbearance—a loan status where payments are temporally suspended but where interest continues to accrue—instead of other repayment options such as income-based repayment. The suit aimed to provide “appropriate restitution” to those “consumers harmed by [Navient’s] unlawful conduct.”

In January of this year, Navient filed for summary judgment, accusing the CFPB of failing to provide proof of the claims it made in the lawsuit. The CFPB then filed a legal brief defending its suit in March. Last month, Pennsylvania’s Clerk of Court chose to unseal the complete legal brief which shines light on the weakness CFPB’s case.

Included in the CFPB’s legal brief was a chart used by Navient staff when helping borrowers choose their best option for repayment. Despite CFPB allegations that Navient pushed forbearance above all else, the chart actually places forbearance at the bottom of the list, after extended repayment, graduated repayment, income-based repayment (IBR), income-contingent repayment (ICR), income-sensitive repayment (ISR), and deferment. This makes sense when considering that the Department of Education pays student loan servicers significantly less for accounts in forbearance than those in other repayment plans.

Beyond this, the documents indicate that the CFPB had actually cherry picked evidence in the case. Writing in Legal Newswire, Colin Froment pointed out that “According to the brief, Navient claims that the CFPB filed its complaints before the bureau collected and thoroughly analyzed all the documents needed.” This builds on revelations during litigation where Navient asked the CFPB to identify specific borrowers who were harmed by their business practices. The CFPB used its immensely flawed consumer compliant database to produce fifteen witnesses who alleged they were hurt by Navient. As it turns out, when Navient had the chance to examine records of these specific witnesses, it showed that Navient hadn’t done anything to mislead or intentionally harm these borrowers. In fact, at least one witness had lied to Navient about her income to become eligible for other repayment options.

Alas, none of this evidence has discouraged Sen. Elizabeth Warren (D-MA), architect of the CFPB from her days as an academic, from continuing her crusade against the company. Last month, Warren sent a letter to Education Secretary Betsy DeVos urging her to cut the Department of Education’s contract with Navient due to the company’s purported “decade-long record of terrible servicing practices.”

Responding to Warren’s attack, Navient President and CEO Jack Remondi wrote to Secretary DeVos on November 9:

Sadly, the letter recycles disproven Consumer Financial Protection Bureau allegations. Even after nearly six years of investigation and false claims, the CFPB has not identified even one borrower to support claims of “steering” away from an income-driven repayment (IDR) plan into forbearance. That is because there was no policy and no practice to do so.

Navient has also said that it goes well beyond the Department of Education’s student loans servicing standards and their business practices are consistent with the Consumer Data Industry Association’s guidance

As noted by American Enterprise Institute resident fellow Jason Delisle, “You need to understand the context of all of this, and once you understand the context, it doesn’t look like the CFPB has much of a case so far.”

While headlines around student loans capture attention for good reasons, it’s important to sort fact from fiction. With such a severe lack of evidence, the CFPB should drop the case entirely and move forward with actions that truly help consumers—including student borrowers—by lifting barriers to innovation and facilitating more financial choices."

Friday, November 22, 2019

We hear about US jobs outsourced overseas (‘stolen’) but what about the 7.4M insourced jobs we ‘steal’ from abroad?

By Mark Perry.
"We’ve heard a lot of criticism over the last several years, especially from President Trump and many of his economic advisers and supporters, about US firms outsourcing factory jobs overseas, along with accusations that countries like Mexico, China, and Japan are “stealing US jobs” (see more than 35,000 Google search results for “Trump” + “stealing jobs”). Further, Trump warned after he was elected that his administration would punish US companies seeking to move operations and jobs overseas with “consequences.

What we don’t hear very much about from Team Trump are the jobs that are “insourced” into every US state by foreign companies, even though those insourced jobs totaled more than 7.4 million Americans and represented 5.9% of all private sector US jobs in 2017 based on new preliminary data released this week by the Bureau of Economic Analysis on “Activities of U.S. Affiliates of Foreign Multinational Enterprises in 2017.” The map above (thanks to AEI’s Allison Torban for assistance, click to enlarge) shows the thousands (and in half of the US states hundreds of thousands) of insourced jobs in each US state in 2017.

Here are some key statistics on business activities in the U.S. that highlight the significant economic benefits to the American economy from the 7,281 foreign-based firms that outsourced jobs and production to the U.S. (data tables here) in 2017:
  • More than 7,000 US affiliates of foreign multinational enterprises (MNEs) employed 7.4 million American workers in 2017, a 2.8% increase from 7.2 million in 2016, adding roughly 200,000 to the US economy
  • Employment by US affiliates represented 5.8% of the total U.S. private industry employment in 2017 (126.8 million workers)
  • The current-dollar value added of majority-owned US affiliates, a measure of their direct contribution to US GDP, totaled $1 trillion in 2017 and accounted for 6.9% of total US business-sector value added
  • US affiliates supported nearly 2.51 million factory jobs in 2017, accounting for slightly more than 20% of total American manufacturing employment (12.44 million factory workers)
  • US affiliates of foreign MNEs supported an annual payroll of $618.4 billion in 2017—with an average compensation per worker of more than $84,000
  • US affiliates of foreign companies paid an average annual compensation of $96,000 in the manufacturing sector
  • US affiliates employed more than 431,000 US autoworkers in 2017, with average compensation per worker exceeding $79,000
  • US affiliates exported $383 billion in goods (25% of all US exports)
  • US affiliates imported $686 billion in goods (24% of all US imports)
  • US affiliates spent more than $63 billion on R&D in 2016 (15.6% of all US R&D)
  • US affiliates spent $259 billion on new property, plant, and equipment in 2017
  • US affiliates paid $49.3 billion in US income taxes
  • As a separate state, the 7.4 million Americans employed by foreign-based companies would have been the fifth largest US “state” ranked by the number of nonfarm payroll employees in 2017 behind only California, Texas, New York and Florida
  • As a separate state, the $625 billion annual payroll of Americans working for foreign insourcing companies in the US would have ranked that group of American employees in 2017 as the seventh largest US “state” for Personal Income, behind No. 6 Pennsylvania at $682 billion and ahead of No. 8 New Jersey at $581 billion
In other words, the insourcing of production and jobs to the US has a significant and positive impact on our economy, and yet this huge economic stimulus gets almost no attention. All we ever hear about from Team Trump is the jobs that are allegedly being “stolen” from us by China, Japan, Europe, and Mexico.

Bottom Line: In today’s highly globalized economy, multinational firms operate in a world marketplace that increasingly makes national borders meaningless and irrelevant, as firms capitalize on hyper-efficient global supply chains that add enormous value, and ultimately result in lower costs and higher quality for the goods that consumers buy here and around the world. In the recent Trump-era discussions on US manufacturing, the outsourcing of production and jobs overseas, and the supposed “theft” of our jobs by Mexico, China, and Japan, we lose sight of another big part of the global economy: the insourcing of millions of jobs into America by the 7,000+ US-based affiliates of foreign multinational companies that operate here and employ millions of our workers.

Q: How could it possibly make sense for Trump to accuse Mexico, China and Japan of “stealing” our jobs, unless he also admits that the US is apparently then also “stealing” jobs from other countries, more than seven million in 2017? A more enlightened and up-to-date view of international trade would recognize the economic reality that modern businesses today operate in an increasingly globalized marketplace for their inputs, parts, materials, supplies along complex, cross-border supply and value chains that include multiple dozens of countries. In addition, those global companies serve retail markets in hundreds of countries around the globe.

Just like it makes economic and business sense for thousands of foreign companies to outsource jobs and production from their countries to every US state (perhaps because the US is one of their major retail markets), it also makes economic and business sense for thousands of US companies to outsource jobs and production from the US to foreign countries, perhaps also because overseas markets now represent more than 50% of retail sales for many US-based companies like Apple (63% of 2017 sales were in foreign markets, see data here), Procter and Gamble (58% sales were overseas), GE (62% foreign sales) and Pfizer (51% overseas sales). Hopefully, Team Trump will eventually move beyond a simplistic, nationalistic (“America First”), and outdated view of the global economy based on a fixed number of jobs where countries have to fight to “steal” jobs from each other in a zero-sum, win-lose world, to a more advanced and sensible view of a dynamic world of inter-connected, cross-border transactions where production and employment decisions are grounded in the reality of economics, and not politics."

The Wall Street Journal’s study of Google search bias appears to be biased

By Mark Jamison of AEI.
"The Wall Street Journal recently reported a shocking revelation: Senior Google employees exert “editorial control over what (its search engine) shows users.” Another journalist and member of the managing board of the Stigler Center at the University of Chicago echoed: “Google is everything we feared.”

The numbers can be impressive: About 1.5 billion people visit this critical and unique information source. Human intervention is involved in directing about 70 percent of academic users, but the humans claim their motives are unprejudiced. Outside groups apply intense pressure to selectively censor information. And it is feared that up to 50 percent of the information presented as scientific is demonstrably false.

Oh, wait. Those are data for US libraries (public and academic). (See here, here, here, here, and here.) Google seems to have less human bias than libraries, and its information is no less accurate.
Google is used more than libraries (120 billion queries per year vs. 1.5 billion library visits for the US), but the amount of human intervention has to be much less than for libraries: Google employs 98,771 people worldwide and there are 134,800 librarians in the US alone. And librarians choose their hard copy materials. (See here, here, and here.)

The Journal reports that an internal Google study found that search results contain misinformation only 0.1 percent to 0.25 percent of the time. Apparently, libraries don’t track the number of times librarians give bad advice, but it would be tough to beat 99+ percent accuracy, and the quality of the information sources should be about the same for Google and libraries.

So these journalists’ claims lack context. And they appear to have a bit of tout: The Journal article asserts that “Google engineers regularly make behind-the-scenes adjustments” to top layer search results. It also says that “Google employs thousands of low-paid contractors whose purpose the company says is to assess the quality of the algorithms’ rankings” and that “Google gave feedback to these workers to convey what it considered to be the correct ranking of results.” It also said Google executives and engineers regularly tinker with the company’s algorithms, making “more than 3,200 changes to its algorithms in 2018, up from more than 2,400 in 2017 and from about 500 in 2010.”

In other words, Google makes judgements in modifying its algorithms and is paying greater attention as political pressures mount. And Google’s upper level management gives guidance to lower level workers. These are good practices.

And it is unclear what it means for engineers to work “behind-the-scenes:” Were they hiding from management or simply not doing their work where all could see? At least the latter would seem to be good practice.

The Journal also found “wide discrepancies” in Google’s auto-complete feature and search engine results. Based on the data presented, by “wide discrepancies” the Journal appears to mean that that Google’s algorithms perform differently than those of DuckDuckGo, Yahoo, and Bing. It is unclear why that constitutes a “discrepancy” or why it belongs under the headline “How Google Interferes With Its Search Algorithms.” Wouldn’t it be expected that a search engine that people use about 90 percent of the time would be different from engines that people use less than 10 percent of the time?
The Journal makes one potentially important point: It claims that Google favors large clients over smaller ones and blacklists some sites in its search results, all the time claiming that it doesn’t do so. If this is true, Google isn’t necessarily dishonest: Large clients may be better at search engine optimization than smaller clients, and a blacklist can be an efficient way of dealing with some types of bad actors. But if the company isn’t being honest, it should be held accountable by customers, regulators, or both, as should any company or institution.

US social media companies are caught in an intensely political moment. Business decisions that are likely sensible and well-justified are apparently being spun to grab attention and look onerous. It may be hard for the companies to emerge from this moment unscathed by poor regulatory responses, but more careful journalistic characterization of research results would help.

(Disclosure statement: Mark Jamison provided consulting for Google in 2012 regarding whether Google should be considered a public utility.)"

Thursday, November 21, 2019

Germany Is Currently Adding Very Little Wind Power Capacity

See Germany wind power fact of the day by Tyler Cowen.
"In the first nine months of 2019, developers put up 150 new wind turbines across the country with a total capacity of 514MW — more than 80 per cent below the average build rate in the past five years and the lowest increase in capacity for two decades. The sharp decline has raised alarm among political leaders, industry executives and climate campaigners.
“For the fight against climate change, this is a catastrophe,” said Patrick Graichen, the director of Agora Energiewende, a think-tank in Berlin. “If we want to reach the 65 per cent renewables target we need at least 4GW of new onshore wind capacity every year. This year we will probably not even manage 1GW.”
The problem was two-fold, he said: “The federal states have not made available enough areas for new wind turbines, and those that are available are fought tooth and nail by local campaigners.”
Here is more from Tobias Buck at the FT."

Medicaid Improper Payments are Much Worse Than Reported

By Aaron Yelowitz and Brian Blase of Cato.
"Earlier this week, Centers for Medicare & Medicaid Services (CMS) raised its estimate of Medicaid’s improper payments from $36 billion (9.8 percent of federal Medicaid expenditures) to $57 billion (14.9 percent of federal Medicaid expenditures). Actually, the situation is far worse than these estimates suggest. As we discussed in a Wall Street Journal op-ed after the numbers were released, Medicaid’s improper payments now almost certainly exceed $75 billion – or more than 20 percent of federal Medicaid expenditures.

This year’s report shows not only a significant increase in CMS’s estimate of improper payments. Its methodology also shows the agency has been hiding even larger improper payments for years. CMS estimates improper payments in the Medicaid program by auditing each state and DC once every three years and then using the most recent estimate available for each to construct a three-year rolling average. The 2018 report therefore covered fiscal years 2015-2017, while the 2019 report covered fiscal years 2016-2018.

There’s one important caveat, however. The Obama administration did not perform Medicaid eligibility audits for fiscal years 2014-2017. Instead, it simply plugged the eligibility rate from the pre-Obamacare era into its improper payment calculations. This change would tend to hide any increases in improper enrollments that may have accompanied the implementation of ObamaCare’s Medicaid expansion. Indeed, other evidence suggests severe eligibility errors and problems accompanied the Medicaid expansion. As a result, the 2015, 2016, 2017, 2018, and 2019 reports likely underestimate the true extent of Medicaid improper payments because they use pre-ObamaCare data to describe what was happening under ObamaCare.

So it’s a very big deal that CMS’s 2019 report showed a 5.1 percentage point increase in the three-year moving average—from 9.8 percent to 14.9 percent—compared to the 2018 report. Note that while both reports’ averages use imputed improper payment rates for fiscal years 2016 and 2017 based on pre-2014 (i.e., pre-ObamaCare) data, the newest three-year average replaces the pre-ObamaCare rate used for 2015 with the actual, post-ObamaCare estimate for fiscal year 2018.

Mathematically speaking, in order for the overall three-year average to rise by 5.1 percentage points, the improper payment rate estimate for FY 2018 must be 15.3 percentage points higher (5.1 x 3 years) than the FY 2015 estimate. Given that the true improper payment rate in 2015 was almost certainly at least 8 percent, then the true improper payment rate in Medicaid (or more precisely, the real three-year rolling average from FYs 2016-2018) would then exceed 23 percent (15.3 percent + 8 percent). In other words, as long as the improper payment rate in FY 2016 exceeded 5 percent -- and Medicaid’s improper payment rate has never been below 5 percent -- the true improper payment rate exceeds 20 percent.

Even this much higher three-year rolling average is likely too low. CMS surveys the 50 states and DC in cycles – with 17 jurisdictions each year. The 2019 report updates the payment rate with “Cycle 1” states – which includes Arkansas, Connecticut, Delaware, Idaho, Illinois, Kansas, Michigan, Minnesota, Missouri, New Mexico, North Dakota, Ohio, Oklahoma, Pennsylvania, Virginia, Wisconsin, and Wyoming. Recent OIG government audits of newly eligible Medicaid expansion enrollees known as “new adults” in California, New York, Colorado, and Kentucky, as well as non-newly eligible enrollees in California, New York, and Kentucky find serious program integrity issues and high improper payments during the 2014-2015 initial implementation of Obamacare. None of these states with well documented issues with their expansions were included in Cycle 1. Neither are Louisiana or Oregon, where state audits showed significant problems with how those states were conducting eligibility reviews.

In a forthcoming Mercatus paper, we find that the 12 expansion states with the largest rates of improper eligibility were New Mexico, California, Kentucky, Rhode Island, West Virginia, Oregon, Washington, Arkansas, Colorado, Louisiana, Montana, and New York. Yet, the CMS report only includes two of them (New Mexico and Arkansas). The result is that the 2019 estimate uses data that are not only not up to date, but also unrepresentative. An estimate employing up-to-date and representative data would show an even higher improper payment rate. Moreover, the sheer size and extent of improper enrollment problems in California will raise the cycle-specific rate for the 2020 report.

Looking across the entire country and fully accounting for eligibility problems, it is possible, if not likely, that the improper payment rate is as high as 25 percent of federal Medicaid expenditures, or nearly $100 billion a year. That’s more than the entire $70 billion CMS actuaries estimate the federal government spend on ObamaCare’s Medicaid expansion in 2018.

Improper payments in Medicaid are a real problem for policymakers, and it is imperative that CMS finally take this problem seriously. Next week, the Mercatus Center will publish a new paper we authored that explains the problem in greater detail, including which states have the highest rates of improper payments, and makes a series of recommendations for reform."

Wednesday, November 20, 2019

New Report Finds Trade War is a Lose-Lose for U.S. and China

By Erica York of The Tax Foundation.
"A new report from the United Nations Conference on Trade and Development (UNCTAD) assesses the impact of the U.S.-imposed tariffs on imports from China, United States import prices, and United States imports from other countries. The findings provide empirical evidence for what economists generally expect to happen when bilateral tariffs are imposed: reduced trade, higher prices for consumers, and trade diversion. The report concludes that the U.S.-imposed tariffs are economically damaging to both the United States and China.

A quick review: tariffs are imposed to make foreign-made goods relatively more expensive than domestically produced goods in order to shift demand away from foreign-made goods. Further, if tariffs are imposed against a single country, they are likely to divert trade to other countries where the tariff can be avoided.

The UNCTAD study measures these effects by examining the differences between goods that were subject to the first two rounds of U.S. tariffs (25 percent tariff on $50 billion and 10 percent tariff on $200 billion—for more details, view our tariff tracker) and goods that were not subject to the tariffs from Q1 2018 through Q2 2019.

The authors of the UNCTAD study point out that negative economic effects often happen together: imposing a bilateral tariff is likely to lead to a combination of higher prices for consumers, lower profits for exporters, and trade diversion that benefits other countries. Here are some of the key findings from the UNCTAD study:
  • U.S.-imposed tariffs led to a 25 percent decline of imports from China (about $35 billion) of tariffed products in the first half of 2019.
  • The average impact of tariffs appears to have increased over time, as the differential between tariffed and non-tariffed goods grew larger the longer the tariffs had been imposed. This reached a high in the Q2 2019. For example, the study finds the differential impact in the value of goods subject to the first round of tariffs versus those not affected was 22 percent in Q3 2018 and increased to about 45 percent in Q2 2019. The authors cite this as evidence that tariffs are the main factor behind the fall in U.S. imports from China.
  • U.S. tariffs did not have any effect on Chinese export prices until Q2 2019, when export prices for goods subject to tariffs were about 8 percent lower. Tariffs can lead to higher consumer prices (the burden would fall on consumers) and/or lower export prices (the burden would fall on exporters). By not lowering export prices, the burden of the tariff has so far fallen primarily on U.S. consumers.
  • Trade diversion effects (importing the same goods from other countries not subject to tariffs instead of from China, where the goods would face tariffs) totaled $21 billion for the first half of 2019, which replaced about 63 percent of the decline in imports from China. The largest beneficiaries of trade diversion were Taiwan, accounting for $4.2 billion additional exports to the U.S. in the first half of 2019; Mexico, $3.5 billion; the European Union, $2.7 billion; and Vietnam, $2.6 billion.
  • While trade diversion made up for about $21 billion of the $35 billion decline in imports from China, the remaining $14 billion “was lost due to lower demand in the United States and/or not enough capacity from the rest of the world.”
This study confirms that U.S.-imposed tariffs are causing economic harm to both the United States and China. The harm in the United States is primarily driven by higher prices for consumers, while the harm to China is related to export losses. The authors note that including the recently imposed tariffs in the calculation of economic harm would add to the existing losses measured in the study. The impact of Chinese tariffs on U.S. imports would likely be analogous to American tariffs on Chinese products—higher prices for Chinese consumers and losses for U.S. exporters."

How migration makes the world brainier: Hyperconnected migrants accelerate the spread of ideas

From The Economist Excerpts:
"A survey in 2015 found that the most common surnames for founders of new firms in Italy were Hu, Chen and Singh, with Rossi a distant fourth."

"Immigrants or their children founded 45% of America’s Fortune 500 companies, including Apple, Google and Levi Strauss. Two-fifths of America’s Nobel science prize-winners since 2000 have been immigrants. Globally, migrants are three times likelier to file patents than non-migrants."

"Skilled migrants make locals more productive. Commercial or scientific projects typically involve big teams with varied talents and expertise. The absence of just one specialist can delay or scupper the whole project. Drawing on a global talent pool makes it easier to fill such gaps, and pursue bigger ideas. Startups that win visas for foreign staff in America’s skilled-visa lottery are more likely to expand, according to a study by Stephen Dimmock of Nanyang Technical University."

"Immigrants bring new perspectives. They also bring knowledge of overseas markets, and connections. This speeds the flow of information between countries. Multinational firms that hire lots of skilled immigrants find it easier to do business with their home countries, says William Kerr of Harvard Business School."

"The most obvious benefits from migration are what economists call “static” gains—migrants from poorer to richer countries earn more the moment they arrive. “But the real gains are the dynamic ones,” says Caglar Ozden of the World Bank—the complex interplay of newcomers with natives and the outside world. “That is what created the us miracle [of the past two and a half centuries],” says Mr Ozden. It is also what has made Australia so rich."

"Migrants also stay in touch with their home countries. Some spend a decade or two abroad, and then go back to start a business with the knowhow they have acquired in a more advanced country. That is, roughly speaking, how the Indian information-technology industry started. Mukesh Ambani, India’s richest industrialist, is a Stanford drop-out. Jack Ma, the founder of Alibaba, China’s biggest e-commerce firm, found out about the internet on a trip to America. A study by the Kauffman Foundation, a think-tank, found that two-thirds of Indian entrepreneurs who return home after working in America maintain at least monthly contact with former colleagues, swapping industry gossip and sharing ideas.

What is more, the lure of earning big money overseas changes the incentives for people in poor countries. It prompts more of them to get educated and acquire marketable skills. Having acquired these skills, many who intended to emigrate never do, perhaps because they fall in love or their parents fall sick. Many who do emigrate, ultimately return. A study by Frédéric Docquier and Hillel Rapoport concluded that “high-skill emigration need not deplete a country’s human-capital stock”—and if well handled, can actually make the sending country richer. Big countries such as India, China and Brazil would benefit handsomely from sending out more migrants. However, once a country starts losing more than 20% of its university graduates, as some small African countries do, it starts to be a drag on growth"

Tuesday, November 19, 2019

Let markets solve health care crisis

By Antony Davies & James Harrigan. Antony Davies is associate professor of economics at Duquesne University. James Harrigan is managing director of the Center for the Philosophy of Freedom at the University of Arizona.
"The presidential election is just about a year away, and we are already being subjected to a steady diet of politicians telling us what we need to do to fix the health care industry. Their rallying cry is familiar: We cannot allow “unfettered capitalism” to “deny us access” to health care. But an honest look at the facts indicates that politicians themselves caused our problems in the first place.

Our current health care (more precisely, health insurance) problems are less the result of unfettered capitalism than of two major government interventions in markets. The first was the Stabilization Act of 1942, under the authority of which President Franklin Roosevelt issued an executive order prohibiting wage increases. But prices aren’t switches one can simply flip to alter reality; they are metrics that reflect a pre-existing reality. In 1942, the reality was that businesses were having a hard time attracting workers. Wage controls didn’t change that reality. When politicians prohibited employers from attracting workers with higher wages, employers began offering health insurance instead.

The second government intervention came in 1954 when the IRS ruled that employer-provided health insurance was not taxable. This made employer-provided health insurance less expensive than individual health insurance, and less expensive than a wage raise of the same pre-tax amount. This is about as far from unfettered capitalism as possible, but politicians know not to let the facts get in the way of good campaign slogans.

The first intervention contributed to today’s pre-existing condition problem. With employer-provided insurance, a sick worker who loses his job also loses his insurance. Any new insurer will, quite sensibly, count that sickness as a pre-existing condition. The second intervention contributed to today’s insurance premium problem. When it’s cheaper to take a raise in the form of tax-free benefits than taxable wages, demand for insurance rises. And that increases the price of insurance.

Medicare and Medicaid followed these interventions a decade later, and before we knew it, the government was so deeply involved in health care that it was difficult for many to imagine things any other way. For decades, we have been lurching toward a government-run health care system as state and federal governments have enacted a sequence of ever more elaborate plans intended to solve the myriad problems their previous plans created.

But it needn’t be this way, as some telling examples illustrate. Cosmetic surgeries are typically not covered by insurance, and are thus largely exempt from the government tinkering. From 1998 to 2016, consumer prices excluding medical care rose an average of 2.1% annually. Over the same period, prices of cosmetic surgeries rose an average of only 1.6% annually. Lasik surgery is typically not covered by insurance either, but its price has remained unchanged for the past decade — not even keeping pace with inflation. The prices of most health care services that escaped political planning have risen slower than inflation — just like those of other high-technology products.

There may be ways government regulation can increase people’s access to health care and insurance. But the evidence suggests that markets, when left alone, can take us a long way to the solution. And that means that the first thing politicians should do when they see a problem in health care markets is not to ask what they might do to make it better, but to ask what they might stop doing that is making it worse."