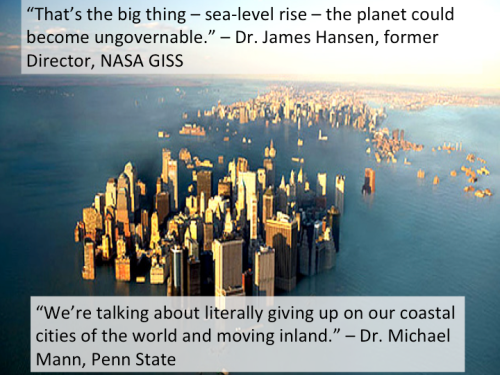
"One of the most consequential impacts of a warming climate is sea level rise. These two statements by climate scientists typify the alarm over sea level rise:
Is this alarm justified by the scientific evidence?
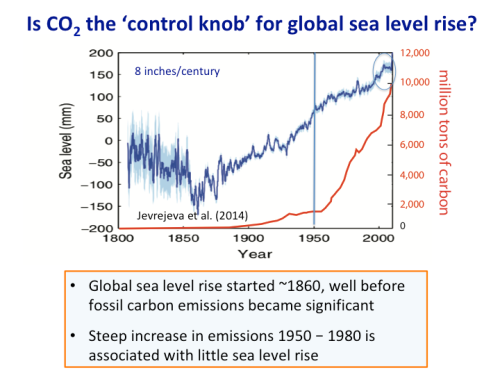
9 Is CO2 the control knob for global sea level rise?
This figure illustrates the challenge of attributing long-term sea level rise to CO2emissions. The blue curve shows sea level change since 1800, measured from tide gauges.
The red curve shows global emissions of carbon dioxide from burning of fossil fuels. You can see that global sea levels were rising steadily long before fossil fuels emissions became substantial. You can also see that the steep increase in emissions following 1950 is associated with very little sea level rise between 1950 and 1990.
An uptick in sea level rise occurred in the 1990’s, which is circled. Lets take a closer look to see what is causing this.
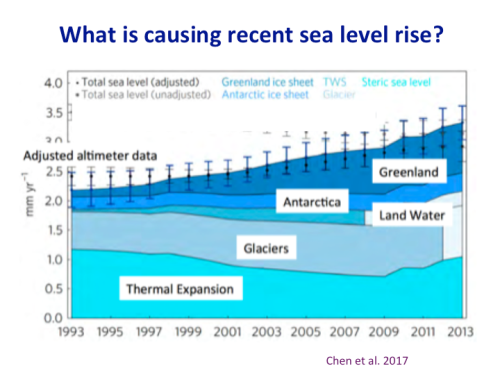
10 What is causing recent sea level rise?
Since 1993, global satellite data have provided valuable information about sea level variations and glacier mass balance. This figure shows a recent analysis of the budget of sea level rise since 1993. You can see that overall the rate of sea level rise has increased since 1993.
What is causing this increase? The turquoise region on the bottom of the diagram relates directly to expansion from warming. You actually see a decrease until about 2009, which has been attributed to the cooling impact following the eruption of Mount Pinatubo in 1992.
What stands out as causing the increase in the rate of sea level rise is the growing contribution from Greenland, which is the dark blue area on top. Hence the recent increase in the rate of sea level rise is caused by Greenland melting.
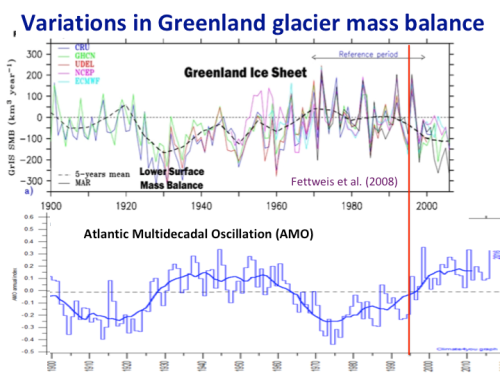
11 Variations in Greenland glacier mass balance
So, is the Greenland melting caused by increasing CO2 emissions?
This figure shows the Greenland mass balance for the 20th century. Ice sheet mass balance is defined as increase from snowfall, minus the decrease from melting. You can see the negative mass balance values after 1995, reflecting mass loss that raises sea level. If you look earlier in the record, you see even larger negative values particularly in the 1920’s and 1930’s. Clearly, the high surface mass loss rates of recent years are not unprecedented, even in the 20thcentury.
Greenland was anomalously warm in the 1930’s and 1940’s. What caused this?
The bottom figure shows variations in the Atlantic Multidecadal Oscillation, which is an important mode of natural internal climate variability. The AMO is a powerful control on the climate of Greenland.
Ingeneral, years with positive AMO index are associated with a mass loss for Greenland, whereas negative AMO index is associated with a mass gain.
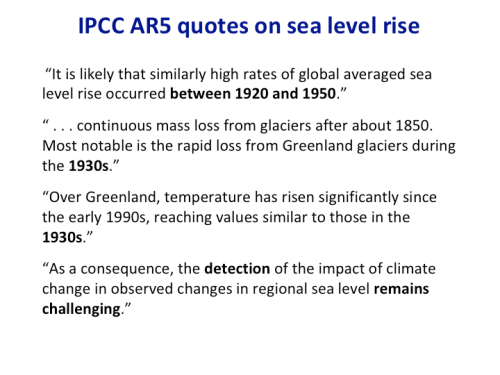
12 IPCC AR5 quotes on sea level rise
From this analysis, I can only conclude that CO2 emissions are not the main cause of sea level rise since the mid 19thcentury.
The scientific evidence that I’ve shown you on the preceding slides is well known to the IPCC. Here are some statements that the most recent IPCC report made on sea level change and Greenland:
"
Thursday, June 14, 2018
Judith Curry on the uncertainty over what caused sea level rise
See The debate: my presentation. Excerpt:
Subscribe to:
Post Comments (Atom)
No comments:
Post a Comment
Note: Only a member of this blog may post a comment.