Wednesday, March 31, 2021

Why Is Everyone in Texas Not Dying?

By Jeffrey A. Tucker. Excerpts:

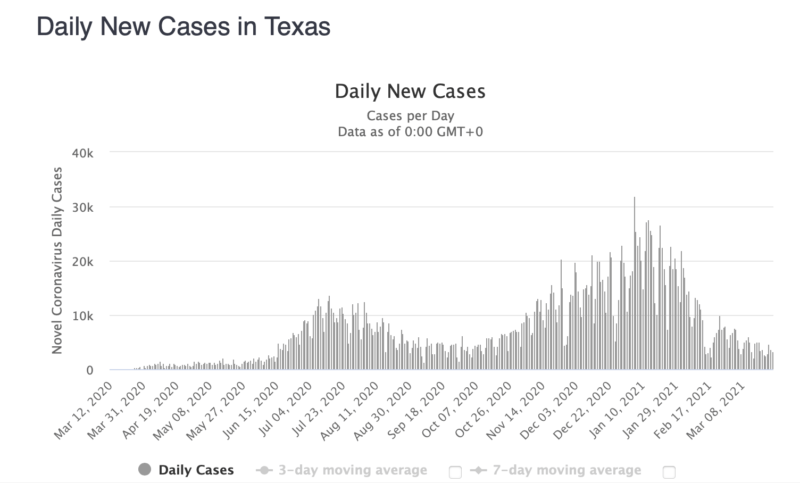
"More than two weeks ago, the governor of Texas completely reversed his devastating lockdown policies and repealed all his emergency powers, along with the egregious attacks on rights and liberties."

"on March 2, 2021, the governor finally said enough is enough and repealed it all."

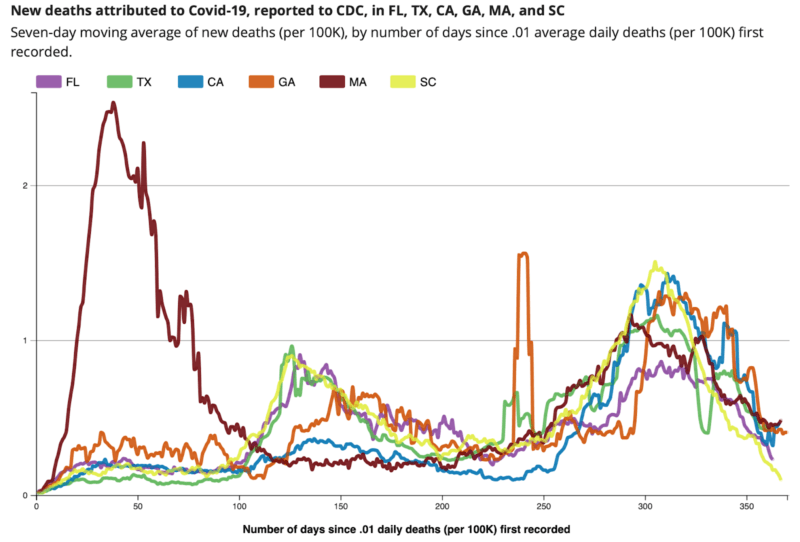
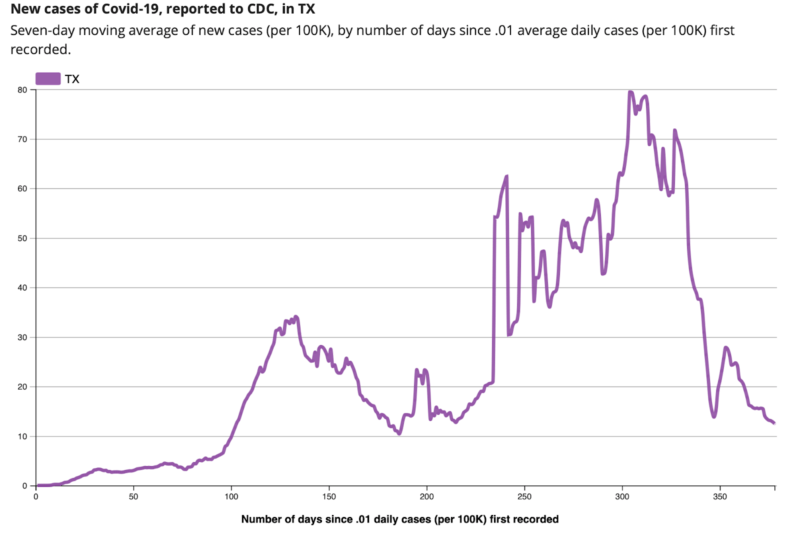
Here are the data. 

The CDC has a very helpful tool that allows anyone to compare open vs closed states. The results are devastating for those who believe that lockdowns are the way to control a virus. In this chart we compare closed states Massachusetts and California with open states Georgia, Florida, Texas, and South Carolina. 

What can we conclude from such a visualization? It suggests that the lockdowns have had no statistically observable effect on the virus trajectory and resulting severe outcomes. The open states have generally performed better, perhaps not because they are open but simply for reasons of demographics and seasonality. The closed states seem not to have achieved anything in terms of mitigation. 

On the other hand, the lockdowns destroyed industries, schools, churches, liberties and lives, demoralizing the population and robbing people of essential rights. All in the name of safety from a virus that did its work in any case. 

As for Texas, the results so far are in.

I’m making no predictions about the future path of the virus in Texas. Indeed for a full year, AIER has been careful about not trying to outguess this virus, which has its own ways, some predictable and some mysterious. The experience has, or should have, humbled everyone. Political arrangements seem to have no power to control it, much less finally suppress it. The belief that it was possible to control people in order to control a virus produced a calamity unprecedented in modern times. 

What’s striking about all the above predictions of infections and deaths is not just that they were all wrong. It’s the arrogance and confidence behind each of them. After a full year and directly observing the inability of “nonpharmaceutical interventions” to manage the pathogen, the experts are still wedded to their beloved lockdowns, unable or unwilling to look at the data and learn anything from them."

90% of worldwide COVID-19 deaths occurred in countries with high obesity rates

See We need to stop overlooking one politically incorrect COVID-19 death factor by Brad Polumbo of FEE. Excerpt:

"The United States has the 13th highest COVID-19 death rate relative to population. Many different factors shaped death rates in the pandemic. But there’s one uncomfortable reason that the U.S. likely experienced more COVID-19 deaths that has largely been ignored because it’s politically incorrect.

Out-of-control obesity rates and the “body positivity” movement predating the pandemic have left the U.S. population disproportionately vulnerable to COVID-19 compared to other countries. The U.S. ranks No. 12 in obesity worldwide, one of the highest rates among developed countries. One study found that 90% of worldwide COVID-19 deaths occurred in countries with high obesity rates.

COVID-19 is much more deadly for the elderly and those with preexisting conditions that weaken the immune system. One of those conditions is obesity. According to the Centers for Disease Control and Prevention, “Adults with excess weight are at even greater risk during the COVID-19 pandemic.” The CDC said that of the roughly 900,000 adult COVID-19 hospitalizations from the start of the outbreak to Nov. 18, 30% were attributed to obesity.

Meanwhile, a new study examining over 150,000 adults across 20 hospitals confirmed that obese people are much more likely to be hospitalized or to die from the virus. Severely obese COVID-19 patients were 61% more likely to die and 33% more likely to face hospitalization than their peers at healthy weights.

Unfortunately, this key factor driving high U.S. death rates has been quietly reported and largely overlooked. In woke culture, it’s considered too politically incorrect to point out that being fat is unhealthy, even as a pandemic is raging across the country and tragically claiming the lives of overweight people.

But the obesity problem in this country is real, even if we’re increasingly too scared to talk about it out loud for fear of being labeled “fatphobic.” According to Harvard’s School of Public Health, two-thirds are overweight, while one-third are “obese.” Meanwhile, among those age 2 to 19, 1 in 3 are overweight or obese.

As COVID-19 lockdowns and restrictions have trapped people in their homes over the last year, many have gained weight. A new American Psychological Association survey showed that 42% gained weight over the last year, an average of 29 pounds."

Free States Faring Far Better Than Lockdown States in One Huge Way, New Data Show

The results are in—and they overwhelmingly vindicate the free states over the authoritarian experiments.

By Brad Polumbo of FEE.

"When COVID-19 first came to our shores, it presented policymakers and elected officials with a crisis like nothing in living memory. In the year since, states have taken markedly different approaches to pandemic policy. Some, like New York, embraced sweeping government lockdowns and top-down mandates while others like Florida and South Dakota took a more humble, hands-off government approach, trusting individuals to make the best decisions for themselves.

The results are in—and they overwhelmingly vindicate the free states over the authoritarian experiments. First, we saw that states with the harshest restrictions didn’t necessarily achieve the best COVID-19 death outcomes. Florida has fared far better than New York and New Jersey, for example, and multiple studies have found no correlation between lockdown stringency and death rates

Yet lockdowns have come at an enormous economic and human cost. We’ve seen mental health problems and child suicide spikes, an increase in domestic violence, an uptick in drug overdoses, and much, much more. And, of course, the economic toll of shutting down businesses and criminalizing “non-essential” livelihoods has been devastating.

The national unemployment rate was a poor if not disastrous 6.2 percent in February. Yet the just-released state-level unemployment rates for last month show that the devastation hasn’t been equal across the board. New Labor Department data reveal that many free states have returned to nearly their pre-pandemic unemployment rateswhile lockdown states dominate the wrong end of the list. 

Hands-off states such as South Dakota, Utah, Nebraska, and New Hampshire top the list with unemployment rates hovering around a stellar 3 percent. States that received enormous flak for eschewing drastic lockdowns like Georgia and Florida both rank in the top 20. Perhaps the only obvious outlier is Texas, which ranks poorly with an unemployment rate of 6.9 percent—but, then again, Governor Greg Abbott only rolled back the remaining restrictions in the Lone Star state earlier this month.  

Meanwhile, the worst 10 states, with unemployment rates from 7 to 9 percent, include lockdown-happy localities like New York, New Jersey, California, Hawaii, Massachusetts, D.C., and Rhode Island. 

There is a clear trend here. Free states have largely avoided the labor market carnage associated with the COVID pandemic, while lockdown states have wrought higher unemployment levels—without guaranteeing better pandemic health outcomes. 

As famed economist Thomas Sowell said, in complex issues of public policy “there are no solutions, there are only tradeoffs.” There was never an easy answer to the COVID pandemic, but the economic, health, and social outcomes of free states all suggest that they made the right call in rejecting the authoritarian instinct embraced by too many of their neighbors."

Electricity choice has brought about great benefits to customers throughout the country

See Are customers losing out with energy choice? by Mike Haugh of R Street.

"It appears it is time to pounce on energy deregulation again; naysayers have been inaccurately using the Enron boogeyman for the last 20 years but have now found a new patsy: Texas. The Wall Street Journal has published two articles that take a shot at retail energy choice. These articles claim millions, or in the case of Texas billions, of dollars were “lost” by customers that chose retail suppliers over the utility default rate. But the comparisons made are not just apples to oranges but in some cases apples to automobiles. Robust apples-to-apples analyses have shown instead that electricity choice has brought about great benefits to customers throughout the country, including innovative forms of retail products while lowering rates for comparable retail products.

Retail Energy Choice

Up until the late 20th century, utility customers had one choice for their electric supply—the utility. Then in the late 1990s, states began to deregulate the supply portion of customers’ bills allowing them to shop for their electric supplier; transmission and distribution remained a “natural monopoly”. Today 14 states and the District of Columbia have statewide residential retail energy choice programs that are bringing the benefits of lower prices and innovation. For example, a 2016 study by Ohio State and Cleveland State demonstrated that Ohio customers saved over $15 billion as a result of choice, and greater savings were projected into the future. Along with these lower prices, innovation has brought about new products and services that are not available through traditional utilities.

Texas

In an effort to pounce on the energy crisis in Texas, The Wall Street Journal published an article criticizing the retail markets and blaming deregulation for the blackouts. Texas is a unique state in that all of its retail electric customers must choose a supplier. These suppliers offer a variety of products including fixed and variable rate products along with time-of-use products. Along with those pricing plans, Texas suppliers also offer smart thermostats, airline miles, cash back offers and more. The article claimed that customers in the deregulated service territories were charged $28 billion more than “were charged to the customers of the state’s traditional utilities.” Not only is the analysis poorly constructed — it is incorrect given that in 2019 the Public Utilities Commission (PUC) of Texas reported to the legislature that “rates in the ERCOT competitive market have decreased by 31% since the transition to the competitive market.” This is a very poor comparison for a number of reasons.

First and foremost, this “analysis” is not comparing the supply portion of the bill that’s subject to competition, but rather the total rate customers are paying for the transmission, distribution and generation of electricity. One cannot say the losses are a result of deregulation. The distribution and transmission systems are still regulated by regulators.

Next, the article is comparing completely different systems. What the article describes as “traditional” electric utilities are municipal power systems and electric cooperatives that are non-for-profit entities and operate much smaller distribution systems. These systems are different in their financial structure and physical footprint than investor-owned utilities, and thus have inherently different cost profiles. Additionally, some of the municipal and cooperatives are not even in the Electric Reliability Council of Texas (ERCOT) system where all of the investor-owned utilities are located. Therefore, the WSJ compares retail rates for entities in entirely different wholesale markets, which is more akin to comparing electric prices in California to Texas. Retail energy markets should be evaluated as they grow, but this evaluation was inaccurate and not as simple as the authors attempt to present.

Other Retail Energy Markets

Last week the WSJ put out a second article criticizing customer savings and marketing activities. Unlike the Texas article, this article has some merit. There are bad actors in the selling of retail energy products, and the article only touches on a few of the cases that have been brought to utility regulators across deregulated states. These bad actors can go hand in hand with some of the high prices that are being paid by customers as a result of sales reps that deceive customers to think they are saving money as their rates are slowly increased over time. This is an issue that must be addressed on the state level, but it is a fine line to walk so as not to overburden the participants that are offering quality products and services to customers.

What must be addressed are the persistent bad actors that work across states and pay their fines, take a break from selling and do it all over again. Lessons must be taught that these types of practices will not be tolerated. Harsh penalties and license cancellations are a good start along with stricter evaluations of initial licensing and renewal applications. States need to look into ways to educate customers better, so they are able to make informed decisions and prevent bad actors from taking advantage of them. Customers must be protected so they can reap the benefits of competitive markets.

But the article also had serious flaws. It claims that retail customers paid $19 billion more than if they would have stayed with their utility, based on another inaccurate analysis. First, the data collected for this calculation was primarily from the U.S. Energy Information Administration (EIA)—which is not accurate for this type of analysis. A group of researchers from Ohio State and Exeter Associates determined EIA data, and specifically the form 826 data used in the WSJ article, provides an incomplete assessment of total customer bills. Other studies have made similar claims using different data. These studies also miss the fundamental premise that there is not a simple comparison between what retail suppliers are providing to customers and the basic product offered by utilities.

In most cases, retail suppliers are offering protection to customers by absorbing the risk of volatile wholesale markets. What was not mentioned in the article is that customers on fixed price contracts in Texas last month were protected from the $9,000-per-megawatt hourly prices; the retail supplier took the risk and protected the customer. These customers probably paid a premium for this service and will be happy for that when they get their bills next month. Such risk management options translate into a variety of different products consumers can select based on their individual risk tolerance. This benefit of retail choice is not part of any generic rate comparison calculation.

The calculation also does not take into account the source of supply, as many customers want renewable energy and are willing to pay more for it. Additionally, suppliers are offering products and services beyond basic electric service; products such as smart thermostats, airline miles and gift cards offer benefits to customers that are not captured in these very basic analyses. Further, retail suppliers offer rate discounts to consumers who voluntarily reduce their consumption when the wholesale system is stressed. Consumers value service reliability to widely varying degrees—orders of magnitude in difference even—and policies that enable retail suppliers to provide greater differentiated reliability products is critical to managing grid emergencies, like those endured in February.

The WSJ should not be faulted for examining the retail markets, as many states have spent considerable time evaluating this issue. The concern with these pieces is that they attempted to capitalize on the crisis that hit Texas by making inaccurate assumptions, which has unfairly tarnished the reputation of retail energy markets. The body of evidence clearly indicates that customers benefit from retail energy markets and policymakers should address legitimate bad actors while enabling the good actors to innovate retail products for the good of consumers and a more resilient grid."

Tuesday, March 30, 2021

A string of vaccine bungles on the Continent threatens health and the global economy

See Europe’s Gang That Couldn’t Shot Straight. WSJ editorial. Excerpt:

"Take the latest fumble first. Various European regulators and politicians spent this week claiming the Oxford/ AstraZeneca vaccine—the only one currently widely available in the EU—might be unsafe, only to rethink and now beg people to start accepting it.

This time the concern was that the jab caused blood clotting or problems with blood platelets in some patients. Some people who received the vaccine developed blood clots, but the European Medicines Agency (EMA) found the vaccine was not associated with an increase in the overall risk.

Among the 11 million or so vaccinated in the U.K., serious clots were less common than would be expected in the general population. People can develop clots for many reasons including other health conditions and medications. Covid-19 can also cause clots, so any risk-benefit calculation favors vaccination.

This is of a piece with a distinctly European safety-ism that has dogged the vaccine program since the start. Introduction of the AstraZeneca jab was held up even after the EMA approved it because bureaucrats in Germany claimed there was no evidence it works in patients older than 65.

Fewer elderly patients were included in the sample during the vaccine’s trial phase, but that’s as far as the truth to this claim went. It was quickly rebutted—real-world evidence available even then from the U.K. showed high efficacy in the older cohort—but not before French President Emmanuel Macron picked up the theme.

Such careless talk deterred vulnerable elderly Europeans from accepting the vaccine last month. It also skewed priority lists. Younger teachers and university professors in Italy received jabs ahead of the ill and elderly under a scheme developed when officials claimed the shot wouldn’t work for the old.

One problem is that no one seems to be fully in charge of monitoring safety and efficacy. Nominally that’s the EMA’s job, and the agency handled it with typical eurocratic aplomb. The EMA’s approval process is more bureaucratic, requiring input from all EU member states. Imagine if the FDA consulted all 50 states.

But national governments also are allowed to make their own safety rulings on an “emergency” basis. The U.K. used this option to approve the Pfizer and AstraZeneca shots quickly despite still being an EU member late last year.

Other governments used this discretion to slow-roll vaccines. EU capitals refused to follow the U.K. in granting emergency-use authorization, apparently for fear of hurting European solidarity. But some governments have been happy to impose unilateral blocks on the vaccine, as with the AstraZeneca clot kerfuffle. European regulators live by the maxim “better safe than sorry,” but in this case they’re getting the sorry with no added safe.

At least now, millions of doses are available for Europeans who do want them. This wasn’t always the case, after procurement bungles delayed deliveries and nearly sparked several trade wars. Brussels officials last year jumped at the chance to push common vaccine procurement to bolster the EU’s credibility with European voters. Buying on behalf of 500 million Europeans also was supposed to give the bloc more leverage with pharmaceutical companies.

It’s been chaos. The EU bureaucracy has little experience with procurement on this scale, and it also struggled to strike bloc-wide deals for ventilators and protective equipment. Brussels officials signed vaccine contracts months after the U.S. and U.K. did last year—and only after some European governments threatened to organize their own procurement.

Washington and London understood that crucial to mass procurement was throwing large amounts of R&D money at many companies in hopes some would work. Brussels focused on haggling down the cost per dose. Europeans pay a few dollars less per dose but ended near the back of the shipment line.

The EU response—a combination of threatened export curbs, noisy commercial disputes with pharma companies, and sour-grapes caviling about imaginary efficacy concerns—has mainly undermined Europe’s credibility on trade issues. It also risks stoking vaccine nationalism and trade restrictions elsewhere."

The NCAA women’s tournament is not self-sustaining

See Women’s March Madness Is Growing in Popularity—and Undervalued by Laine Higgins of The WSJ. Excerpts:

"The women’s basketball tournament doesn’t turn a profit"

"The NCAA declined to say how much revenue the women’s tournament generates, only that it is not self-sustaining. Operating costs for women’s March Madness are considerably lower, as first- and second-round games are typically held on the campuses of higher-seeded teams rather than neutral sites and brackets are drawn up to minimize cross-country travel."

By the end of the 1950s, 98 percent of homes built with F.H.A. support after World War II were occupied by white Americans

See Your Home’s Value Is Based on Racism by Dorothy A. Brown. She is a professor of law at Emory University. Excerpt:

"Between 1940 and 1950 a majority of white Americans became homeowners by riding a wave of anti-Black policies — public and private — that prevented Black families from buying in certain neighborhoods and from taking advantage of F.H.A.-insured loans. By the end of the 1950s, 98 percent of homes built with F.H.A. support after World War II were occupied by white Americans. Black taxpayer dollars were supporting a federal government that was denying them equal treatment.

At the same time that America was solidifying its status as a nation of white homeowners, the post-World War II defense industry was mobilizing and in need of workers. To enable those workers to sell their homes with tax-free gains and move to where the jobs were, the real estate lobby went to work. By 1951, a new tax provision allowed homeowners to avoid paying taxes on gains when they sold their homes, if they purchased a new home of equal or higher value.

Today, if you sell your home at a gain, you can receive up to $500,000 of gain tax-free. If, however, you sell your home at a loss, you get no tax break. (Contrast that with the way the tax law allows losses to be deductible when you sell stock.) John’s $144,000 loss did him no good in terms of taxes. However, if he and his wife sell their Candler Park home, they’ll receive a significant tax-free gain.

So even though it is now illegal to discriminate against Black home buyers, tax subsidies that reward homeowners who sell their homes at a gain and punish those who sell their homes at a loss still disproportionately benefit white homeowners and their preferences — helping far too few Black homeowners along the way. White homeowners win while Black homeowners — particularly those who want Black neighbors — lose."

Up to 90% rise in depression among college students in pandemic's early months, study finds

By Linda Searing of The Washington Post. Excerpt:

"The rate of depression among college students was up to 90% higher in the early months of the coronavirus pandemic, compared with pre-pandemic levels, according to an analysis of how disruptions in students' daily life affected their mental health.

At highest risk for depression were students whose physical activity declined the most in that time period - for instance, being active one to two hours less a day, or dropping from 10,000 to 4,600 steps a day.

At lowest risk were those who maintained their activity level. Published in Proceedings of the National Academy of Sciences, the researchers cited "stark increases in depression" in just a few months, from about 32% to 61% of the 682 students, based on results from standard diagnostic scales. In addition to assessing physical activity, the study also found that stay-at-home orders, campus closures and social distancing led, on average, to students socializing less (to less than 30 minutes a day), sleeping more (by 25 to 30 minutes a night) and doubling their screen time (to more than five hours a day).

Other recent research has found similar mental health effects related to physical fitness. Physical activity is known to help people get and stay strong, energetic and healthy. Its mental health benefits may stem from prompting the release of feel-good brain chemicals, known as endorphins, and from simply taking your mind off the negative thoughts that may be feeding anxiety or depression.

Doctors, parents and students themselves all report an uptick in depression among young people since the pandemic began, restricting life in many ways."

Monday, March 29, 2021

A carbon tax does necessarily hurt the poor

See Carbon Tax Sidelined in Biden’s Push on Climate, Taxes by Greg Ip of The WSJ. Excerpt: 

"But empirical evidence suggests otherwise. California’s carbon market actually narrowed disparities in exposure to particulates, nitrogen oxides and sulfur oxides, according to a study by economists Danae Hernandez-Cortes and Kyle Meng of the University of California, Santa Barbara. An older federal program that allows higher-polluting plants to buy offsets from less-polluting plants didn’t disproportionately move pollution to lower-income communities or communities of color, according to a separate study by Joseph Shapiro and Reed Walker, economists at the University of California, Berkeley.

Whether carbon taxes hurt the poor depends on what is done with the revenue. The Climate Leadership Council estimates its carbon tax would finance $2,000 in carbon dividends a year for a family of four, and the 80% lowest-income families end up better off. Regulatory alternatives aren’t necessarily better: renewable-fuel requirements can raise electricity prices and disproportionately hurt poor families who devote more of their budget to power.

Many Democratic politicos have concluded a carbon tax is a political loser with voters opposing it. The question is, compared with what? Progressives’ beloved Green New Deal polls no better. Mr. Biden and Congress have floated a range of incentives, tax credits, regulations and investments aimed at driving down emissions, many of which, individually, are quite popular. But they’re not enough. A new study by Rhodium Group estimates all such measures, combined, wouldn’t put the U.S. electricity sector on a path to net zero by 2035.

So if Mr. Biden is serious about his emissions targets, a carbon price may become harder to avoid. His administration is already considering taxing imports for their carbon content. Without a similar levy on domestically-made goods, the U.S. could face retaliation from trading partners. He also plans to raise taxes, in part to pay for a big boost to the child tax credit, which slashes child poverty. If he wants a tax that helps the poor, defrays the deficit and combats climate change, there is one waiting in the wings."

Herd Immunity Is Near, Despite Fauci’s Denial

His estimate that it’ll take a 70% to 85% vaccination rate ignores those who have already been infected

By Marty Makary. He is a professor at the Johns Hopkins School of Medicine. Excerpts:

"Anthony Fauci has been saying that the country needs to vaccinate 70% to 85% of the population to reach herd immunity from Covid-19. But he inexplicably ignores natural immunity. If you account for previous infections, herd immunity is likely close at hand.

Data from the California Department of Public Health, released earlier this month, show that while only 8.7% of the state’s population has ever tested positive for Covid-19, at least 38.5% of the population has antibodies against the novel coronavirus. Those numbers are from Jan. 30 to Feb. 20. Adjusting for cases between now and then, and accounting for the amount of time it takes for the body to make antibodies, we can estimate that as many as half of Californians have natural immunity today.

The same report found that 45% of people in Los Angeles had Covid-19 antibodies. Again, the number can only be higher today. Between “half and two-thirds of our population has antibodies in it now,” due to Covid exposure or vaccination, Mayor Eric Garcetti said Sunday on “Face the Nation.” That would explain why cases in Los Angeles are down 95% in the past 11 weeks and the positivity rate among those tested is now 1.7%."

"But after a year of millions of Covid-19 cases in the U.S., it’s clear that reinfections are rare. Natural immunity is real and shouldn’t be ignored."

"KNBC-TV in Los Angeles has a county-by-county vaccine tracker showing a bar graph of the percentage of Californians vaccinated, with the zone 70% to 85% labeled “herd immunity.” Currently, it’s at 26%. The false construct does create a greater urgency for everyone to get vaccinated. But it also creates false justification for continued excessive restrictions on freedom. And it raises the possibility that authorities are misallocating the limited vaccine supply by failing to direct it toward people without natural antibodies."

"A study of antibody prevalence published soon after noted that 14% of New Yorkers had antibodies in September, before the state’s fall and winter surge."

"less than 1% of 6,614 healthcare workers who had Covid-19 developed a reinfection within five months—even though many of them work with Covid patients"

"“Natural immunity after Covid-19 infection is likely lifelong, extrapolating from data on other coronaviruses that cause severe illness, SARS and MERS,” says Monica Gandhi, an infectious-disease physician and professor at the University of California."

Incredible Shrinking Income Inequality

Its rise is an illusion created by the Census Bureau’s failure to account for taxes and welfare

By Phil Gramm and John Early. Excerpts:

"Census Bureau income data fail to count two-thirds of all government transfer payments—including Medicare, Medicaid, food stamps and some 100 other government transfer payments—as income to the recipients. Furthermore, census data fail to count taxes paid as income lost to the taxpayer. When official government data are used to correct these deficiencies—when income is defined the way people actually define it—“income inequality” is reduced dramatically."

"if you count all government transfers (minus administrative costs) as income to the recipient household, reduce household income by taxes paid, and correct for two major discontinuities in the time-series data on income inequality that were caused solely by changes in Census Bureau data-collection methods, the claim that income inequality is growing on a secular basis collapses. Not only is income inequality in America not growing, it is lower today than it was 50 years ago."

"the actual inflation-adjusted income received by the bottom quintile, counting the value of all transfer payments received net of taxes paid, has risen by 300%. The top quintile has seen its after-tax income rise by only 213%."

"the percentage of income in the bottom quintile coming from government payments rose above 90%."

"Excluded from the measurement of household income is some $1.9 trillion of government transfers. These include the earned-income tax credit, whose beneficiaries get a check from the Treasury; food stamps, which let beneficiaries buy food with government issued debit cards; and numerous other programs"

"Households in the top two earned-income quintiles pay 82% of the tax bill"

"When measuring income inequality, however, the Census Bureau doesn’t reduce household income by the amount paid in taxes. Had it done so and counted all transfer payments as income, inequality from 1967 to 2017 would have increased by only 2.3% instead of the reported 21.4%."

"In 1993 and 2013 the Census Bureau changed its methods in an effort to collect better information from high-income households. These changes created two major discontinuities and distorted the time-series so that the change in measured income inequality in those years was as much as 15 times the average annual change found for the entire 50-year period."

"The simple solution would have been to isolate the distortions caused solely by the changes in data-collection techniques and adjusted the previous years’ measures to reflect the effect of the changes."

"income inequality is lower than it was 50 years ago."

Schools Offer Empty Words to Asians

‘We stand together,’ says Harvard’s president. Its admissions office stands accused of discrimination.

By Wencong Fa. Mr. Fa is an attorney with the Pacific Legal Foundation. Excerpt:

"My colleagues and I represent many Asian-American families who have felt the sting of discrimination. One case involves a coalition of Asian-American parents in Fairfax County, including Hanning Chen, who left China to pursue an education in the U.S. and is now a university professor. Mr. Chen’s eldest daughter attends Thomas Jefferson High School, known as TJ. Her younger sister may find the schoolhouse door closed to her.

In December, Fairfax County changed TJ’s admissions policies amid rising sentiment that there were “too many” Asian-American students. The county replaced an objective admissions test with a process calculated to achieve a racially “balanced” student body at the expense of Asian-American applicants. 

Harvard has been sued over its race-conscious admissions policy. The plaintiffs contend that Harvard discriminates by assigning Asian-Americans lower “personal ratings,” which are supposed to denote characteristics like leadership and grit. The Princeton Review has advised Asian-American applicants to refrain from noting that they intend to pursue a career in medicine or major in math or science, lest they appear “too Asian.” The Justice Department brought a similar lawsuit against Yale last year, but the Biden administration dropped it in February.

Other public-school systems engage in similar discrimination to limit Asian-American students’ success. Montgomery County, Md., commissioned a report on how to increase diversity and commit to its “core value of equity.” Its finding that Asian-Americans were “overrepresented” in magnet middle schools led to changes in the admissions process that significantly reduced their numbers.

New York Mayor Bill de Blasio claims the city’s transparent and objective process for admissions to specialized schools such as Stuyvesant, Bronx Science and Brooklyn Tech has led to too many Asian-American students. He called the racial composition of those schools a “monumental injustice.” Mr. De Blasio changed the admissions policy to make it harder for many Asian-American students, many from low-income families, to get in.

A welcome discussion about anti-Asian rhetoric shouldn’t exempt progressive proponents of “equity” and racial balancing. Allison Collins, vice president of the San Francisco Board of Education, once accused Asian-Americans of using “white supremacist thinking to assimilate and ‘get ahead’ ” and called merit-based admissions at Lowell High School “racist” since the school was majority Asian-American."

Sunday, March 28, 2021

Shutdowns were for 45% of the drop in nonrestaurant small-business revenue

See States Reopened, but Covid-19 Fears Threaten to Keep Consumers Away: People’s feelings about the pandemic matter more to potential economic recovery than government orders, research suggests by Jo Craven of The WSJ. 

Given the numbers below, it the headline might be true but it still appears that shutdowns made things alot worse.

Excerpt: 

"a separate study by economists at the Federal Reserve Bank of Chicago explicitly tracked revenue and spending as well as mobility and found something similar.

That study linked county-level stay-at-home orders to cellphone records and consumer spending in the U.S. from March 1 to April 17 of last year."

"They also found that mobility measures didn’t fully capture the drop in spending caused by lockdown restrictions.

Shutdowns were responsible for 16% of the drop in visits to nonessential businesses, the study found, but 24% of the drop in restaurant revenue and 45% of the drop in nonrestaurant small-business revenue."

Where’s the Science Behind CDC’s 6-Foot Social-Distance Decree?

The new limit for schools is 3 feet. But the public is in the dark about the basis of these recommendations

By Scott Gottlieb. Excerpt:

"More distance is always better when it comes to contagion. But the 6-foot directive might have been the single costliest measure CDC has recommended, which have been largely followed over the past year. So what science went into making—and, more important, sustaining—the recommendation?

Nobody knows for sure. Most agree the guideline derives from a belief that Covid is largely spread through respiratory droplets, like flu. Old studies suggest that larger respiratory droplets are unlikely to travel more than 6 feet, and therefore close contact with an infected person is the primary mode of exposure. This research was hardly conclusive, but by most accounts it formed the basis for the initial Covid recommendations. More-recent research shows that the novel coronavirus can also spread through airborne particles, known as aerosols, especially indoors.

Most planning for a pandemic prepared for a bad flu outbreak. Given how little was known about Covid, it was reasonable to base early assumptions on the flu blueprint. But this doctrine wasn’t revisited as more data became available about the novel coronavirus. The reliance on a flu model caused public-health authorities to underestimate and overestimate Covid in important ways.

They overestimated the role of contaminated surfaces. Some Americans are still wiping down their groceries before bringing them inside. One consequence is that we were slow to recognize the extent of asymptomatic spread. The effort dedicated to scrubbing surfaces wasn’t spent improving air ventilation and filtration, which would have had a greater effect. On the other hand, because of the assumption that Covid spread primarily through droplets and not through smaller aerosols, we underestimated the protective role of wearing high-quality masks.

Experts were trying to protect Americans, and we can’t blame them for being wrong in the absence of good information. The question is whether there is an effective process for establishing these measures and re-evaluating them as new information emerges. Science isn’t a set of unchanging truths handed down by a government agency."

Universal Basic Income Hype: A ballyhooed study proves much less than advertised

WSJ editorial.

"Perhaps you’ve heard that a universal basic income is an idea whose time has come. Liberals are hyping the supposed success of UBI from a small experiment in Stockton, Calif. On closer scrutiny, it looks like a case study in politics influencing academic research.

The idea behind UBI is to provide a base level of unconditional cash to everyone. Milton Friedman once suggested that a quasi-UBI in the form of a negative income tax would be a more efficient way to alleviate poverty than the social welfare bureaucracy.

Yet now liberals want a UBI not to replace welfare programs, but to supplement them. Congress’s pandemic checks and potpourri of refundable tax credits, including $3,600 for each child under age 6, are essentially a UBI. Democrats want to make these handouts permanent, and in support they’re touting a recent study of a small privately funded experiment in Stockton. “Study: Employment rose among those in free money experiment,” an AP headline declared.

Not quite. The study randomly selected 125 Stockton residents from low-income neighborhoods and gave them $500 a month on a prepaid debit card. Another 200 residents served as the control group. Asian/Pacific Islanders and homeowners comprised a larger share of the debit-card recipients than of the control group , which could have biased the results.

The study’s small sample and reliance on self-reported outcomes are bigger problems. It’s difficult to assess a statistically significant effect on employment among such a small group over a one-year period—from Feb. 2019 to Feb. 2020—especially given high labor-market turnover among lower earners.

Full-time employment rose in both groups but was slightly lower among the free-cash recipients at the beginning and slightly higher at the end. Hence the study cagily concludes: “Unconditional cash enabled recipients to find full-time employment” (our emphasis)—not that it actually increased employment. Most media ignored this nuance.

Students of incentives might also point out that people receiving free cash might be more likely to claim they are working even if they’re not. In any case, the unconditional Stockton cash grants are temporary, and there’s a graver risk that recipients would drop out of the labor force if the grants were made permanent.

The study says free-cash recipients were virtuous, and “less than 1% of tracked purchases were for tobacco and alcohol.” But about 40% of the money loaded onto their prepaid debit cards was either transferred to a pre-existing bank account or withdrawn as cash. Researchers don’t know how this money was spent.

The researchers were promoting UBI on their Twitter feeds less than halfway through the experiment. One claimed “it’s embarrassingly straightforward, without #guaranteedincome, you get a guaranteed recession.” Their progressive bias is transparent.

They conclude that even UBI is “not nearly enough,” and they also want a higher minimum wage, universal child care, and rental assistance, among other income transfers. The left wants to obliterate Congress’s 1996 bipartisan reform that linked welfare to work, and they’re well on their way."

States of Budget Surplus: The Biden spending bill will have governors swimming in cash

WSJ editorial.

"Governors—especially from Democratic states—have been pleading revenue poverty since the pandemic began. But as we approach the anniversary of Covid-19 in America, that tall tale is becoming more difficult to sell.

Even the left-tilting media are beginning to figure out what we’ve been reporting for some time. One of our sources is Dan Clifton, of Strategas Research Partners, who has been tracking state revenue trends and Covid relief from the beginning. His latest analysis shows that state revenues have been doing far better than advertised, especially states that have kept their economies largely open.

He estimates that a majority of the 50 states are seeing revenues arrive above their pre-Covid levels despite the 2020 economic damage. The big exceptions are states that had the most restrictive business lockdowns (New York), those that rely on sales taxes and have no income tax (Florida and Texas), and those that depend on travel and tourism (Nevada).

Add the $350 billion windfall that will soon flow to state and local governments from the $1.9 trillion Biden relief bill, and the states will be swimming in cash. Mr. Clifton projects that the states overall will have a combined budget surplus. The federal aid formula would provide an average of 20% of all state tax revenue.

You won’t hear this from most governors, who still want a handout from the feds. But the telltale sign is that many of the most spendthrift politicians are making no effort to cut spending or reform their governments.

The data support those who argue that state and local governments don’t need the Biden windfall, and certainly not $350 billion."

Saturday, March 27, 2021

Matt Ridley on Europe's Bad Covid Vaccine Policy

See The EU's petty isolationism is wrecking Europe: Like the Ming empire before it, bureaucratic tyranny is immiserating a beautiful and cultured place.

"There is something rather apt in the coincidence of an Italian ban on vaccine exports to Australia and the negotiation by Liz Truss, the trade secretary, of lower tariffs on trade with the United States. One is as pure a demonstration of spiteful EU protectionism as one could imagine; the other a clear demonstration of mutual gains from freer trade.

Supporting Brexit used to be difficult to explain to foreigners. I remember a Mexican friend flatly refusing to believe I voted for it. “Surely you are joking,” he said, finding it hard to imagine me as a racist, isolationist xenophobe – the only kind of Brexiteer recognised by CNN, the Economist and the New York Times.

Not now, not after the vaccine fiasco; now it is easy to explain Brexit. Britain signed up early to buy the Oxford-Astrazeneca vaccine and approved it swiftly. The EU’s leaders: first, accused us of cutting corners on safety, thus encouraging anti-vax nonsense; second, found themselves at the back of the queue after incompetently negotiating a bad deal; third, took an age to approve it in a display of astounding bureaucratic lethargy; fourth, castigated AstraZeneca for failing to give in to pressure to allow them to jump the queue; and fifth, tried to impose a hard border in Ireland just to stop the Northern Irish getting vaccines. These are not the actions of an ally and friend.

In part two, despite wanting the vaccine so badly they were prepared to tear up contracts and treaties, in a fit of pique at the fact that it was British, Emmanuel Macron and Angela Merkel started speculating falsely that the Oxford vaccine was ineffective in the elderly, thus putting their population off it so much that millions of doses accumulated unused. And now Mario Draghi stops exports of this supposedly unsafe and ineffective vaccine. Has there ever been a more petty – and contradictory – display of populist isolationism? Donald Trump must be open-mouthed with envy.

The funniest take on this came from the Liberal Democrat MP Layla Moran, who argued that if we had stayed in the EU we would have ensured that it did a better deal on vaccines. This argument managed simultaneously to sound arrogant, make the case for Brexit and exaggerate our past influence in Brussels. When a Dutch friend reprimanded me for Brexit a few years ago, saying that Britain’s influence was much valued by northern Europeans, so it was irresponsible of us to leave, I responded: “Then why did you not try harder to listen to us when we requested reform?”

This is not a cause for rejoicing. It was no fun being locked in a continental cupboard with people who thought in such a Napoleonic way, but it is not much fun being their near neighbours either. Back in December, we recalled Parliament to ratify the trade “and cooperation” agreement with the EU. They have not had the courtesy to ratify it yet, in March.

Here is a beautiful and cultured continent being run as if it was the Ming empire: with mandarins deciding what should be done and how, with the same inflexible rules in every corner, with a distrust of enterprise and innovation, and with a mercantilist, zero-sum approach to trade that beggars both belief and neighbours.

At the time when the early Ming emperors were stifling China’s prosperity with centralised bureaucratic tyranny, backward Europe was transformed into the world’s most innovative and wealthy continent. It did so precisely by not being unified and centralised: by being a quilt of different countries so that entrepreneurs, inventors and artists could shop around for a congenial regime, as David Hume was the first to argue.

China, he wrote in 1742, was one vast empire, governed by one law so “none had courage to resist the torrent of popular opinion. And posterity was not bold enough to dispute what had been universally received by their ancestors.” By contrast, Europe was “broken by seas, rivers, and mountains” and so was “naturally divided into several distinct governments” to the benefit of enlightenment.

In harmonisation lies stagnation: innovation comes from variety. Britain must not be afraid to be different: to offer alternative opportunities, smarter regulation, divergent priorities. That is not a hostile act toward the European Union: it would be good for them too. In differentiation lies the chance to experiment and find opportunities for mutual gains, mutual recognition and mutual respect."

‘Equal Pay Day’ this year is March 24 — the next ‘Equal Occupational Fatality Day’ won’t be until May 9, 2031

By Mark Perry.

"Every year the National Committee on Pay Equity (NCPE) publicizes “Equal Pay Day” to bring public attention to the gender earnings gap. According to the NCPE, “Equal Pay Day” falls this year tomorrow on Tuesday, March 24 based on an approximate 20% difference in unadjusted, raw median annual earnings according to the Census Bureau. Tomorrow’s “feminist day of grievance” therefore allegedly represents how far into 2021 women will have to continue working to earn the same income that their male counterparts and co-workers earned in 2020, supposedly for working side-by-side with men doing the exact same job working the exact same number of hours per week with the same education and the exact same number of years of continuous, uninterrupted work experience. 

Inspired by Equal Pay Day, I introduced “Equal Occupational Fatality Day” in 2010 to bring public attention to the huge gender disparity in work-related deaths every year in the United States. “Equal Occupational Fatality Day” tells us how many years and days into the future women will be able to continue to work before they will experience the same number of occupational fatalities that occurred for men in the previous year.

Last December, the Bureau of Labor Statistics (BLS) released final data on workplace fatalities in 2018, and a new “Equal Occupational Fatality Day” can now be calculated. As in previous years, the top graphic above shows the significant gender disparity in workplace fatalities in 2019: 4,896 men died on the job (91.8% of the total) compared to only 437 women (8.2% of the total). The “gender occupational fatality gap” in 2019 was again considerable — more than 11 men died on the job for every woman who died while working.

Based on the BLS data for 2019 for workplace fatalities by gender (and assuming those figures will be approximately the same in 2020), the next “Equal Occupational Fatality Day” will occur ten years from now ­­– on May 9, 2031. That date symbolizes how far into the future women will be able to continue working before they experience the same loss of life that men experienced in 2020 from work-related deaths. Because women tend to work in safer occupations than men on average (frequently reflected in lower wages), they have the advantage of being able to work for a decade longer than men before they experience the same number of male occupational fatalities last year.

Economic theory tells us that the “gender occupational fatality gap” explains part of the “gender earnings gap” because a disproportionate number of men work in higher-risk, but higher-paid occupations like iron and steelworkers (97.8% male) roofers (97.4% male), construction trades (96.6%) and electric power line workers (95.9% male); see BLS data here. The bottom chart above shows that for the 10 most dangerous US occupations in 2019 based on fatality rates per 100,000 workers by industry and occupation men represented more than 90% of the workers in nine of those 10 occupations (all except “Farmers and Ranchers”) and more than 96% of the workers in five of the 10 occupations.

On the other hand, women far outnumber men in relatively low-risk industries, sometimes with lower pay to partially compensate for the safer, more comfortable indoor office environments in occupations like office and administrative support (70.9% female), education, training, and library occupations (73.6% female), and healthcare (75.4% female). The higher concentrations of men in riskier occupations with greater occurrences of workplace injuries and fatalities suggest that more men than women are willing to expose themselves to work-related injury or death in exchange for higher wages. In contrast, women on average, more than men, prefer lower-risk occupations with greater workplace safety and are frequently willing to accept lower wages for the reduced probability of work-related injury or death. The reality is that men and women demonstrate clear gender differences when they voluntarily select the careers, occupations, and industries that suit them best, and those voluntary choices contribute to differences in earnings that have nothing to do with gender discrimination.

Bottom Line: Groups like the NCPE use “Equal Pay Day” to promote a goal of perfect gender pay equity, probably not realizing that they are simultaneously advocating a significant increase in the number of women working in higher-paying, but higher-risk occupations like roofing, construction, farming, and mining. The reality is that a reduction in the gender pay gap would require gender parity by occupation, and would therefore come at a huge cost: several thousand more women will be killed each year working in dangerous occupations.

Further, the proponents of “Equal Pay Day” are promoting a statistical falsehood by suggesting that women working side-by-side with men in the same occupation for the same company are making something like 20% less than their male counterparts, which causes them to have to work an additional three months to achieve “equal pay.” The NCPE’s statement that “because women earn less, on average than men, they must work [20%] longer for the same amount of pay,” implies that gender wage discrimination is the only factor behind the gender pay/earnings gap. Of course, that would imply that some corrective action by government is necessary to address the gender pay gap, even though most studies find that there is no gender earnings gap after factors like hours worked, child-birth and child care, career interruptions, and individual choices about industry and occupation are considered. For example, a 2009 study by the Department of Labor concluded:

This study leads to the unambiguous conclusion that the
differences in the compensation of men and women are the result of a multitude of factors and that the raw wage gap should not be used as the basis to justify corrective action. Indeed, there may be nothing to correct. The differences in raw wages may be almost entirely the
result of the individual choices being made by both male and female
workers.

Conclusion: I hereby suggest, that after adjusting for all factors that contribute to gender differences, “Equal Pay Day” actually fell during the first week of this year. Or maybe the second week of January…. but NOT the fourth week of March. Women should be embarrassed by the statistical fairy tale that is annually promoted on their behalf by NCPE’s “Equal Pay Day.” The annual “Feminist Victimology Day” suggests that widespread and unchecked gender discrimination in the labor market burdens them with three months of additional work to earn the same amount as their male counterparts earned in the previous year – when that’s not even remotely true.

Finally, here’s a question I pose to the NCPE every year: Closing the “gender earnings gap” can really only be achieved by closing the “occupational fatality gap.” Would achieving the goal of perfect earnings equity really be worth the loss of life for thousands of additional women each year who would die in work-related accidents?

Related: From the Wall Street Journal‘s editorial last year “Equal Death Day“:

Last Tuesday was “Equal Pay Day.” This unofficial holiday was first declared in 1996 to protest the “wage gap” between the sexes. In the latest data, according to proponents, American women who work full time earned only 80 cents for each $1 earned by men. Hence, to catch up with a man’s pay from 2018, a woman must keep working until roughly April 2.

The problem with comparing this raw, aggregate data is well documented. Women on average go into lower-paying fields, such as education. Mothers are likelier than fathers to choose flexibility over career advancement. Men tend to work slightly more hours on the job.

………

The broader point is that humanity is complicated. Millions of men and women make their own choices about which careers, jobs and family structures will work best for them. Who but a committed social engineer could demand that their median pay precisely match?

Related: Here’s a quote from Camile Paglia in 2013 writing in TIME (“It’s a Man’s World and It Always Will Be“) about men’s important, but mostly underappreciated role in the labor market and the importance of their willingness to do the dangerous work that makes us all better off:

Indeed, men are absolutely indispensable right now, invisible as it is to most feminists, who seem blind to the infrastructure that makes their own work lives possible. It is overwhelmingly men who do the dirty, dangerous work of building roads, pouring concrete, laying bricks, tarring roofs, hanging electric wires, excavating natural gas and sewage lines, cutting and clearing trees, and bulldozing the landscape for housing developments. It is men who heft and weld the giant steel beams that frame our office buildings, and it is men who do the hair-raising work of insetting and sealing the finely tempered plate-glass windows of skyscrapers 50 stories tall.

Every day along the Delaware River in Philadelphia, one can watch the passage of vast oil tankers and towering cargo ships arriving from all over the world. These stately colossi are loaded, steered and off-loaded
by men. The modern economy, with its vast production and distribution network is a male epic, in which women have found a productive role — but women were not its author. Surely, modern women are strong enough now to give credit where credit is due!

Related: “The ’77 Cents on the Dollar’ Myth About Women’s Pay,” my Wall Street Journal op-ed with Andrew Biggs in 2014:

While the BLS reports that full-time female workers earned 81% of full-time males, that is very different than saying that women earned 81% of what men earned for doing the same jobs, while working the same hours, with the same level of risk, with the same educational background and the same years of continuous, uninterrupted work experience, and assuming no gender differences in family roles like child care. In a more comprehensive study that controlled for most of these relevant variables simultaneously—such as that from economists June and Dave O’Neill for the American Enterprise Institute in 2012—nearly all of the 23% raw gender pay gap cited by Mr. Obama can be attributed to factors other than discrimination. The O’Neills conclude that, “labor market discrimination is unlikely to account for more than 5% but may not be present at all.”

These gender-disparity claims are also economically illogical. If
women were paid 77 cents on the dollar, a profit-oriented firm could
dramatically cut labor costs by replacing male employees with females. Progressives assume that businesses nickel-and-dime suppliers,
customers, consultants, anyone with whom they come into contact—yet ignore a great opportunity to reduce wages costs by 23%. They don’t
ignore the opportunity because it doesn’t exist. Women are not in fact
paid 77 cents on the dollar for doing the same work as men.

and “Equal Pay Day Commemorates a Mythical Gender Pay Gap” my Real Clear Markets op-ed with Andrew Biggs in 2017:

Proponents of the gender pay gap myth would have you believe that any difference in earnings between men and women is the result of gender pay discrimination. The reality is that men and women are different – they gravitate to different college majors, they have different levels of work experiences, they play different family roles, and they often work in very different types of jobs. It would be inexplicable to imagine that despite those many differences men and women would earn precisely the same amounts. It would also be completely unrealistic to suggest that the 20% difference in annual earnings is exclusively or even largely the result of gender discrimination. But to celebrate Equal Pay Day, those are some of the statistical fairy tales that you have to accept."

Friday, March 26, 2021

COVID Relief: Where Did All That Money Go?

By Craig Eyermann of the Independent Institute.

"One year ago, Americans began getting far more first-hand experience with a viral epidemic than any wanted.

One year later, the U.S. government has spent $6 trillion to provide relief from the coronavirus pandemic.

Of that total, $37 billion was spent on Operation Warp Speed’s development of several vaccines. The vaccines are the main benefit that Americans will receive out of $6 trillion of COVID relief spending. That’s because once enough Americans have been vaccinated, the threat of the coronavirus will dissipate. Life can and will go back to normal.

The Operation Warp Speed vaccines, therefore, account for 0.6% of the total cost of COVID pandemic relief, but the lion’s share of the benefits for Americans.

Where Did the Other 99.4% of the Money Go?

By and large, most of the other money goes to cover the cost of mistakes made by state and local politicians. Specifically, because of the lockdown measures they adopted.

The lockdowns they mandated cost millions of people their jobs. The lockdowns they imposed wrecked entire industries. The lockdowns they promised would save lives, but which have yet to show they have, despite having had a year to prove it. The lockdowns require a massive bailout by the federal government to cover the cost of their ongoing damage.

In trying to compensate for those mistakes, the federal bailout has been wasteful. More than $200 billion is suspected to have been lost to unemployment fraud. If you dig deeper, as in California, you find state government bureaucrats enabled that fraud on a massive scale. Multiplied across the nation, unemployment fraud has been five times more costly than the entire cost of the Operation Warp Speed vaccine program.

But there’s more to wasteful spending than just fraud.

The Scale of Spending and Waste

The Foundation for Economic Education’s Brad Polumbo describes the scale of the federal government’s COVID spending and where it is being spent with the least benefit:

The sheer immensity of this spending is hard to grasp. For context, $6 trillion is more than one-fourth of what the US economy produces in an entire year, according to Fox Business. The COVID spending blowout is at least eight times bigger than the (inflation-adjusted) price tag of President Franklin Delano Roosevelt’s “New Deal.”

Moreover, the COVID spending bills have all lost huge sums of money to unrelated carve-outs, politician pet projects, corporate bailouts, fraud, waste, and worse.

In the latest $1.9 trillion package, more than 90 percent of the spending is not directly related to containing COVID-19. Only 1 percent of the money, about $15 to $20 billion, is spent on vaccines. Meanwhile, hundreds of billions go to bailing out poorly managed state governments’ budget holes that predate the pandemic and $86 billion rescues failing pension plans. Meanwhile, billions more go to Obamacare expansion and subsidizing public schools long after the pandemic.

And that’s just scratching the surface.

Polombo estimates the federal government’s $6 trillion in COVID spending could have $18,181 checks for each individual American. How much did you and the rest of the members of your household receive in COVID aid and benefits?

If it’s less than $18,181 per person in your household, you’ve been shafted. Much of the money your household isn’t getting is benefiting the people who did the most damage requiring relief. Shouldn’t we get accountability from them in return for the disproportionate rewards they are now receiving for their lockdowns?"

Sweden Saw Lower Mortality Rate Than Most of Europe in 2020, Despite No Lockdown

New data from Europe suggest Sweden's laissez-faire approach to the pandemic was far from catastrophic.

By Jon Miltimore of FEE

"Few people in 2020 came under more heat than Anders Tegnell, Sweden’s top epidemiologist.

But the man who forged Sweden’s laissez-faire approach to COVID-19 early in the pandemic says new international data reveal a hard truth about government lockdowns.

“I think people will probably think very carefully about these total shutdowns, how good they really were,” Tegnell told Reuters in a recent interview. “They may have had an effect in the short term, but when you look at it throughout the pandemic, you become more and more doubtful.”

Tegnell was referring to data published by Reuters that show Sweden, which shunned the strict lockdowns embraced by most nations around the world, experienced a smaller increase in its mortality rate than most European countries in 2020.

Preliminary data from EU statistics agency Eurostat compiled by Reuters showed Sweden had 7.7% more deaths in 2020 than its average for the preceding four years. Countries that opted for several periods of strict lockdowns, such as Spain and Belgium, had so-called excess mortality of 18.1% and 16.2% respectively.

Twenty-one of the 30 countries with available statistics had higher excess mortality than Sweden. However, Sweden did much worse than its Nordic neighbours, with Denmark registering just 1.5% excess mortality and Finland 1.0%. Norway had no excess mortality at all in 2020.

For nearly a year, Sweden was at the forefront of the debate over how governments should respond to the coronavirus.

Reports last April showed that despite widespread criticism for not embracing a full government lockdown, COVID-19 had reached what Tegnell described as a “plateau” in Sweden.

“If Tegnell’s characterization turns out to be true, it will be quite a vindication for Sweden, which has been widely denounced for bucking the trend among governments of imposing draconian ‘shelter-at-home’ decrees that have crippled the world economy and thrown millions out of work,” Bloomberg reported.

Months later, data showed that Sweden had successfully “flattened the curve” in contrast to many other global hot spots.

Many critics countered by comparing Sweden’s death rate to its Nordic counterparts Norway and Finland, which had some of the lowest mortality rates in Europe. Norway and Finland, however, embraced policies even less restrictive than Sweden's for most of the pandemic.

Public health experts in Sweden say the latest data are further evidence that Sweden was one of the few nations to get the virus right. "Some believed that it was possible to eliminate disease transmission by shutting down society,” said Johan Carlson, Director, Public Health Agency of Sweden. “We did not believe that and we have been proven right.”

Pandemics are awful and COVID-19 is a nasty virus. (I had it recently myself, and it was no picnic. I was severely sick for days.) But lawmakers around the world made two severe miscalculations when they decided to discard fundamental liberties and embrace lockdowns.

First, they concluded that they could contain a virus through central planning. They failed—as numerous academic studies show.

Second, policymakers forgot the basic reality of tradeoffs, something economist and political scientist James Harrigan recognized early in the pandemic.

In times of crisis, people want someone to do something, and don’t want to hear about tradeoffs. This is the breeding ground for grand policies driven by the mantra, “if it saves just one life.” New York Governor Andrew Cuomo invoked the mantra to defend his closure policies. The mantra has echoed across the country from county councils to mayors to school boards to police to clergy as justification for closures, curfews, and enforced social distancing.

Rational people understand this isn’t how the world works. Regardless of whether we acknowledge them, tradeoffs exist.

What Harrigan and Davies were getting at is that policies don’t always work as planned. They often come with a host of unintended consequences, which can be adverse or even destructive.

“Every human action has both intended and unintended consequences,” Antony Davies and James Harrigan explained. “Human beings react to every rule, regulation, and order governments impose, and their reactions result in outcomes that can be quite different than the outcomes lawmakers intended.”

One reason Sweden saw a lower mortality rate than most of its European counterparts is because its leaders recognized this. As a result, Sweden avoided much of the collateral damage associated with lockdowns, which includes economic distress, increased suicide, depression from social isolation, drug and alcohol abuse, and other adverse public healtth consequences.

America did not. For example, the US saw mental health hit a 20-year low last year. The CDC reports surging depression in young people. There have been spikes in suicide, drug overodoses,

Globally, we’ve seen similar trends. Child suicide is surging around the world, physicians recently told the Associated Press.

“This is an international epidemic, and we are not recognizing it,” said Dr. David Greenhorn, who works in the emergency unit at England’s Bradford Royal Infirmary. “In an 8-year-old’s life, a year is a really, really, really long time. They are fed up. They can’t see an end to it.”

This is heart-wrenching. It’s also maddening because top US public health acknowledged early in the pandemic that extended lockdowns could cause “irreparable damage.”

"We can't stay locked down for such a considerable period of time that you might do irreparable damage and have unintended consequences, including consequences for health," Dr. Anthony Fauci, the nation's top infectious-disease expert, told CNBC last year.

Fauci was right. Unfortunately, unlike Tegnell, he didn’t have the courage of his convictions. And Americans paid the price."

Thursday, March 25, 2021

Elizabeth Warren's and Bernie Sanders' 'Wealth Tax' Would Be Terrible for Low-Income Workers

And it has failed in almost every country where it's been tried

By Veronique de Rugy.

"With Democrats now in control of the House, Senate, and White House, many of the most significant policy battles of the next two years will be determined by intraparty fights within the Democratic Party's various factions.

Although not a moderate in any meaningful sense, President Joe Biden has always positioned himself strategically at the center of his party. Nevertheless, his defeat of the party's left wing in the last presidential primary won't be the end of a populist insurgence. Sadly, one fight will be between those, such as Treasury Secretary Janet Yellen, who want to raise taxes significantly, and those who, like Sen. Bernie Sanders (I–Vt.), want to raise taxes even more significantly.

Sen. Elizabeth Warren (D–Mass.) would prefer the latter and has reintroduced her proposal for destructive wealth taxation. Her tax would impose a 2 percent annual levy on wealth over $50 million, going up to 3 percent for wealth over $1 billion. This purely class-warfare scheme is advertised as a way to close the U.S. wealth gap.

My Mercatus Center colleague Jack Salmon and I recently published a paper that looks at the economic literature on this issue to evaluate the arguments of wealth tax proponents. We found that they generally exaggerate wealth inequality in the United States, overestimate the potential revenue a wealth tax would raise, and minimize the negative impact of such a levy.

In a study done for the Center for Freedom and Prosperity, Rice University economists John Diamond and George Zodrow examined the expected impact of Warren's previously proposed wealth tax (a 2 percent annual tax on wealth over $50 million, rising to 6 percent for wealth over $1 billion). They found long-run GDP loss of 2.7 percent, thanks in large part to a 3.7 percent decline in the capital stock. Economists Douglas Holtz-Eakin and Gordon Gray of the American Action Forum also found that Warren's wealth tax would cost workers 60 cents of earnings for every dollar of revenue raised, or approximately $1.2 trillion in lost earnings over the first 10 years.

If you're skeptical of economic predictions, consider that these scenarios have already played out in the real world. A detailed analysis by the Tax Foundation shows that while many Organization for Economic Cooperation and Development (OECD) countries have tried a wealth tax, only five of those countries still have one today.

Wealth taxes weren't widely abandoned because these governments suddenly embraced free-market principles. Instead, implementing the tax put reality on a collision course with the same theoretical myths now being spread in the United States. These taxes don't rake in the revenue or solve the supposed problem of inequality. For starters, wealth taxes aren't paid by rich people who reduce their consumption as a consequence. They reduce their investments, which reduces capital formation, which slows productivity and wage growth. In other words, wealth taxes may be originally paid by wealthy folks, but the economic burden falls heavily on workers.

Previous wealth taxes also triggered capital flight to other countries, which explains the relatively small amount of revenue actually collected. Declining capital stocks then slowed economic growth and depressed overall tax revenues. The Tax Foundation notes, "Among those five OECD countries collecting revenues from net wealth taxes, revenues made up just 1.2 percent of total revenues on average in 2019." And high administrative costs due to a more complex tax made even the little bit of revenue raised unappealing. That's why so many countries gave up.

Preventing the inevitable capital flight that follows the imposition of a wealth tax would require authoritarian measures. Indeed, to go hand in hand with his proposed wealth tax last time around, Sanders called for the creation of a "national wealth registry," a major expansion of the Internal Revenue Service, and the imposition of an "exit tax" that would confiscate 40 percent of a rich person's wealth under $1 billion and 60 percent over $1 billion if they renounce their citizenship and try to escape the tax. Is this the world we really want to live in?

I'm sure Biden is under tremendous pressure to acquiesce to these progressive demands. He also needs loads of revenue for his big spending plans. He must resist. History tells us that he won't raise much money from a wealth tax, and he won't even deliver on a class warfare agenda, since workers will pay the price at a time when they can least afford it."

Bigger Government Will Reduce Living Standards According to New CBO Research

By Dan Mitchell.

"I’ve been warning that the United States should not copy Europe’s fiscal policy, largely because living standards are significantly lower in nations with large welfare states.

That’s true if you look at average levels of consumption in different nations, but the most compelling data is the fact that lower-income people in the United States generally enjoy living standards that are equal to or even higher than those for middle-class people in most European countries.

A bigger burden of government is not just a theoretical concern. President Biden has already pushed through a $1.9 trillion spending bill that includes some temporary provisions – such as per-child handouts – that, if made permanent, could add several trillion dollars to the burden of government spending.

And the White House has signaled support for $3 trillion of additional spending for items such as infrastructure, green energy, and other boondoggles.

This doesn’t even count the cost of other schemes, such as the “public option” that would strangle private health insurance and force more people to rely on an already-costly-and-and bankrupt government program.

So what will it mean for America if our medium-sized welfare state morphs into a European-style large welfare state?

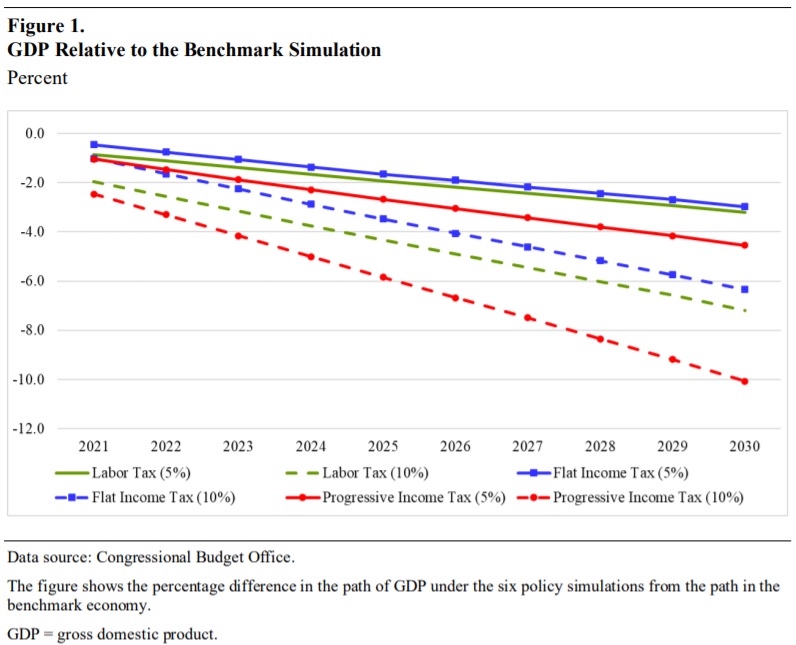
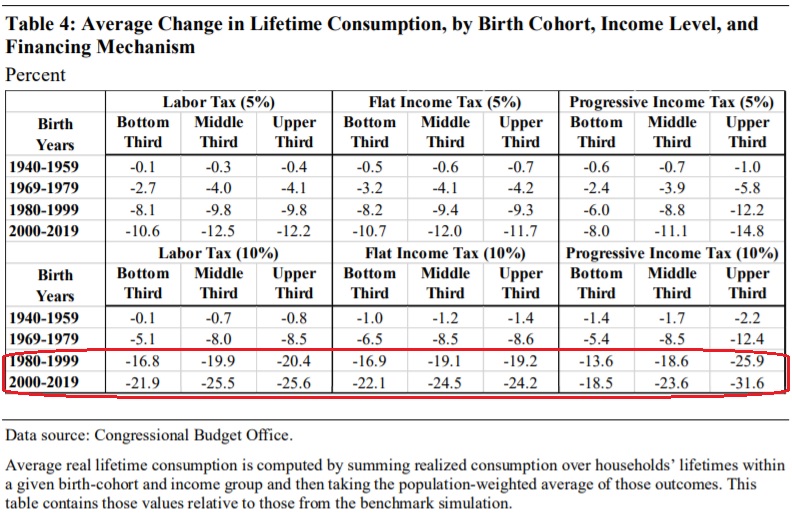
The answer to that question is rather unpleasant, at least if some new research from the Congressional Budget Office is any indication. The study, authored by Jaeger Nelson and Kerk Phillips, considers the impact on growth based on six different scenarios (based on how much the spending burden increases and what taxes are increased).

If permanent spending is financed by new or increased taxes, then those taxes influence people’s decisions about how much to work and save. Those decisions then affect how much the economy produces and businesses invest and, ultimately, how much people can consume. Different types of taxes have different economic effects. Taxes on labor income reduce after-tax wages, so they reduce the return on each additional hour worked. …Higher taxes on capital income, such as dividends and capital gains, lower the average after-tax rate of return on private wealth holdings (or the return on investment), which reduces the incentive to save and invest and leads to reductions in saving, investment, and the capital stock. …we compare the effects of raising additional revenues through three illustrative tax policies: a flat tax on labor income, a flat tax on all income (including both labor and capital income), and a progressive tax on all income. The additional revenues generated by these policies are in addition to the revenues raised by taxes that already exist and are used to finance two specific increases in government spending. The two increases in government spending are set to 5 percent and 10 percent of GDP in 2020.

Here are some of the key results, as illustrated by the chart.

The least-worst result (the blue line) is a decline in GDP of about 3 percent, and that happens if the spending burden expand by 5-percentage points of GDP and is financed by a flat tax.

The worst-worst result (dashed red line) is a staggering decline in GDP of about 10 percent, and that happens if the spending burden climbs by 10-percentage points and is financed by a progressive tax.

Here’s some additional analysis, including a description of why progressive taxes impose the most damage.

This paper shows that flat labor and flat income tax policies have similar effects on output; labor taxes reduce the labor supply more, and income taxes reduce the capital stock more. For all three policies, the decline in income contracts the tax base considerably over time. As a result, to continuously generate enough revenues to finance the increase in government spending in each year, tax rates must steadily increase over time to account for the decline in the tax base. Moreover, labor and capital taxes put upward pressure on interest rates by reducing the capital-to-labor ratio over time… The largest declines in economic activity among the financing methods considered occur with the progressive tax on all income. Those declines occur because high-productivity workers reduce their hours worked and because higher taxes on asset income reduce the incentive to save and invest relatively more than under the two flat taxes.

There’s lots of additional information in the study, but I definitely want to draw attention to Table 4 because it shows that lower-income people will suffer big reductions in living standards if there’s an increase in the burden of government spending (circled in red).

What makes these results especially remarkable is that the authors only look at the damage caused by higher taxes.

Yet we know from other research that the economy also will suffer because of the higher spending burden. This is because of the various ways that growth is reduced when resources are diverted from the productive sector to the government.

P.S. The CBO study also points out that financing new spending with a value-added tax wouldn’t avert economic damage.

…by reducing the cost of time spent not working for pay relative to other goods, a consumption tax could reduce hours worked through a channel like that of a tax on labor.

For what it’s worth, even the pro-tax International Monetary Fund agrees with this observation.

P.P.S. It’s worth noting that the CBO study also shows that young people will suffer much more than older people.

…older cohorts, on average, experience smaller declines in lifetime consumption than younger cohorts

Which raises an interesting question of why millennials and Gen-Zers don’t appreciate capitalism and instead are sympathetic to the dirigiste ideology that will make their lives more difficult."