Evaluating the free market by comparing it to the alternatives (We don't need more regulations, We don't need more price controls, No Socialism in the courtroom, Hey, White House, leave us all alone)
Saturday, March 3, 2018
An analysis of CEEPR’s Paper on “The Economics of Ride-Hailing”
"The
on-demand workforce has grown considerably over the years. In the US
alone, more than 750,000 people drive with Uber. And while on-demand
work still accounts for a relatively small portion of the total US labor
force, it has emerged as an important focus of academic research.
We
have been fortunate to collaborate with many researchers interested in
learning more about the on-demand workforce. We have done this because
rigorous and credible research can help ground and advance important
matters of public policy for the entire ecosystem.
This
week, MIT’s Center for Energy and Environmental Policy Research (CEEPR)
released a paper titled “The Economics of Ride-Hailing: Driver Revenue,
Expenses and Taxes,” which differs markedly from previous academic
studies on the topic of driver earnings.
For example, a study
we conducted with Alan Krueger of Princeton found that drivers across
20 of Uber’s largest US markets earned an average of $19.04 per hour, in
October 2015. A more recent study with Stanford professors estimated gross hourly earnings of $21.07¹ for all US drivers between January 2015 and March 2017.
Perhaps most surprisingly, the earnings figures suggested in the paper are less than half the hourly earnings numbers reported in the very survey the paper derives its data from. That survey, conducted by The Rideshare Guy in 2017, reports average hourly earnings of $15.68.
Why the major discrepancy? In our estimation, it comes down to a major error in the authors’ methodology.
Step 1: So, what’s the error?
The
Rideshare Guy survey asks a number of questions about how much drivers
earn and how many hours they work per week. The most important are
questions 11, 14, and 15.
Q11: “How many hours per week do you work on average? Combine all of the on-demand services that you work for.”
Q14: “How much money do you make in the average month? Combine the income from all your on-demand activities.”
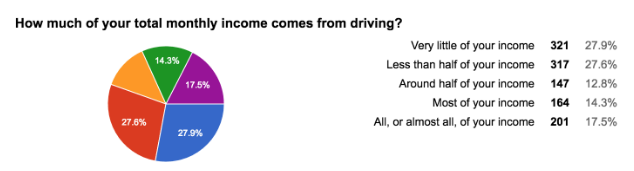
Q15: “How much of your total monthly income comes from driving?”
The
problem in this case is inconsistent logic on the part of the paper’s
authors. Consider this: for question 14, the authors assume respondents
are reporting income from *all* sources, not just on-demand work. As a
result of this assumption, the authors discount the earnings from Q14 by
the answer to Q15, “How much of your total monthly income comes from
driving?”
For
example: if a driver answered $1,000 to $2,000 to Q14, the authors
would interpret that as $1,420.63² according to their methodology. If
the respondent then answered “Around half” to Q15, the authors conclude
this driver made $710.32 driving — half what they actually earned from
driving with ridesharing platforms.
However,
and perhaps just as important, the authors also assume that drivers
understood Q11 perfectly well and that the hours reported only applied
to on-demand work. As a result, they divide an incorrectly low earnings
number by the correct number of hours.
This
inconsistency leads to flawed methodology that results in hourly
earnings numbers that are far, far below what any previous study has
found.
Step 2: How big could this error be?
The
Rideshare Guy’s public survey data allows us to estimate the magnitude
of the error. We start by collecting the responses to question 15 from
his google doc.
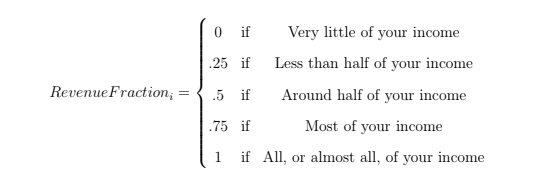
The
next step is to collect the adjustment factors that are outlined in the
paper (and the table below). The adjustment factors are the proportion
of total income from all sources that drivers earned from on-demand
activity. The authors multiplied monthly earnings from on-demand sources
by these numbers.
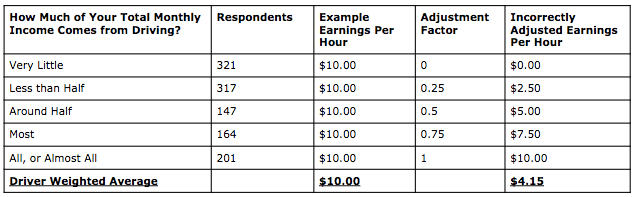
For
simplicity, we can assume that drivers in each group earn the same
amount per hour as drivers in every other group on average. This Seattle blog post
supports our assumption. This means that if drivers made $10 per hour
from driving, the authors would incorrectly assume some made $7.50,
$5.00, $2.50, and $0.
We
can use these pre and post adjustment earnings per hour numbers to see
how much error could be introduced by the authors’ mistake. An example
is in the table below ($10 is chosen only because it is very convenient
for illustrating percentage differences):
To
get the driver weighted average, we multiply the number of drivers in
each category by the earnings per hour number for that category and
divide by the total number of drivers. This gives us average actual
earnings per hour of $10, but incorrectly adjusted earnings per hour of
$4.15.
The
difference of 58% between actual earnings per hour and adjusted
earnings per hour is slightly higher than the discrepancy from the Uber
numbers reported in The Rideshare Guy’s survey and slightly lower than
the difference from the survey’s higher Lyft numbers.³
If
we adjust the revenue per hour to account for this, we get $16.53 or
$13.04 per hour after expenses. This is more consistent with The
Rideshare Guy’s survey and past academic research.
It
is important to note that we do not take issue with the paper’s
estimation of costs. They are very much in line with previously-reported
costs associated with driving. But the methodology used to arrive at
the eye-poppingly low earnings numbers is deeply flawed for the reasons
outlined above.
We
have reached out to the paper’s authors to share these concerns and to
suggest ways we might work together to refine their approach. We believe
their paper and the broader body of academic research would benefit
from a second look.
¹ At the time, service fees were generally between 20% and 25%. At 25% this would be $15.80.
² This is a standard practice in survey research.
³ The survey does not adjust for where drivers are. Lyft drivers may be more concentrated in cities with higher earnings."
No comments:
Post a Comment
Note: Only a member of this blog may post a comment.
No comments:
Post a Comment
Note: Only a member of this blog may post a comment.