Evaluating the free market by comparing it to the alternatives (We don't need more regulations, We don't need more price controls, No Socialism in the courtroom, Hey, White House, leave us all alone)
"So what accounts for the relative decline in jobs in high-wage
hospitals and finance? One obvious possibility is increased regulation.
The Affordable Care Act for hospitals and Dodd-Frank for finance both
passed in 2010, the year real wages began to decline. It might be a
coincidence that the industries most affected by these two laws suffered
the most damage. But the following facts lend some credence to
regulation as a causal factor.
First, the decline in the share of
workers in financial activities from 2006-10 was about one-fifth as
rapid as that between 2010 and 2014. Given that the financial crisis
peaked in autumn 2008, one would have expected the earlier period to see
the most rapid declines, not the reverse.
Second, the share of
workers in hospitals increased rapidly from 2006 to 2010, placing it
among the top 10% of industries in labor growth. That trend was reversed
in the past four years. Nursing and residential care’s share of
employment also grew in the early period and declined in the latter one.
Ambulatory health-care services, whose share did continue to grow from
2010 to 2014, slowed to one-fourth the pace of growth that prevailed
from 2006 to 2010.
Third, industries with educationally similar
workforces to those in finance and hospitals, like professional and
technical services, enjoyed continued growth in their share of the
workforce during the latter period. Even the construction industry,
which was at the center of the recession and saw substantial declines
between 2006 and 2010, experienced slight increases in share between
2010 and 2014."
"Wages tend to move with productivity—and tax hikes on capital,
threatened or actual, were not helpful to business investment, which
spurs growth in labor productivity. Higher taxation of dividends and
capital gains, as has occurred under President
Obama,
reduces incentive to invest and makes it more difficult to
attract capital to the U.S."
See A Trade Opportunity for Obama and the New Congress by Charles Boustany And Robert B. Zoellick. Mr. Boustany (R., La.) is a senior member of the House Ways and
Means Committee, where he serves on the Subcommittee on Trade. Mr.
Zoellick served as U.S. trade representative, deputy secretary of state,
and president of the World Bank.
Excerpt:
"American families, and businesses, benefit from higher incomes and
lower-priced imports. The World Trade Organization reports that the
North American Free Trade Agreement and the Uruguay Round, the last big
global trade agreement, have increased the purchasing power of an
average American family of four by $1,300 to $2,000 every year. The
Peterson Institute for International Economics estimates that the new
trade deals in the works could offer that family another $3,000 or more a
year."
"doctors who have been receiving the enhanced payments will see their fees for primary care cut by 43 percent, on average."
"Medicaid payments for primary care services could drop by 50 percent or
more in California, Florida, New York and Pennsylvania, among other
states."
"some patients would have less access to care after the cuts."
"A survey by the Ohio State Medical Association
found that some Ohio doctors began accepting Medicaid patients because
of the rate increase in 2013. Ohio doctors who were already
participating in the program said they had accepted more Medicaid
patients after the rate increase. And almost 40 percent of Ohio doctors
indicated that they planned to accept fewer Medicaid patients when the
extra payments lapsed."
"How much of a positive difference does fossil fuel energy make to
environmental quality? Let’s look at modern trends in three key areas of
environmental quality: water, sanitation, and air.
Here’s water quality—measured by the percentage of world population with “access to improved water sources.”"
"If you were to turn on your faucet right now, in all likelihood you
could fill a glass with water that you would have no fear of drinking.
Consider how that water got to you: It traveled to your home through a
complex network of plastic (oil) or copper pipes originating from a
massive storage tank made of metal and plastic. Before it ever even got
to the distribution tank, your water went through a massive, high-energy
treatment plant where it was treated with complex synthetic chemicals
to remove toxic substances like arsenic or lead or mercury. Before that,
the water would have been disinfected using chlorine, ozone, or
ultraviolet light to kill off any potentially harmful biological
organisms. And to make all these steps work efficiently, the pH level of
the water has to be adjusted, using chemicals like lime or sodium
hydroxide.
Natural water is rarely so
usable. Most of the undeveloped world has to make do with natural
water, and the results are horrifying. Billions of people have to get by
using water that might contain high concentrations of heavy metals,
dissolved hydrogen sulfide gas (which produces a rotten-egg smell), and
countless numbers of waterborne pathogens that still claim millions of
lives each year. It’s a major victory for any person who gains access to
the kind of water we take for granted every day—a victory that fossil
fuels deserve a major part of the credit for."
Sanitation
Historically, the inability to effectively deal with our own bodily
waste has been one of the largest threats to human health. To this day
it takes an enormous toll on human life throughout the world. For
example, cholera is a bacterial disease that is transmitted through the
ingestion of food or water contaminated by human fecal matter. The toxin
that these bacteria produce inhibits the body’s ability to absorb food
and water, which can very quickly cause death through dehydration.
Worldwide, over a hundred thousand people get sick from cholera
annually. (Think about that when you hear environmentalists talk about
“harmony with nature”—i.e., harmony with all our predators, their waste,
and our waste.) But cholera has been all but eradicated in the
industrialized world.
Here’s the big picture of sanitation—the percent of our world
population with access to improved sanitation facilities, according to
the World Bank.
"Note that as recently as 1990, under half the world had “improved
sanitation facilities.” The increase to two thirds in only a few decades
is a wonderful accomplishment, but a lot more development is necessary
to make sure everyone has a decent, sanitary environment.
Part of the way we have solved sanitation problems is through the
industrialized world’s ability to thoroughly sanitize any water human
beings might consume using high-energy machines. Just as important, we
have created entirely separate water systems to deal with sewage.
Historically, a person’s sewer tended to be connected, at least in part,
to his drinking water. This was rarely intentional, and early
civilizations did construct sewer systems to isolate human waste, but
natural, unrestricted water flows usually lead to a certain amount of
mixing between the human waste and the nearest freshwater
source—particularly as more and more people group together.
Today, sewage is not only kept separate from clean water sources, but
it is also extensively treated to render its most dangerous elements
harmless so that it can be disposed of safely, in some cases used as a
fertilizer or even, thanks to the latest technology, turned into
drinking water. The technology of sewage treatment is another advance
made possible by industrialization, and it is yet another
energy-intensive process for transforming our environment.
Want a more sanitary environment for people around the globe? We need more cheap, reliable energy from fossil fuels.
Air
Most of us have had the experience of sitting around a campfire when
the wind changes direction and blows the smoke into our faces right as
we take a breath. The resulting experience is unpleasant: a few sharp
coughs, along with some stinging of the eyes and throat. For us, it’s a
temporary annoyance. For billions of people around the world, it is an
everyday experience.
Imagine if the only way you could avoid the danger of
cold—historically, cold is a far bigger killer than warmth—was to light a
fire in your house every day of the year. You could do things to reduce
the amount of smoke you breathed in by using a chimney and opening
windows (though at the expense of letting cold in), but the fact remains
that you would be breathing in an enormous amount of smoke every day.
For many people today, that’s the choice: breathing in smoky air, or
going cold.
Today the idea of using a fire to routinely heat our dwellings is
foreign to most of us. Modern homes are heated with advanced furnaces
that heat air within a machine and then send the warm air to various
locations in the house. The heating is usually done either via
clean-burning natural gas, in which case the furnace has an exhaust
system to remove any waste from the combustion, or with electrical
heating elements powered by mostly faraway smokestacks (which themselves
minimize air pollution by diluting and dispersing particulates higher
in the air).
The combination of sophisticated machines and cheap, reliable energy
has made the heating of homes such a trivial issue that most of us have
never considered its connection to cleaning up the air we breathe every
day. And yet natural-gas furnaces enable us to enjoy all the benefits of
having a warm place to live with none of the downsides of smoky, toxic
air that our ancestors would have endured for the same privilege.
All of these benefits apply, not just in heating our homes, but in
cooking our food. Indoor pollution from primitive cooking methods is a
major global problem, and using fossil fuels can help solve it.
We need to consider all these air-cleaning benefits when we consider the air pollution risks of fossil fuels.
And technology is making these risks ever smaller. Stories of rampant
smog in Chinese cities bring fears that the situation will inevitably
get worse there and in any other country that industrializes.
Fortunately, our experience in the United States illustrates that things
can progressively get better.
Here again is a graph of the air pollution trends in the United
States over the last half century. In the image are total emissions of
what the EPA classifies as six major pollutants that can come from
fossil fuels. Notice the dramatic downward trend in emissions— even
though we were using more fossil fuel than ever.
Source: U.S. EPA National Emissions Inventory Air Pollutant Emissions Trends Data. Graph originally appeared in The Moral Case for Fossil Fuels.
How was this achieved?
Above all, by using anti-pollution technology to get as many of the
positive effects of fossil fuels and as few of the negative effects as
possible."
"The US homeownership rate fell to a 25-year low in the fourth quarter
of last year at 63.9% (seasonally adjusted) — the lowest rate since Q4
1989, according to Census data released today.
So the rate of homeownerhip is back to where it started before the
political obsession with homeownerhsip turned millions of good renters
into bad homeowners as government housing finance policies pressuredforced
lenders to lower credit standards, income requirements, and down
payments to what would otherwise have been unqualified home buyers.
After a housing bubble, mortgage meltdown, financial crisis and a
homeownership rate approaching 70%, we’ve returned to the homeownership
rate of the mid-1980s."
"I will illustrate the problem with modern economics by discussing the impact of extended unemployment insurance. Last spring, Paul Krugman
suggested that the elimination of the emergency extended unemployment
program in 2014 was not leading to more jobs, thus refuting the claims
of conservative opponents of the program. In earlier posts he suggested
that ending the extended UI program would mean less fiscal stimulus,
and hence more unemployment. As we'll see, this prediction turned out
to be as ill timed as his famous "test" of market monetarism comment,
which occurred a year earlier. Nonetheless, at the time it looked like
Krugman might be right, as the first quarter of 2014 was weak (perhaps
due to bad weather.) In addition, Congress was still debating an
extension, which would have applied retroactively to those still
unemployed.
In numerous posts over at TheMoneyIllusion,
I suggested that the 99-week extended unemployment insurance program
had probably increased the unemployment rate by about 0.5%. That's
perhaps 700,000 people, which is significant, but not the major cause of
high unemployment during the recession. I always acknowledged that
this was little more than a guesstimate.
Now Tyler Cowen directs us to a fairly rigorous academic study
that uses a "difference in difference" approach and estimates that
ending extended UI led to an additional 1.8 million jobs in 2014:
We measure the effect of unemployment benefit duration on
employment. We exploit the variation induced by the decision of Congress
in December 2013 not to reauthorize the unprecedented benefit
extensions introduced during the Great Recession. Federal benefit
extensions that ranged from 0 to 47 weeks across U.S. states at the
beginning of December 2013 were abruptly cut to zero. To achieve
identification we use the fact that this policy change was exogenous to
cross-sectional differences across U.S. states
and we exploit a policy discontinuity at state borders. We find that a
1% drop in benefit
duration leads to a statistically significant increase of employment by
0.0161 log points.
In levels, 1.8 million additional jobs were created in 2014 due to the
benefit cut. Almost
1 million of these jobs were filled by workers from out of the labor
force who would not
have participated in the labor market had benefit extensions been
reauthorized.
Obviously this study is far superior to my guesstimate. And in a sense
it does support my side of the debate I'm having with Keynesians, who
(falsely) accuse me of promoting the "lazy worker" theory of
unemployment. So I should jump on this result, right? Especially since I
can't find any flaw in their empirical work (although honestly I just
skimmed the paper.)
In fact, I'm not being a good Bayesian, I'm not shifting my prior
view that extended UI cost about 700,000 jobs, although I am widening
the band around that estimate to include 1.8 million as a plausible
estimate. I'll try to explain my stubbornness, and I want smarter, less
biased people to tell me if I am wrong.
In 2012 the US created about 2.25 million jobs, and in 2013 it
created about 2.35 million jobs. In late 2013, before it was known that
extended UI would be repealed, most economists seemed to expect 2014 to
be at least as good as the previous two years. The markets also seemed
to expect continued growth, although unfortunately we lack good RGDP
and NGDP futures markets. But my sense was that 2014 was likely to be
similar to 2013, and it seemed to me that forecasters in academia and
the asset markets both expected a similar result.
In fact, employment growth in 2014 was 2.95 million, a number quite
likely to be revised higher in the next year or two. That's why I still
think 700,000 is a decent ballpark guesstimate. I just don't find it
plausible that job growth would have suddenly plunged to 1.15 million in
2014, if nothing had been done about extended UI. I saw nothing going
on in terms of "shocks" that would have suddenly caused job growth to
slow.
If the markets agreed with me, the difference would have been about
700,000. If they agreed with Marcus Hagedorn, Iourii Manovskii, and
Kurt Mitman, the difference would have been 1.8 million. If they agreed
with Krugman it might have been negative (fewer jobs if the program
ended.) Think of the market forecast as a sort of meta-study, which
efficiently incorporates Krugman's arguments, my arguments, and the
empirical work in the study mentioned above."
"The Barack Obama administration has announced plans to tie 90 percent
of all Medicare fee-for-service payments to some sort of quality or
value measure by 2018. Sounds exciting! Who wouldn't like to ensure that
their doctors are paid for delivering value, rather than just randomly
sticking needles into us?
Unfortunately, as both the Official Blog Spouse and Aaron Carroll of the Incidental Economist
have noted, there is less to this announcement than meets the eye.
Saying you want to pay for quality instead of procedures is quite easy
to say; indeed, many an administration has said so, because "paying for
outcomes instead of treatment" is the holy grail of health-care
economists everywhere. But actually doing this, rather than just saying
it, turns out to be really hard. I think it's fair to say that the
Official Blog Spouse is one of the few journalists in the nation who has
extensively reported on the history of Medicare payment reforms, all of
which were supposed to move the system toward paying for valuable
health care rather than cardiologists' greens fees. As he details, they
mostly failed. Medicare payments turn out to be a lot like one of those
gel stress balls: You can squeeze them very small in one place, but the
spending just pops out somewhere else.
There are a lot of reasons for this. Health-care lobbies are
powerful, and Congress is almost uniquely easy to lobby, so ideas like
controlling the growth rate of physician payments fell by the wayside
once those payments actually had to be cut. The larger problem, however,
is finding what to measure -- and making sure that your measurement
doesn't introduce perverse incentives into the system. The fundamental
problem is that while we want to pay for "health" or "outcomes," we
can't really measure those very well.
Here's a little exercise that will illustrate the problems of
measurement that confound attempts to pay for "outcomes" or "health"
instead of treatment: Tell me how healthy you are on a scale of 1 to 10.
Now before you blurt out an answer, stop and think. You're probably
already pondering some questions: What's on the scale? What does a 1
look like, and what is a 10?
Let's say that 1 is a terminal cancer patient in the ICU; 10 is an
18-year-old athlete in the prime of his physical powers. But you're
probably neither of these things. So where do you fall in between? Maybe
you're pretty healthy for a 47-year-old accountant, but your back gives
you frequent trouble and you've got some acid reflux you need to watch,
and, of course, there's your blood pressure pills, or maybe in your
case it's a statin ...
If you rate yourself compared to your neighbors, or other 47-year-old
accountants, you might give yourself an 8 -- 9 if you're the cheery
sort, 7 if you're a perpetual grump. But if you compare yourself to that
18-year-old athlete, you're probably more of a 5 or a 6.
And that's only the stuff you know about. What about the stuff you
don't know about? How likely are you to die in the next five years? Or
have a heart attack or a stroke or lose a limb?
The answer is "you have no idea." If we had 50,000 of you, actuaries
could predict these things pretty accurately: how many heart attacks,
strokes, deaths, car accidents and so forth. But unless you are that
terminal cancer patient in the ICU, no one can predict how likely you,
personally, are to die in the next five years. We can say something
about the expected life and health of large groups of people very like
you. But not you personally.
Unfortunately, doctors don't treat statistical universes; they treat
individual patients. Those patients may unpredictably die, or just as
unpredictably survive against incredible odds. Some of that is due to
the skill of the doctor, some to the innate characteristics of the
patient. How much of which? Hard to tell unless the doctor does
something obviously completely wrong and stupid, like leaving an
instrument inside the patient he's operating on.
You can look at the whole pool of patients that the doctor treats, of
course, but the more complicated and expensive the treatment, the fewer
patients the doctor will be treating, which means that your data is
prone to being swamped by a few outliers. Moreover, doctors do not treat
identical patient pools. A good doctor who treats really sick patients
may look worse than a bad doctor who confines their treatment to the
relatively young and healthy.
Of course, we can attempt to correct for this by adjusting the
measurement for risk. The problem is that we don't know all the risk
factors; we know some risk factors that we can measure. There are a lot
of risk factors we can't, which means that this adjustment will be far
from perfect.
If the adjustment is too imperfect, providers have recourse even
beyond lobbying: They can stop taking patients covered by your program.
That limits your ability to shrug your shoulders and say, "Gosh, well,
the world's imperfect, so I'm afraid that yes, some of you are going to
get unfairly penalized under the new system. It's the best we can do."
Medical systems are not the only systems that encounter these
problems. Just ask any organization that has tried to implement a new
sales compensation scheme to better align sales incentives with
"customer value." As one veteran of such attempts told me, suddenly
salesmen who majored in beer pong are "like Aristotle" -- they can
explain exactly why their sales territory is special and your new,
complicated system fundamentally mismeasures the value of their efforts.
Within six months, you'll have lost a few top performers who hate the
new system. Within a year, your burgeoning philosophers have probably
figured out how to game the new metrics.
Gaming -- "juking the stats," as it was called on "The Wire" -- is
the other major reason that these sorts of systems are hard to
implement. Let me illustrate with a little example. The town of Beachy
Head, England, had a big problem with suicide; people threw themselves
off its dramatic cliffs. In 1975, however, it managed to cut the rate of
suicide in half in a single year. An improvement in the national mood?
Or a dramatic triumph of public policy?
A new medical examiner.
The new chap decided to test the blood alcohol level of bodies found at
the base of the cliffs. Those with alcohol in their blood were ruled to
be accidents, rather than suicides.
You might argue that people bent on suicide could be taking a drink
to fortify their courage before attempting to take their own lives --
and you'd probably be right. Which is exactly the point. There is some
true rate of suicides at Beachy Head, but that's not information we
have. All we know is the suicide rate, which is dependent on things like
the assumptions of the medical examiner.
This is always a big problem, but it is particularly problematic when
you give the person taking the measurements strong incentives to see
things one way, rather than the other. On "The Wire," cops made their
crime rate look good by reclassifying serious crimes as less serious, or
as accidents, which did nothing about the underlying problem but made
the cops look much better. Unfortunately, we see the same behavior in
doctors and hospitals. It's called "upcoding": rating conditions as more
serious than they are in order to increase the reimbursement, or to
improve their performance on those risk-adjusted mortality measures.
The idea was that they were "ending years of private, clubby surgeon
culture." The public report cards "were intended to shine a light on
poor surgeons and encourage a kind of best-practices ethic across the
state. If the system worked, mortality rates would fall everywhere from
Oswego to NYU." And at first glance, the system worked beautifully:
Risk-adjusted mortality rates dropped by an astonishing two-thirds. But
as New York magazine reports, it rapidly became clear that one way
surgeons were achieving these advances was simply by refusing to treat
the sickest patients:
This isn’t just about high-risk patients. It’s about doctors playing
games with practically any patient to get better scores. Some surgeons
look for ways to make their easy cases seem harder. Others make their
hard cases appear so difficult that they place out of the state
reporting system. When it comes to the sickest patients, some surgeons
simply turn them away, asserting that they’re better off getting drug
treatments, or waiting in the ICU. “The cardiac surgeons refer their
patients to the cardiologists, and the cardiologists refer them to the
intensive-care unit,” says Joshua Burack, a SUNY–Downstate surgeon in
Brooklyn who in 1999 released a study revealing that nearly two-thirds
of all heart-bypass surgeons in the state anonymously admitted to
refusing at least one patient for fear of tainting their mortality
rates. “Everyone’s going to pass along the hot potato to the person
who’s not vulnerable to reporting.”
In the past five years, no fewer than five studies have been
published in reputable journals raising the possibility that New York
heart surgeons are not operating on certain cases for fear of spoiling
their mortality rates. The clincher came in January, when, in an
anonymous survey sent out to every doctor who does angioplasty in the
state, an astonishing 79 percent of the responders agreed that the
public mortality statistics have discouraged them from taking on a risky
patient. If you’re a hard case, in other words, four out of five
doctors would think twice before operating on you.
The Cleveland Clinic started getting a lot more referrals from New
York -- and their patients were sicker than the patients referred from
other states.
Now, you can make an argument that maybe this is all to the good --
that maybe the money we spent doing heart surgery on very sick people
was wasted, and it's better to concentrate our money on the relatively
healthy. But that's not the purpose of the report cards, which are
supposed to help patients make informed choices about their surgeons --
not to help surgeons better choose their patients.
The doctor profiled
in the article, who had New York's lowest cardiac mortality rate at the
time, told the reporter that he achieved that rate by not operating on
people who were "already dead." But what does that mean? Refusing to
operate on hopeless cases, or refusing to operate on people who have a
40 percent chance of living with surgery and no chance at all without
it? If that were me, I'd probably want to gamble -- and I'd probably be
pretty angry if surgeons were too afraid that a failure would show up on
their report card.
In some cases, surgeons code their patients as sicker than they used
to, even if doing so means doing additional, unnecessary treatment. This
can range from putting a patient on nitroglycerin to, the article
alleges, actually putting a little ring around someone's mitral valve,
which the surgeon who recalled the incident describes as "assault."
These measures either improve the risk adjustment or take the patient
out of the report card sample entirely, because they're deemed special
cases.
You get the point: A measure that was supposed to make patients
healthier and encourage the spread of best practices has instead kept
doctors from treating sick patients and encouraged unnecessary
treatments. Don't get me wrong: It may well have encouraged some better
treatment, too. But we always need to be mindful of the perverse
incentives by which even a simple, obvious solution like "more
transparency!" could actually make the system worse.
More broadly, when money is on the line, assume that people will act
against any system you come up with to preserve their income, even to
the detriment of patients -- like Medicare's plan to reduce hospital
readmission rates, which completely succeeded in reducing those numbers
and also apparently resulted in a lot more patients being put on
observation status rather than being admitted to the hospital. That
meant they didn't count as "readmissions" if they came back. It also
potentially left the patients on the hook for bigger bills.
I'm not saying that no payment reform program can ever work. I am
saying that most of the significant attempts to reform the way we pay
for health care haven't, and for similar reasons. Reformers have the
basic idea right: You'll get more of what you'll pay for, and less of
what you don't, so you should pay for what you want. Unfortunately, in
fields like health care and education, we can't pay for what we want; we
can only pay for what we can measure. And it's usually a lot easier for
people to play with the measurements than it is to change their
behavior or give up a big hunk of income."
"Over at Business Insider, James Rosenbush writes about the need for startups (a favorite topic of mine):
The
private sector economy has a life blood, and it is startups. New
businesses are started by inventive entrepreneurs out of economic
necessity or because their new ideas won’t wait. Technology has been a
boon and a barrier to job creation. In past cycles, startups were more
labor intensive — requiring more people to run them. Ford Motor Company,
once a startup, is a good example. Technology shies away from jobs and
shifts productivity and lifestyle gains to software. We’re going to need
many more startup zealots and maniacs to sustain and grow an economy
where people can find and keep good jobs with growing wages.
But government often erects barriers and lays down minefields in front of America’s entrepreneurs. Pacific Standard’s Susie Cagle
writes about just such a situation, the story of Night School, which
“just wanted to provide a modest, low-cost bus service from San
Francisco to the East Bay.” It wasn’t complicated. Regular old school
buses driven by insured, licensed drivers between two stops every half
hour. But it was not to be:
The
response to Night School’s speculative press was overwhelmingly
positive. But less than two weeks later, the week of its planned launch,
Night School was postponed indefinitely while its founders grappled
with the [California Public Utilities Commission] which claimed the
start-up was not properly licensed as a passenger carrier. If Night
School had sought to operate as a service only available to members of a
private club, the CPUC wouldn’t have had jurisdiction over the
business. But the founders’ vision was decidedly public, from the school
buses to the low fares. The CPUC has struggled to codify new rules for “transportation network companies,” shifting
and changing regulations over the last three years while those
companies continued to operate. Night School never got the chance to
open its doors. After months of back and forth, false starts, and moved
goal posts, Night School announced its closure last December.
The CPUC, by the way, is the same regulator which has tried to fine and regulate Uber, Lyft, and other ride-sharing services."
"In his 1944 book “Bureaucracy,” legendary economist Ludwig Von Mises explained the important and supreme role of the ruthless consumer in the market economy (emphasis added):
The real bosses, in the capitalist system of market economy, are the consumers.
They, by their buying and by their abstention from buying, decide who
should own the capital and run the plants. They determine what should be
produced and in what quantity and quality. Their attitudes result
either in profit or in loss for the enterpriser. They make poor men rich and rich men poor.
The consumers are merciless.
They never buy in order to benefit a less efficient producer and to
protect him against the consequences of his failure to manage better.
They want to be served as well as possible. And the working of the capitalist system forces the entrepreneur to obey the orders issued by the consumers.
The
consumers are no easy bosses. They are full of whims and fancies,
changeable and unpredictable. They do not care a whit for past merit. As
soon as something is offered to them that they like better or that is
cheaper, they desert their old purveyors. With them nothing counts more than their own satisfaction.
They bother neither about the vested interests of capitalists nor about
the fate of the workers who lose their jobs if as consumers they no
longer buy what they used to buy.
Here’s
a dirty little secret about capitalism: consumers, not corporations,
run the show. If you find something about the marketplace objectionable,
it would be more appropriate to blame those who actually call the
shots: the ruthless, cutthroat, and disloyal American consumers.
Consumers
are the kings and queens of the market economy, and ultimately they
reign supreme over corporations and their employees. When corporations
make mistakes and introduce products that consumers don’t want, which
happens frequently, you can count on consumers voicing their opinions
forcefully and immediately by their lack of spending.
In a
market economy, it is consumers, not businesses, who ultimately make all
of the decisions. When they vote in the marketplace with their dollars,
consumers decide which products, businesses, and industries survive—and
which ones fail. It is therefore consumers who indirectly but
ultimately make the hiring and firing decisions, not corporations. After
all, corporations can make no money, hire no people, and pay no taxes
unless somebody, sooner or later, buys their products.
What
consumer sovereignty in a free marketplace translates into is each
person husbanding his resources for the greatest benefit to himself and
his family, which in turn translates into the greatest efficiency in the
consumption of the world’s scarce resources. If you don’t like the
message of the marketplace, don’t assume that corporations and greed are
to blame while consumer behavior and consumer greed play no role in the
outcome. We should be thankful, in fact, that the marketplace puts
consumers on such a powerful pedestal.
Bottom Line:
Consumers ultimately run the market economy, and for that we should be
thankful. Because what’s the alternative? The alternative is allow
producers to run the economy, inevitably with the assistance of their
government enablers who help erect barriers to entry and restrict
competition for producers in the form of occupational licensing,
protectionist trade barriers, artificial limits on the number of firms
allowed to operate (e.g. taxi cartels), etc. In other words, the
alternative to consumers running a capitalist market economy, is to have
producers running an economy based on the corrupt, anti-consumer
principles of “crony capitalism.”
Further, we
typically assume that “greedy” behavior is practiced exclusively by
business owners and corporate executives, and never by consumers. But
consumers, especially when spending their own money on goods and
services for themselves and their families, are frequently the very
epitome and apotheosis of greed. As Mises observed, “With them
[consumers] nothing counts more than their own satisfaction,” and for
that we should be thankful. Because in a market economy, the ruthless
consumers provide the discipline that guarantees that producers will
operate efficiently and offer the best products and services at the
lowest prices."
"Not surprisingly, there has been lots of criticism of my claim that the Keynesian test of 2013 failed. Let me respond to some of the points:
1. I was accused of cherry picking dates, as I compared growth in
the 4 quarters before and after the onset of austerity on January 1st,
2013 (when all the tax increases kicked in--the sequester came a few
months later.) Growth rose from 1.60% in 2012 to 3.13% in 2013 (Q4 to
Q4.) But my critics are correct that 2012 was an unusually slow year,
so maybe a longer time period would be better. Here are growth rates
over:
The previous 2 years: 1.65%
The previous 3 years: 2.04%
The previous 4 years: 1.47%
The previous 5 years: 0.59%
The previous 6 years: 0.81%
The previous 7 years: 1.05%
The previous 8 years: 1.33%
The previous 10 years: 1.91%
The previous 15 years: 2.51%
All lower than in 2013. (I ignored compounding to save computational
time; the actual growth rates were slightly less, strengthening my
point.)
So cherry-picking data isn't the issue. What if you go forward more
than 4 quarters, say 2 years? The winter 2014 quarter was slow because
of unusually bad winter; however both the spring and summer of 2014 were
red hot. It looks like 2014 will also show decent growth when Q4 data
comes in.
Another complaint is that the increase in growth in 2013 was not
significant. There are actually two issues here, measurement error, and
the problem of ceteris paribus. As far as measurement error, I've
always acknowledged that the government probably overestimated the speed
up in 2013, as other data like job creation shows a much smaller
acceleration. But the point is that even the other data shows faster
growth, which refutes the Keynesian prediction that growth would slow.
A better argument is that the speed up was within the normal
year-to-year fluctuations reflecting all sorts of factors. To see the
problem with this argument, we have to go back and look at the "test,"
and consider what the Keynesians were trying to show. It might be
helpful to first look at a case where the RGDP data went as the
Keynesians expected, Britain after the election of the Conservatives in
2010.
The Conservatives were accused of slowing the British recovery with a
policy of "austerity." I use the scare quotes because Britain
continued to run just about the largest budget deficits in the world
during the early years of Cameron. But let's accept the Keynesian
method of estimating changes in cyclically-adjusted deficits. One thing
I noticed is that Britain had a very odd growth slump:
1. Britain continued to generate more jobs than many other developed countries.
2. Britain experienced relatively high and rising inflation.
Now I'm not arguing that Britain had no AD problem, I think it did
have one. But given the jobs growth, surely some of the British
slowdown in RGDP growth was due to productivity factors unrelated to low
AD. Some have pointed to less North Sea oil output and less earnings
from big banks in the City. Perhaps the "big government" policies of
the previous Brown government slowed trend productivity growth a little
bit. I don't claim to know all the reasons, but Britain would be a
textbook case where you might want to question whether it was austerity,
or some other factor that explained the RGDP growth slowdown. The
ceteris paribus problem.
Nonetheless, the impression I got reading people like Paul Krugman
and Simon Wren-Lewis was simply; Austerity ---> RGDP slowdown, case
closed.
Suppose that if instead of increasing from 1.60% to 3.13% in 2013,
growth in the US had slowed by an equal amount (to near zero). Let's be
serious for a moment, and please answer this honestly. Does anyone
think the Keynesians would have been saying, "Gee, that pause in the
recovery can't be attributed to austerity, because the drop in RGDP
growth is not statistically significant?" If any reader answered "yes,"
I hereby accuse you of intellectual dishonesty.
Now some want to argue that even if Krugman, et al, got this wrong,
and also used sloppy techniques for considering UK and eurozone
austerity, this doesn't definitively prove market monetarism is correct
or Keynesianism is false. Sure, I'd agree with that. Personally, I
prefer market tests. I like to look at how market prices respond to new
information about monetary policy. And of course this is one reason
why the Fed needs to subsidize trading in NGDP (and RGDP) futures
markets. And I'd prefer looking at NGDP growth, whereas the Keynesians
use RGDP growth.
My point is different; market monetarism passed the test as set up by Keynesians, using the Keynesian ground rules. Their own model failed their own test.
PS. Sometimes Keynesians refer to more systematic studies, but these
generally involve lots of observations for regions lacking an
independent monetary policy. Numerous researchers have found the
correlation goes away if you exclude observations lacking an independent
monetary policy. (Mark Sadowski, Kevin Erdmann, Benn Steil & Dinah Walker.)
PPS. I am certainly not dogmatic on this issue:
1. Fiscal stimulus that lowers inflation can be expansionary, even
with monetary offset (VAT cuts and employer-side payroll tax cuts are
two examples of fiscal stimulus that might work by encouraging monetary
stimulus to raise inflation up to target.)
2. Supply-side cuts in capital taxation can boost real GDP growth.
3. Spending on wasteful things like military output can boost RGDP
(at the expense of lower living standards) by encouraging people to work
harder to try to maintain living standards.
4. If central banks are incompetent in a very specific way then
fiscal stimulus might help. But not incompetent in the way the ECB was
incompetent when they tightened in 2011 by raising their target rates.
More (demand-side) eurozone fiscal stimulus in 2011 would not have
helped."
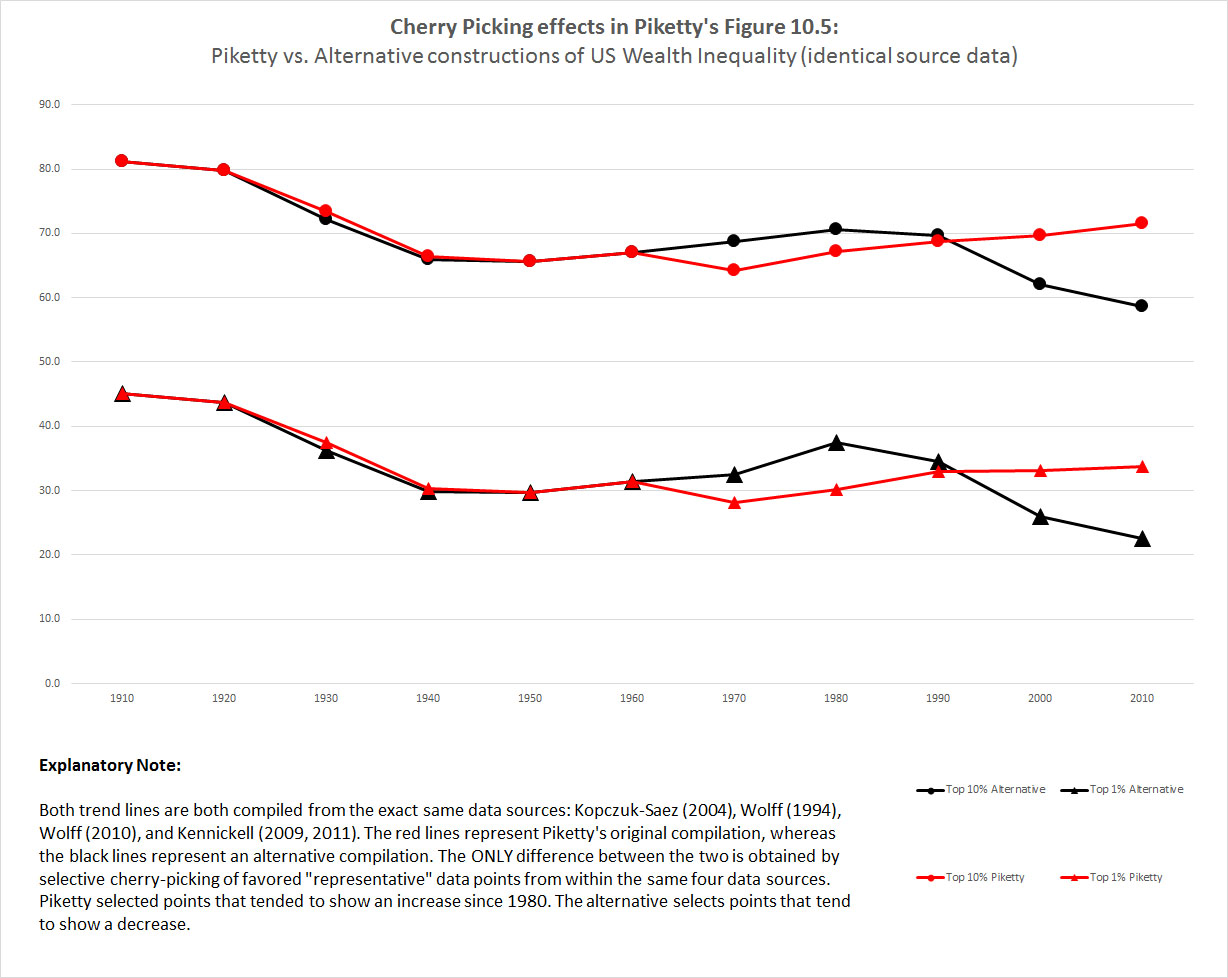
"My previous posts on the data problems in Piketty’s Capital in the Twenty First Century
have focused almost entirely on errors contained within his data charts
and files. But what happens when one tries to reconstruct those files?
To find out, I conducted a simple experiment using Piketty’s Figure
10.5 – the widely cited depiction of wealth inequality in the United
States over the past century. I previously deconstructed and critiqued
this chart at length, concluding that it is essentially a Frankenstein
graph – a clunky assemblage of cherry-picked data points from multiple
divergent sources and arranged in an order that seems to confirm
Piketty’s historical narrative about a dramatic upturn in inequality
since the early 1980s. The purpose was to reconstruct Piketty’s chart
using his own source data and techniques, only I would cherry-pick
different “representative” numbers than Piketty did from within those
sources as needed.
The rules:
1. I had to use the same data sources that Piketty used in
constructing the original. These consist of the estate tax study by
Kopczuk & Saez (2004) and SCF studies by Wolff (1994, 2010) and
Kennickell (2009, 2011).
2. My time series would be constructed the same way that Piketty
constructed his: decennial averages of the century long trend, using
data points from the aforementioned studies to obtain a “representative”
estimate for each decade.
3. I could only use adjustment techniques that Piketty also used in
reconciling differences within the sources. This included applying an
adjustment ratio to bring Kopczuk-Saez in line with the SCF studies,
light averaging to fill in gap years if needed, and a rough estimation
of the top 10% from top 1% numbers where such numbers were not available
(i.e. copying Piketty’s technique of adding 36 percentage points to the
lower trend line).
4. Where source data conflicted I was free to select between
preferred data points to form the representative estimate for each
decade, in keeping with Piketty who did the same.
The results of the experiment are as follows:
The two red lines represent Piketty’s original depiction of U.S.
wealth inequality. The two black lines represent my “alternative”
depiction, as derived from the exact same data sources. The differences
are most evident second half of the chart. Specifically: Piketty tended
to cherry-pick data points that suggested increasing inequality after
1980. My alternative does the opposite, cherry-picking data points that
suggested flat or decreasing inequality. Please note that I make
absolutely no pretenses that my method is more accurate. It simply
exists to illustrate that one may obtain dramatically different results
by preferentially selecting certain specific data points over others
while still retaining Piketty’s own data sources and blending methods.
The effect is readily apparent. By cherry-picking data points that
were favorable to his narrative, Piketty was able to “show” an increase
in inequality over the last three decades. By cherry-picking data points
that ran against his narrative even though they came from the exact same source series, I was able to “show” that inequality is actually decreasing in the same period.
In short, Piketty’s assembly of Figure 10.5 demonstrates nothing more
than the ability to get its source data to say whatever one desires
with enough discretionary manipulation. The product lacks any scientific
rigor or interpretive value, except to illustrate the perils of a data
assembly process that succumbs entirely to selection biases."
"When government agencies or heavily regulated industries are
insulated from market competition, the incentives to offer better
service and lower prices, along with the incentives to innovate, upgrade
and improve are either significantly weakened or non-existent. But when
faced unexpectedly with some market competition, it’s amazing how the
normally sclerotic, anti-consumer and unresponsive government agencies
or protected industries can suddenly become responsive and
consumer-friendly. Here are two examples:
1. The Kelston Toll Road in the UK. I reported last August on CD
that an entrepreneurial UK grandfather built a 400-yard private toll in
just ten days that allowed drivers to bypass a 14-mile construction
detour. A landslide last February closed a road between the towns of
Bristol and Bath and construction was originally scheduled to take until
last Christmas to complete. The private owner was therefore expecting
toll revenue through December to cover his $500,000 in construction and
repair costs, along with the cost of staffing a toll both 24 hours each
day, and hopefully generate some profit for his entrepreneurial efforts.
But
the local government, possibly unhappy with the competition from the
private toll road, suddenly made an emergency decision to spend an extra
$1 million to speed up the road construction project, which was
completed six weeks ahead of schedule in mid-November. Now the toll road
entrepreneur and his wife are upset and have accused the local
government of trying to bankrupt him with the early opening of the road
five weeks ahead of schedule. And perhaps the road construction would
have been completed early even without the private toll road, but it
seems pretty likely that the presence of competition from the private
toll road may have imposed some additional incentives that changed the
normal “we don’t care, we don’t have to” attitude of the local civil
servants (who often are neither very “civil nor “servile”).
2. Big Taxi vs. Uber.
After being protected from competition for generations by government
regulations that restrict the number of traditional taxis in most major
cities like New York, Chicago and LA, the “taxi cartel” has recently
come under competitive pressure from new ride-sharing services like Uber
and Lyft that offer consumers a transportation alternative to taxis at
lower prices and with better, faster service. Suddenly, the traditional,
sleepy taxi industry is being forced to act and think more
competitively in response to the upstart ride-sharing services, which is
behavior that is completely alien to an industry that never faced the
discipline of market competition before. For example, the LA Times is reporting that:
All
taxicab drivers in Los Angeles will be required to use mobile apps
similar to Uber and Lyft by this summer, according to a measure passed
by the Los Angeles Taxicab Commission this week.
The order, passed
on a 5-0 vote, requires every driver and cab to sign onto a
city-certified “e-hail” app by Aug. 20 or face a $200-a-day fine. The move is seen as a way to make taxicab companies more competitive with rideshare apps such as Uber and Lyft.
Los
Angeles cab companies reported a 21% drop in taxi trips in the first
half of 2014 compared with the same period the previous year, the
steepest drop on record. Cab companies largely attribute the drop to the
popularity of app-based ride services.
William Rouse, general
manager of Yellow Cab of Los Angeles, says his company has utilized a
mobile app for several years. The app, Curb, allows riders to hail and
track a cab, provide payment and rate drivers. “If our industry
is ever going to get a chance to move passengers from Uber back to
taxis, each one of these companies should have an app,” Rouse told The Times. “It’s a shame that the city had to mandate it in order for this to happen.”
Meet
the new secret weapon to get a leg up in the cutthroat competition
among cabbies — charm school. Taxi drivers in Washington state are
getting lessons that they hope will give them an edge against startups
such as Lyft and Uber. About 170 taxicab operators paid $60 out of their
pockets for a four-hour training session to learn about topics
including customer satisfaction and developing relationships with
institutional clients.
Pretty amazing how the taxi
cartel is suddenly starting to change the way it operates now that its
drivers are facing intense market competition/discipline from Uber and
Lyft.
Bottom Line: Perry’s Law says that
“competition breeds competence.” These two cases above help to
illustrate that principle, and provide examples of how direct, ruthless,
even cutthroat competition is often the most effective form of
regulation, and provides the intense discipline that forces firms to
maximize their responsiveness to consumers. To maximize the competence
of producers and suppliers, we have to maximize competition, and to
maximize competition we usually need to reduce the government barriers
to market competition like occupational licensing and artificially
restricting the number of taxis that are allowed to operate in a city.
In other words, we need to move away from the ubiquitous crony
capitalism that protects well-organized, well-funded, concentrated
groups of producers like the taxi cartel, barbers, funeral home
operators, and sugar farmers from market competition. Government
regulation typically reduces competition, which then reduces the
competence of producers, and reduces their willingness to serve
consumers and the public interest, which make us worse off. I say the
more market competition the better, for consumers and for the human
race. As Bastiat pointed out in 1850:
Treat all
economic questions from the viewpoint of the consumer, for the interests
of the consumer are the interests of the human race.""
"Many schools are in the grip of one of the most anti-meritocratic forces
in America: the teachers’ unions, which resist any hint that good
teaching should be rewarded or bad teachers fired. To fix this, and the
scandal of inequitable funding, the system should become both more and
less local. Per-pupil funding should be set at the state level and
tilted to favour the poor. Dollars should follow pupils, through a big
expansion of voucher schemes or charter schools. In this way, good
schools that attract more pupils will grow; bad ones will close or be
taken over. Unions and their Democratic Party allies will howl, but
experiments in cities such as battered New Orleans have shown that
school choice works."
"One of the major concerns with forecast CO2-induced global
warming is temperatures might rise so rapidly that many plant species
will be driven to extinction, unable to migrate fast enough toward
cooler regions of the planet to keep pace with the projected warming.
The prospect of species demise and potential extinction have served as a
rallying cry in calls for restricting CO2 emissions. But how
much confidence should be placed in this climate-extinction hypothesis?
Do real world data support these projections? Are plants really as
fragile as model projections make them out to be?
A new paper published in the research journal Botany
investigates this topic as it pertains to sugar maple trees, and the
findings do not bode well for climate alarmists. In this work, Hart et al. (2014) analyzed “the population dynamics of sugar maple (Acer saccharum
Marsh.) trees through the southern portion of their range in eastern
North America,” selecting this particular species for this specific task
because its range “has been projected to shift significantly northward
in accord with changing climatic conditions” by both Prasad etal. (2007) and Matthews et al. (2011).
The three U.S. researchers
analyzed changes in sugar maple basal area, relative
frequency, relative density, relative importance values, diameter
distributions, and the ratio of sapling biomass to total sugar maple
biomass at three spatial positions near the southern boundary of the
species’ range using forest inventory data from the USDA Forest
Service’s Forest Inventory and Analysis program over a 20-year
observation period (1990-2010),” during which time temperatures
increased and summer precipitation declined.
And what did they discover?
Range expansion (!). Hart et al. write that,
In contrast to a contraction of the sugar maple range,
our results corroborate the pattern of increased mesophyte (including
sugar maple) density and dominance that has been widely reported
throughout the Central Hardwood Forest of the eastern US, including
sites near the southern range boundary (e.g., Hart and Grissino-Mayer,
2008; Hart et al., 2008; Schweitzer and Dey (2011).
Or put another way, they say the results of their study indicate that
(1) “over the past 20 years, the southern range boundary of sugar maple
has neither contracted nor expanded,” and that (2) “when accounting for
documented northern range boundary shifts (Woodall et al.,
2009), these results indicate an expansion of the geographic
distribution for sugar maple at this time attributed to the relatively
stable southern range boundary.”
Clearly, the rise in temperature and decline in precipitation
observed across the study area has had no negative impact on sugar maple
populations, despite model projections to the contrary. Rather, the
observed response has been positive, and largely so as
evidenced by increased sugar maple density, dominance and range
expansion. To most rational people, these observations represent
benefits. To climate alarmists, they are problematic, inconvenient
truths which they tend not to acknowledge."
"American spending on education is in line with that of our peers in
the developed world -- a little higher than some, a little lower than
others, but not really remarkable either way:
That black bar represents total spending, and as you can see, we
spend more on education than most of our peers, not less. To be sure,
that is partly driven by our very high spending on tertiary education,
aka college. But we spend more than most of our peers at most levels,
not just on college.
Of course, we're richer than many of our peers, so maybe we should
spend more. If you look at spending as a percentage of gross domestic
product, we're no longer the highest, we're just average:
We spend more than many of our peers on college and late secondary
education, less than a few on primary and early secondary school.
Perhaps we should reallocate those resources, diverting more into
earlier education. But this is not a problem of inadequate overall
investment -- and Japan and Switzerland, which spend less than we do,
are hardly Third World hellholes.
What about public investment? Is the problem that we don't put enough
public funds into education? I find these sorts of arguments rather
unconvincing -- the idea seems to be that we should spend more
government money on education not because there's a gap we've
identified, but simply for the purpose of spending more government money
on education. But at any rate, we spend quite a lot of public funds on
education at all levels:
And when you look at primary, secondary and post-secondary training, we're on par:
You can argue that there's an inequality problem in our schools. In
fact, I think there is obviously an inequality problem in our schools,
but that the big problem is not at the college level, but rather in the
primary and secondary schools that are overwhelmingly government-funded.
And those disparities are also not primarily about the dollar amounts
going into schools -- Detroit spends well above the U.S. average per pupil, and yet one study found that half the population of the city was "functionally illiterate."
"It is just as likely that improvements will come from changing methods
and reallocating resources as that they will require us to pour more
money into failing institutions."
"Maybe Keynesianism doesn’t work if the country you try it in has “H” as its first letter. The Economist reports:
FEW countries have suffered an earthquake so devastating,
or have been less prepared for such a calamity. The quake that struck
Haiti on January 12th 2010 killed perhaps 200,000 people—no one is sure
how many—left 1.5m homeless and caused economic damage equivalent to
120% of the country’s GDP. A cholera epidemic compounded the misery.
These disasters called forth the biggest-ever outpouring of humanitarian
relief, worth some $9.5 billion in the first three years after the
quake. The well-wishers vowed, in the words of Bill Clinton, who helped
co-ordinate their early efforts, to “build back better”. Yet five years
later, the country is little better off than it was before the
disaster—and in some ways it is worse.
Worse? After all those broken windows?
And that’s with the money and resources to repair the broken windows
coming from outside the economy. Perhaps some other factors hurt Haiti
in the meanwhile and those factors explain why the aid didn’t help. But I
will continue to maintain that destruction is not good for human beings
or the economy they interact in. And that the act of spending money
doesn’t generate wealth other than for those who receive the money."
"With all the talk about “disparities” in innumerable contexts,
there is one very important disparity that gets remarkably little
attention — disparities in the ability to create wealth.
People who are preoccupied, or even obsessed, with disparities in
income are seldom interested much, or at all, in the disparities in the
ability to create wealth, which are often the reasons for the
disparities in income.In a market economy, people pay us for benefiting
them in some way — whether we are sweeping their floors, selling them
diamonds or anything in between. Disparities in our ability to create
benefits for which others will pay us are huge, and the skills required
can develop early — or sometimes not at all.
Gross
inequalities in skills and achievements have been the rule, not the
exception, on every inhabited continent and for centuries on end. Yet
our laws and government policies act as if any significant statistical
difference between racial or ethnic groups in employment or income can
only be a result of their being treated differently by others.
Nor
is this simply an opinion. Businesses have been sued by the government
when the representation of different groups among their employees
differs substantially from their proportions in the population at large.
But, no matter how the human race is broken down into its components —
whether by race, sex, geographic region or whatever — glaring
disparities in achievements have been the rule, not the exception."
"So the results are in. The main US global-temperature scorekeepers -
NASA and the NOAA - say that last year was definitely the hottest year
on record. But they've been contradicted by a highly authoritative
scientific team, one actually set up to try an establish objective facts
in this area.
On the face of it, there's no dispute. The NASA and NOAA (National Oceanographic and Atmospheric Administration) statement says:
The year 2014 ranks as Earth’s warmest since 1880, according to two
separate analyses by NASA and National Oceanic and Atmospheric
Administration (NOAA) scientists.
But in fact, detecting a global average temperature
rise - of less than a degree since the 1880s, as all sides agree - among
thousands upon thousands of thermometer readings from all over the
world and spanning more than a century is no simple matter. The
temperature at any given location is surging up and down by many degrees
each day and even more wildly across a year. It can be done, across a
timescale of decades, but trying to say that one year is hotter or
colder than the next is to push the limits of statistics and the
available data. This sort of thing is why the battle over global
temperatures tends to be so hotly debated.
A few years ago, a new dataset was established called
the Berkeley Earth Surface Temperature project. It was intended to
address various issues raised by climate sceptics: but in fact it has
plumped down firmly on the warmist side of the debate, saying that in
fact there are no undue biases in the temperature records, changes in
the Sun do not have any major climate effects, and so on.
Now, however, the BEST boffins have broken ranks with
the NASA/NOAA/UK Met Office climate establishment and bluntly
contradicted the idea that one can simply say "2014 was the hottest year
on record". According to BEST's analysis (pdf):
Our best estimate for the global temperature of 2014 puts it slightly
above (by 0.01 C) that of the next warmest year (2010) but by much less
than the margin of uncertainty (0.05 C). Therefore it is impossible to
conclude from our analysis which of 2014, 2010, or 2005 was actually the
warmest year.
That may seem like not such a big deal, but it is
really. At the moment the big debate in this area is about the "hiatus" -
has global warming been stalled for the last fifteen-years-plus, or
not?
If you think it hasn't, and you're seeking to
convince ordinary folk without advanced knowledge in the area, it is a
very powerful thing to be able to say "last year was the warmest on
record".
If on the other hand you contend that global warming
has been on hold for over a decade, saying "last year was almost exactly
as hot as 2005 and 2010" fits exactly with the story you are trying to
tell.
It matters, because colossal amounts of CO2
have been emitted during the hiatus period - on the order of a third of
all that has ever been emitted by humanity since the Industrial
Revolution, in fact. Nobody says that CO2 isn't a greenhouse gas, but it could well be that it isn't nearly as serious a problem as had been suggested.
You takes your choice of who you listens to on this, of course: NASA/NOAA/UKMetO or BEST, warmists or sceptics.
But it might be worth remembering that the former are
arguing for massive government and economic action, action which people
would not take voluntarily - that is action which will make people
poorer, then. In other words the warmists want to take away your money
and your standard of living (for your own good, they would say). And
standard of living is not just consumer goods, it's health care, it's regular showers and clean clothes,
it's space programmes and education for your kids and many many other
things that you will have less of in the green future advocated by
warmists - it's your whole life.
Whereas the sceptics, certainly the more reasonable
among them, are merely saying "look here wait a minute". Which is always
a good idea before taking massive governmental and economic action,
some would say, especially as rather a lot has been done in that line already.
And one thing's for sure - given NASA/NOAA/UKMet's attitude this year ("hottest on record") compared to 2013 ("one more year of numbers isn't significant"),
the idea that they aren't actively pushing a warmist agenda - the idea
that they are in some way unbiased and objective about all this - is
quite plainly rubbish."
Ed Miliband’s disastrous threat to introduce extreme price controls into the domestic energy market has cost the country dear
"Imagine that the energy market worked the way many politicians – Labour, of
course, but even some members of the coalition – apparently believe that it
operates. It would be impossible to know how much turning on the radiator or
taking a bath was going to cost. Prices to consumers would vary drastically
and immediately depending on supply and demand conditions in the global
economy. It would be chaos, and the politicians would be the first to rush
to denounce it.
The good news, of course, is that it doesn’t work that way, never has and
never will. Prices for consumers are deliberately smoothed. We know how much
we are going to pay because our energy providers buy gas in advance. The
energy most of us consume today was generally purchased by our provider in
2013 or 2014, at the market prices of the time. This allows gas companies to
contractually agree a fixed price with their customers, and at least allows
a degree of medium-term predictability. Risk is passed on, albeit at a
price; insurance is never costless.
All of this is one reason why the 30pc or so drop in wholesale prices since
the commodity’s recent peak are only now starting to have an impact.It
takes time for price changes to filter through to consumers; in theory, it
could easily take two years for the entire decline to be felt. E.ON recently
announced that it would be cutting prices by 3.5pc; British Gas owner
Centrica is pushing through a 5pc cut, reducing the bills of 6.8m people by
an average of £37 a year from February 27. By waiting a little longer,
Centrica was able to cut by more. Both firms are actually taking a risk:
they are assuming that wholesale prices won’t bounce back immediately and
permanently.
Some believe the firms should have cut earlier. But if companies like Centrica
start cutting prices by 1pc every few weeks, they would also then have to
start hiking them by 1pc every few weeks when conditions reverse, as they
undoubtedly will one day. In extremis, one returns to the idiotic scenario
described at the start of this article, something which nobody in their
right minds would want.
Others believe that prices should be falling by more. But how? Wholesale only
represents half or so of the total price of gas. Other costs include
transport and distribution costs, which are going up partly as a result of
increased spending by National Grid. Green taxes and other costs have also
risen over the past few years. Energy firms’ profit margins are pretty low,
as their annoyed shareholders would be the first to point out.
Take a hypothetical supplier that buys wholesale gas gradually over a two-year
period in advance of delivery. Such a company would expect its wholesale
costs for the year to be roughly 11pc lower as a result of the slide in
market prices. Given that wholesale only accounts for half the bill, and
there are lots of other uncertainties and changing costs, a 5pc drop in
consumer prices seems exactly right.
Ed Miliband’s disastrous threat to introduce extreme price controls into the
domestic energy market has had entirely pernicious and predictable effects.
It has frightened companies and added risk that shareholders are only too
aware of. It has probably slightly increased the cost of capital, reducing
investment in an area that is desperate for it. It has incentivised at least
some companies to agree to even longer supply contracts, thus further
delaying the positive impact of falling wholesale prices. It has been a
disastrous policy that has cost the country dear. Labour needs to go back to
the drawing board, and fast, if it wants to rebuild its shattered economic
credibility.
Take wealth statistics with a pinch of salt
Hold the front page: 22-year-old US medical students, who generally go on to
earn many millions during their lifetimes, are officially among the poorest
people in the world. Ditto MBA students who’ve just joined Goldman Sachs or McKinsey.
Genuinely, heartbreakingly poor workers who subsist on $1 a day in emerging
economies, by contrast, are deemed to be better off than these two
demographics – or so the statistics would have us believe.
Why, you ask? How could this possibly be so? The reason for these nonsense
numbers is that the medics and business school graduates have very large
unsecured debts, far bigger than almost anybody anywhere, and thus have a
hugely negative net wealth. A poor worker in an emerging economy is deemed
far richer – in part because they don’t have access to credit.
Absurd? Of course, but that is the methodology used in most reports on global
wealth inequality. As the Adam Smith Institute points out, it makes no sense
to look at net wealth without also examining the incomes people are likely
to earn in future from wages, investments and pensions. The shock and
oft-cited statistics about the share of total wealth owned by the richest
are based on such misleading net wealth figures. If gross wealth were used,
or if adjustments were made for disposable income and living standards, the
picture would look significantly less unequal. The bottom 80pc may
statistically own just 5.5pc of the world’s net wealth, but that is because
they have mortgages. They control far more of the world’s assets than such
numbers suggest.
The latest Oxfam study on net wealth falls into the same trap. It also has two
other failings. For years, the share of net wealth held by the top 1pc
globally kept on falling; it started to rise again with the global recovery
and quantitative easing but remains lower than it was 15 years ago, a point
which the report didn’t emphasise. Its most eye-catching finding – that the
top 1pc could soon own more than half of the world’s net wealth – is just an
extrapolation of very temporary trends and exceptional circumstances. Who
knows what will happen next? Stock markets could fall, and the top 1pc’s
share could decline. There is no science here, mere speculation.
The report misses the real story: the collapse in genuine global poverty and
the explosion in living standards in India, China and much of Africa in
recent years. There is much more wealth than there used to be, and far more
previously poor people now share in its fruits. African poverty, measured
correctly, fell by 38pc between 1990 and 2011. Any system that delivers such
a wonderful improvement gets my vote."
"Economic freedom is one of the main drivers of prosperity
and growth, and the evidence shows that states with low levels of
economic freedom reduce the ability of their citizens to prosper
economically, while states with high levels of economic freedom maximize
their citizens’ ability to prosper economically.
Consider that in the most economically free U.S. states, the average
per-capita GDP in 2012 (the most recent year of available data) was
about $55,000, while in the least economically free states it was just
$48,000. In fact, the jurisdictions in the least-free quartile on what
my colleagues call “the world-adjusted, all-government index” had an
average per-capita GDP of just $10,079, compared to $57,269 for the
most-free quartile."
"At today’s price of $2.09 per gallon, gasoline prices in the US are the
lowest in history, adjusting for increased fuel economy and higher wages
as the chart above illustrates. At today’s average fuel economy of 25.1
miles per gallon, a typical car would require just under four gallons
of gas, which would cost $8.32 at today’s price of $2.09. At the
estimated average hourly wage today of $20.82, a typical worker would
have to work for 24 minutes to earn enough pre-tax income to purchase
the gas required to drive 100 miles, and that brings the “time cost of
gas” priced in minutes of work to the lowest level in US history.
It’s therefore a great time for us to acknowledge and celebrate the
importance of falling gas and oil prices, as Jeffrey Tucker suggests in
his excellent and timely article “All Hail the Tumbling Price of Gas: The people against the powerful at the pump.”
As Jeff points out, consumers should be especially happy about today’s
low gas prices because there are many very powerful special interest
groups who are very unhappy that gas prices are approaching $2.09 per
gallon (and 43.5% below the $3.70 price in April) and that oil prices
are below $50 per barrel.
As Jeff describes it, today’s low gas
prices are an impressive tribute to the “marvels of the market” and he
points out that there are at least eight very powerful special interest groups who benefit from high prices for gas and oil,
and they hate today’s low prices. But even the combined power of those
eight powerful groups hasn’t been able to counteract the powerful market
forces that have brought gas prices down so quickly and dramatically:
Despite
it all — and despite every effort by the world’s most powerful people —
all the pressure is downward. It’s a shock, to be sure, but a glorious
one. The low price comes about despite a vast and unrelenting barrage of
policies and attempts to raise it. Think for a moment of all the
powerful interests in the world that have pushed for higher gas prices
only to see their ambitions frustrated by a reality they despise.
1. The environmentalists
are desperate for higher prices because they are against driving and
internal combustion generally, which they believe spoil the planet. They
want us pedaling around on bicycles as in Mao’s China or enduring mass
transit, or slogging from place to place on foot. They’ve been hectoring
us about this for decades. A high price for gas is the best way to
bring about their dream to discourage consumption. They cringe with
every penny drop. “Fracking” is their F-bomb.
2. And don’t forget about the gloom-and-doom industry.
It was only some 10 years ago that “peak oil” theorists were explaining
to us how oil was running out and prices were going to soar. We’d
better start hoarding, they said, because soon the pumps will be dry.
How wrong they were. The new gloomers are all about the supposedly
terrible glut of oil.
3. The oil industry itself
is similarly unhappy with lower prices because they devastate profits
and make it impossible to fund more drilling, production, and
exploration. When the oil industry was closest to the presidency, under
the Bush years — both father’s and son’s presidencies — it worked to
keep prices and production high. Even war for oil became part of this
strategy. The industry’s benchmark price is $100 per barrel of crude.
But it has no power to make that happen. That’s because the oil industry
doesn’t finally control the price of its product.
4. Some of the world’s richest and most powerful states,
from Saudi Arabia to Russia to Iran to the United Arab Emirates,
consider high oil prices to be their lifeblood. A US gas price that is
double or triple the current one could mint a slew of new billionaires.
As it is, the rich and mighty just sit watching the price and weep with
their heads in their hands. How pathetic was the statement by King
Abdullah of Saudi Arabia who said in a speech that he would deal with a
lower price “with a firm will”? Will as much as you want, Your Highness,
but it is not going to matter. Your will is not decisive. No one’s is.
5. In the United States, both states and localities
depend on oil for their entire revenue stream. Politicians in places
like Alaska, Texas, and Louisiana are actually in emotional meltdown
about this price trend. If they could fix it, they would.
6. Then there are the urban planners
— not to speak of legions of intellectuals — who loathe lower prices.
They want prices to soar to punish all us drivers and get us to use
their subways, buses, and taxi monopolies instead. That we keep
insisting on sitting in our comfy bucket seats and driving these
machines around makes them crazy. Low gas prices only encourage us to do
more of what we love — and what they hate.
7. It’s been a huge priority for government generally to subsidize alternative energies,
ones that don’t depend on fossil fuels. So long as gas remains
affordable, alternative fuels will not get the boost that regulators
want them to.
8. Then there are the central banks
run by people who are convinced that falling gas prices are a bad omen
of generalized deflationary trends. For five years, they’ve fought
relentlessly against deflation, but there is a crucial thing they can’t
control: the rate at which people themselves spend and borrow. There’s
the rub. It’s because consumers haven’t cooperated that the Fed has not
achieved its aims.
Jeff finishes his article with this excellent summary of “power of the market” and the “power of market prices”:
If
the market price were a person, he or she would be the wisest, most
clever, most powerful person on the planet, causing the multitudes, even
the ruling class with enough weaponry to destroy the planet, to submit
and bow down in awe. The simple and unassuming price — so humble and yet
so decisive for human decision making — is this concise point of data, a
mere number, that actually causes nations to rise and fall, topples the
mighty, and humbles the arrogant with its truth-telling, rational, and
yet unpredictable movements.
Those who want to rule the world fear
the market price for this reason, but peaceful people experience it as a
gentle force that grounds our daily lives in reality in the midst of
artificiality, pomp, and phoniness. The powerful can shake their fists
at it, the intellectual class may curse it, and the moralists can
denounce it, but no one can make it obey the dictates of those who
purport to stand above it, much less make it go away.
The market
price is our salvation from the despotism of those who would rule us.
The price of gas is a lovely example. And who benefits in the end? You
and I. All the activities of the market are ultimately directed toward
pleasing the consumers, the 99 percent who are the real rulers of the
world. The 1 percent have no power in the face of global forces of
competition, supply, and demand.
Take comfort from the gasoline
price. It indicates that the powerful aren’t really what they believe
they are. In the long run, decentralized markets always outpace and
outwit the ability of elites to dictate and manipulate them. Every penny
by which the price drops signals to the world: freedom can prevail even
in a world in which the powerful are conspiring to destroy it.
Bottom Line:
With the price of gasoline at its lowest level ever when adjusted for
fuel economy and measured in “time cost,” it’s a great time to celebrate
the “marvel and power of the market and market prices” and Jeff Tucker
does that exceptionally well in his article. Resource economist Julian Simon
must be smiling right now because he predicted throughout his
noteworthy career that the prices of commodity and resources would
generally trend downward in the long run due to market forces,
innovation, and technology. Today’s low gas and oil prices are an
appropriate tribute to Julian Simon, and a compelling confirmation of
his many decades of work and writing on resource economics."
By Charles Blahous. Charles Blahous is a senior research fellow for the Mercatus Center, a research fellow for the Hoover Institution, a public trustee for Social Security and Medicare, and a contributor to e21. Excerpts:
"The problem in a nutshell is that Social Security’s disability trust
fund is running out of money. The latest trustees’ report projects a
reserve depletion date in late 2016. By law Social Security can only
pay benefits if there is a positive balance in the appropriate trust
fund (there are two: one for old-age and survivors’ benefits (OASI), the
other for disability benefits). Absent such reserves, incoming taxes
provide the only funds that can be spent. Under current projections, by
late 2016 there will only be enough tax income to fund 81 percent of
scheduled disability benefits. In other words, without legislation
benefits will be cut 19 percent. "
"The cause of the problem is that DI costs have grown faster than the
program’s revenue base. In 1990, the cost of paying DI benefits equaled
1.09 percent of taxable wages earned by workers. This year the
relative cost is more than double that: 2.37 percent of the tax base."
"The biggest reason is the growing number of beneficiaries, though
real per capita benefits are also growing. Disabled population growth
reflects several factors, including most notably the historically large
baby boom generation moving through their ages of peak disability
incidence (45-64). In addition, today more women have been employed
long enough to be insured for disability benefits than was the case in
earlier decades.
The growth in beneficiaries exceeds prior
projections even after taking these factors into account. For example,
the Chief Actuary reports that “the prevalence of disability among
insured workers on an age-sex adjusted basis” rose by 42 percent from
1980 to 2010, even though there is no evidence suggesting that actual
disability is much more common than it was thirty years ago. Instead the
rise reflects causes ranging from a liberalization of eligibility criteria in 1984, to a surge in disability benefit applications when unemployment rose during the Great Recession."
"Consider China and India. In each country, both coal and oil
use increased by at least a factor of 5 over the last 40 years,
producing nearly all their energy—and both life expectancy and
prosperity skyrocketed. Sources: BP, Statistical Review of World Energy 2013, Historical
data workbook; World Bank, World Development Indicators (WDI) Online
Data, April 2014
The story is clear—both life expectancy and income increased
rapidly, meaning that life got better for billions of people in just a
few decades. For example, the infant mortality rate has plummeted in
both countries—in China by 70 percent, which translates to 66 more
children living per 1000 births. India has experienced a similar
decrease, of 58 percent.
Not only in China and India, but around the world, hundreds of millions
of individuals in industrializing countries have gotten their first
lightbulb, their first refrigerator, their first decent-paying job,
their first year with clean drinking water or a full stomach. To take
one particularly wonderful statistic, global malnutrition and
undernourishment have plummeted—by 39 percent and 40 percent,
respectively, since 1990."
"Back in the 1970s and 1980s, many leading environmentalists had
predicted that this would be not only deadly, but unnecessary due to the
cutting-edge promise of solar and wind (sound familiar?). Then as now,
environmental leaders were arguing that renewable energy combined with
conservation—using less energy—was a viable replacement for fossil
fuels."
"From the 1970s to the present, fossil fuels have overwhelmingly been
the fuel of choice, particularly for developing countries. Today the
world uses 39 percent more oil, 107 percent more coal, and 131 percent
more natural gas than it did in 1980.
Solar and wind are a minuscule portion of world energy use."
"The poor benefited most of all—but they would have stayed destitute had we listened to leading environmentalists."
"It is false that we are making the underdeveloped world more vulnerable to climate disaster.
Here is a graph of climate related deaths in the G7 nations, the
leaders of the developed world, vs. the world as a whole, including
underdeveloped nations.
Sources: EM-DAT International Disaster Database; World Bank, World Development Indicators (WDI) Online Data, April 2014
If we look at year-to-year data, there is a dramatic difference
between the heavy fossil fuel users and the light fossil fuel users in
climate-related deaths—you are much, much safer in an industrialized
country. But those in non-industrialized countries are still better
off—climate-related deaths are going down for everyone."
"Our technologies and our wealth have given poorer countries better,
cheaper everything: materials for building buildings, medicine, food for
drought relief. The scientific and medical discoveries we have made in
the time that has been bought with fossil fuel-powered labor-saving
machines benefit everyone around the world."