Evaluating the free market by comparing it to the alternatives (We don't need more regulations, We don't need more price controls, No Socialism in the courtroom, Hey, White House, leave us all alone)
Wednesday, September 10, 2025
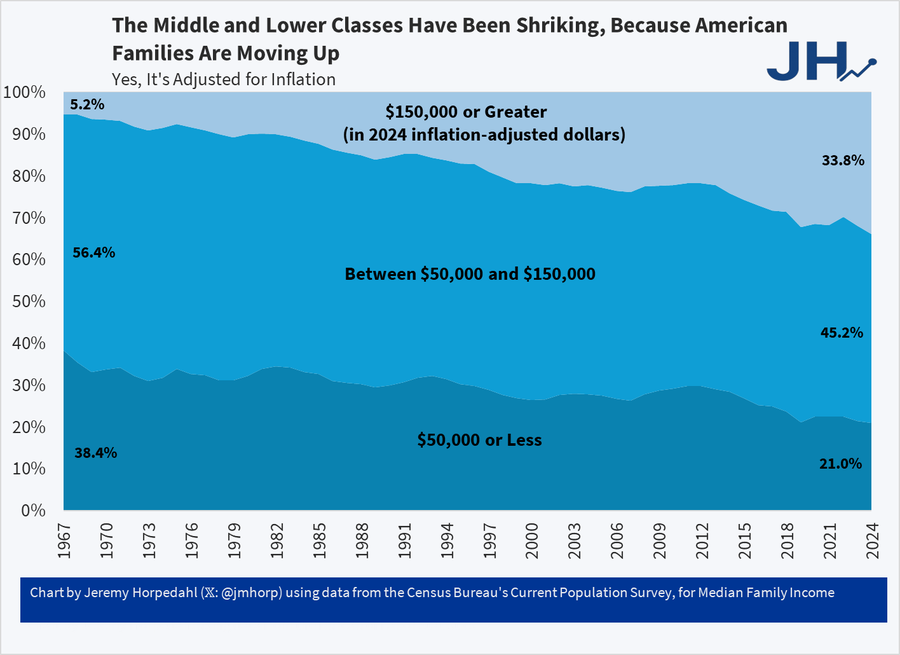
Over 1/3 of American families now have over $150,000 of income, the first time in history (yes, it's adjusted for inflation)

No comments:
Post a Comment
Note: Only a member of this blog may post a comment.