Evaluating the free market by comparing it to the alternatives (We don't need more regulations, We don't need more price controls, No Socialism in the courtroom, Hey, White House, leave us all alone)
Tuesday, March 22, 2016
Spending inequality is far smaller than wealth inequality
"Our study focuses on lifetime spending inequality because economic
well being depends not just on what we spend this minute, hour, week or
even year. It depends on what we can expect to spend through the rest of
our lives.
Measuring lifetime spending inequality for a
representative sample of U.S. households was a massive, multi-year
undertaking, which may explain why ours is the first such study."
"So what did we learn?
First, spending inequality—what we should
really care about—is far smaller than wealth inequality. This is true
no matter the age cohort you consider.
Take 40-49 year-olds. Those
in the top 1 percent of our resource distribution have 18.9 of net
wealth but account for only 9.2 percent of the spending. In contrast,
the 20 percent at the bottom (the lowest quintile) have only 2.1 percent
of all wealth but 6.9 percent of total spending. This means that the
poorest are able to spend far more than their wealth would imply—though
still miles away from the 20 percent they would spend were spending
fully equalized."
"The fact that spending inequality is dramatically smaller than wealth
inequality results from our highly progressive fiscal system, as well
as the fact that labor income is distributed more equally than wealth.
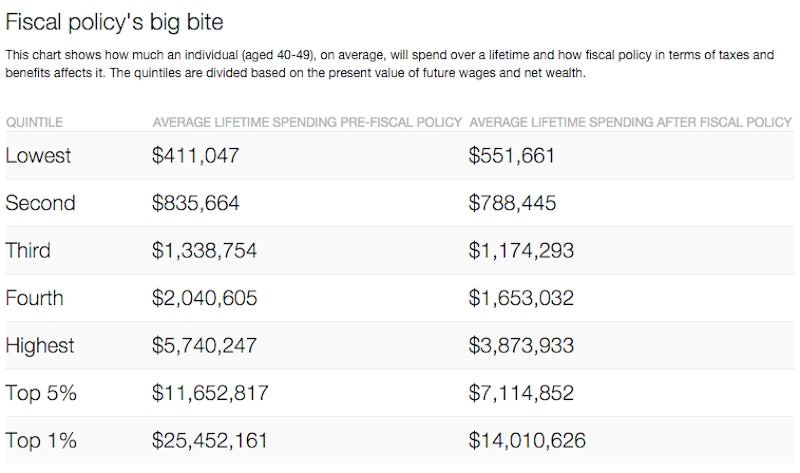
The
top 1 percent of 40-49 year-olds face a net tax, on average, of 45
percent. This means that the present value of their spending is reduced
by the fiscal system to 55 percent of the present value of their
resources. So someone in that age group who has resources with a present
value of $25.5 million can spend $14 million of it after fiscal policy.
For
the bottom 20 percent, the average net tax rate is negative 34.2
percent. In other words, they get to spend 34.2 percent more than they
have thanks to government policy (they get to spend, on average,
$552,000 over their lifetimes, which exceeds their $411,000 in average
lifetime resources). The table below illustrates this for all quintiles.
Source: Federal Reserve 2013 Survey of Consumer Finances, Author Analysis
To be clear, spending power remains extremely unequal.
Our
point is that the fiscal system, taken as a whole, does materially
reduce inequality, not in what people own or earn, but in what they get
to spend.
This limits the scope to further equalize spending power
by taxing the top 1 percent at a much higher rate. Indeed, among 40-49
year-olds, confiscating all the remaining spending power of the top 1
percent (with a 100 percent tax rate) and giving it to the poorest 20
percent would leave the latter group with 16.1 of total spending power,
which is still less than 20 percent. And this hypothetical calculation
assumes the jobs and incomes of those workers aren’t adversely affected
by such a policy, which they most certainly would be."
No comments:
Post a Comment
Note: Only a member of this blog may post a comment.
No comments:
Post a Comment
Note: Only a member of this blog may post a comment.